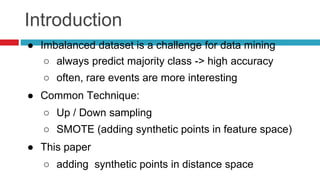
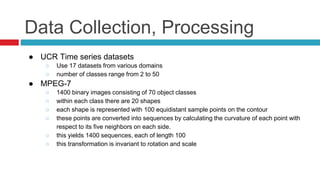
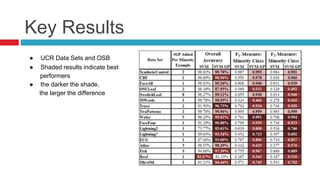
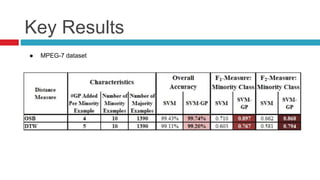
Improving SVM classification on imbalanced
time series data sets with ghost points
Presenter: Shang-Tse Chen
Authors: Suzan Köknar-Tezel, Longin Jan Latecki
Introduction
● Imbalanced dataset is a challenge for data mining
○ always predict majority class -> high accuracy
○ often, rare events are more interesting
● Common Technique:
○ Up / Down sampling
○ SMOTE (adding synthetic points in feature space)
● This paper
○ adding synthetic points in distance space
Research Question
● For time series data
○ not intuitive to represent as features in Rn
○ distance between two sequence is non-metric
○ Cannot use SMOTE
● In many applications, pair-wise distance is more relevant
○ many classifier only need pair-wise distances,
■ eg. SVM, knn
○ many good algorithms to compute distance in time
series data, e.g. DTW, OSB, …, etc.
Research Question
● Can we add synthetic data in distance space?
● Does it improve the performance?
Methodology
● Given any two points a, b in a distance space X, we can define a
ghost point e = μ(a,b).
● For every x ∈ X, the distance from x to e, d(x, μ(a,b)) is as follows:
○ case 1: {x, a, b} is a metric, then
■ d(x, µ(a, b))2 = ½ d(x, a)2 + ½ d(x, b)2 - ¼ d(a, b)2
○ case 2: If d(a, b) > d(x, a) + d(x, b), then
■ d(x, µ(a, b)) = ½ d(a, b) - d(x, b)
○ case 3a: If d(x, a) > d(x, b) + d(a, b), then
■ d(x, µ(a, b))2 = d(x, b)2 + ¼ d(a, b)2
○ case 3b: If d(x, b) > d(x, a) + d(a, b), then
■ d(x, µ(a, b))2 = d(x, a)2 + ¼ d(a, b)2
Data Collection, Processing
● UCR Time series datasets
○ Use 17 datasets from various domains
○ number of classes range from 2 to 50
● MPEG-7
○ 1400 binary images consisting of 70 object classes
○ within each class there are 20 shapes
○ each shape is represented with 100 equidistant sample points on the contour
○ these points are converted into sequences by calculating the curvature of each point with
respect to its five neighbors on each side.
○ this yields 1400 sequences, each of length 100
○ this transformation is invariant to rotation and scale
Key Results
● UCR Data Sets and OSB
● Shaded results indicate best
performers
● the darker the shade,
the larger the difference
Key Results
● UCR Data Sets and DTW
Key Results
● MPEG-7 dataset
Summary
● Proposed a new approach for over-sampling the minority
class of imbalanced data
● Unlike other feature based methods, the ghost points
are added in distance space.
● Ghost points can be added to non-metric distance space
○ Can be used with DTW, OSB, and many more.
● Empirical results show significant improvement
Critique of work
● For large-scale data, over-sampling is time consuming
● Introduce another parameters, i.e. the number of
ghost points that we should add
● May not perform well in highly noisy data

Md2k 0219 shang

  • 1.
    Improving SVM classificationon imbalanced time series data sets with ghost points Presenter: Shang-Tse Chen Authors: Suzan Köknar-Tezel, Longin Jan Latecki
  • 2.
    Introduction ● Imbalanced datasetis a challenge for data mining ○ always predict majority class -> high accuracy ○ often, rare events are more interesting ● Common Technique: ○ Up / Down sampling ○ SMOTE (adding synthetic points in feature space) ● This paper ○ adding synthetic points in distance space
  • 3.
    Research Question ● Fortime series data ○ not intuitive to represent as features in Rn ○ distance between two sequence is non-metric ○ Cannot use SMOTE ● In many applications, pair-wise distance is more relevant ○ many classifier only need pair-wise distances, ■ eg. SVM, knn ○ many good algorithms to compute distance in time series data, e.g. DTW, OSB, …, etc.
  • 4.
    Research Question ● Canwe add synthetic data in distance space? ● Does it improve the performance?
  • 5.
    Methodology ● Given anytwo points a, b in a distance space X, we can define a ghost point e = μ(a,b). ● For every x ∈ X, the distance from x to e, d(x, μ(a,b)) is as follows: ○ case 1: {x, a, b} is a metric, then ■ d(x, µ(a, b))2 = ½ d(x, a)2 + ½ d(x, b)2 - ¼ d(a, b)2 ○ case 2: If d(a, b) > d(x, a) + d(x, b), then ■ d(x, µ(a, b)) = ½ d(a, b) - d(x, b) ○ case 3a: If d(x, a) > d(x, b) + d(a, b), then ■ d(x, µ(a, b))2 = d(x, b)2 + ¼ d(a, b)2 ○ case 3b: If d(x, b) > d(x, a) + d(a, b), then ■ d(x, µ(a, b))2 = d(x, a)2 + ¼ d(a, b)2
  • 6.
    Data Collection, Processing ●UCR Time series datasets ○ Use 17 datasets from various domains ○ number of classes range from 2 to 50 ● MPEG-7 ○ 1400 binary images consisting of 70 object classes ○ within each class there are 20 shapes ○ each shape is represented with 100 equidistant sample points on the contour ○ these points are converted into sequences by calculating the curvature of each point with respect to its five neighbors on each side. ○ this yields 1400 sequences, each of length 100 ○ this transformation is invariant to rotation and scale
  • 7.
    Key Results ● UCRData Sets and OSB ● Shaded results indicate best performers ● the darker the shade, the larger the difference
  • 8.
    Key Results ● UCRData Sets and DTW
  • 9.
  • 10.
    Summary ● Proposed anew approach for over-sampling the minority class of imbalanced data ● Unlike other feature based methods, the ghost points are added in distance space. ● Ghost points can be added to non-metric distance space ○ Can be used with DTW, OSB, and many more. ● Empirical results show significant improvement
  • 11.
    Critique of work ●For large-scale data, over-sampling is time consuming ● Introduce another parameters, i.e. the number of ghost points that we should add ● May not perform well in highly noisy data