Download to read offline


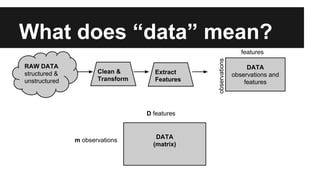


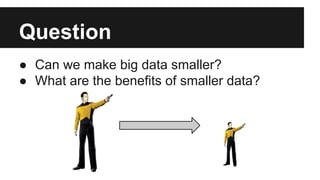

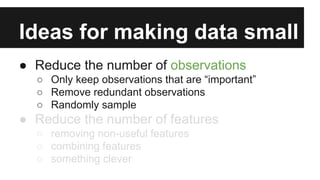
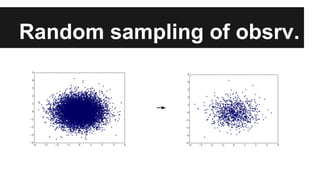

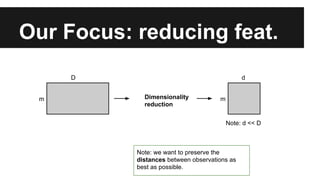
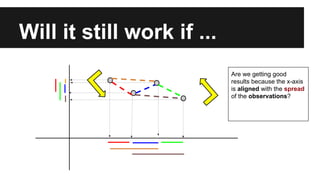
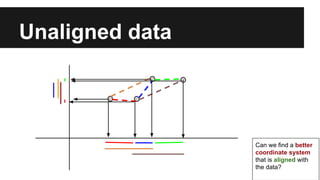
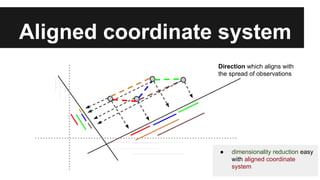
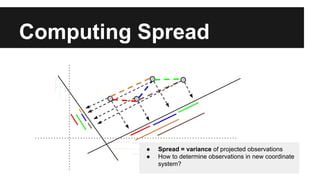
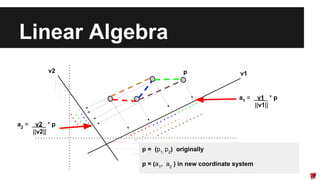
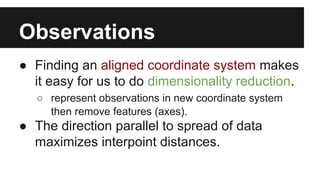

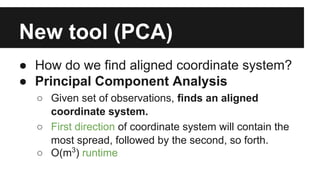

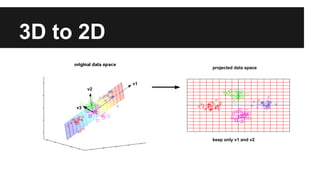

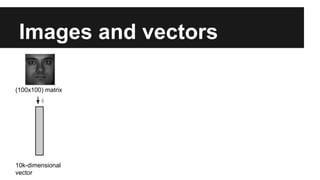
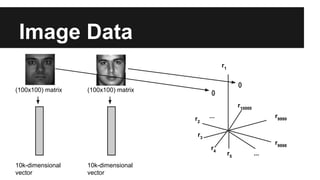
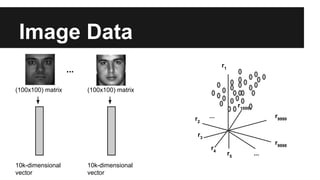
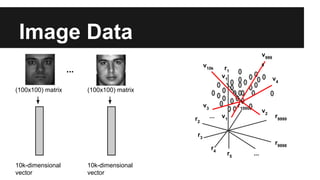
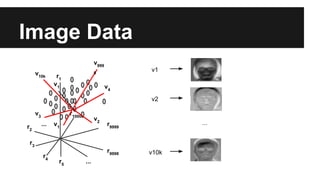
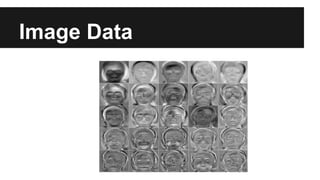
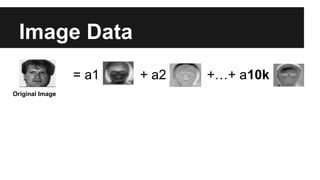
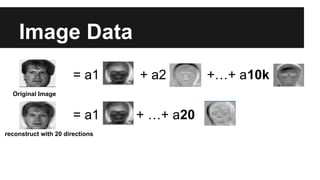
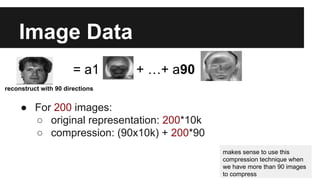
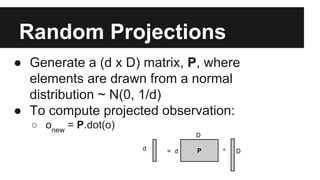
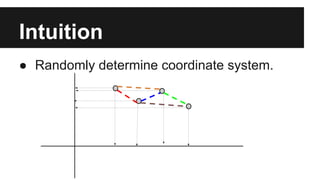
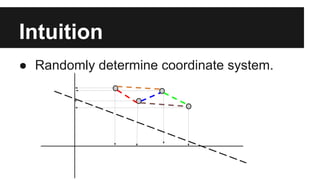

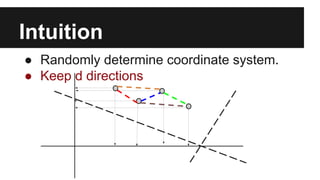
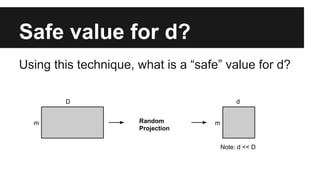
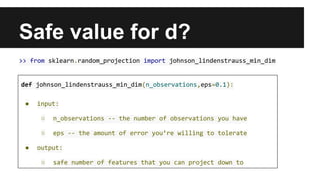
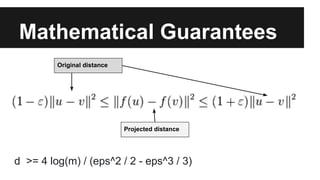

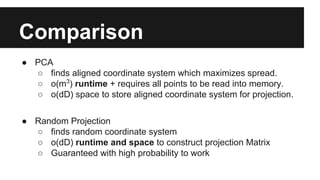


- The document discusses techniques for reducing the size of large datasets ("big data") by reducing the number of observations and features. - Dimensionality reduction techniques like principal component analysis (PCA) and random projections can reduce the number of features to a lower dimensional space while preserving distances between observations. - PCA finds an aligned coordinate system that maximizes the spread of data, while random projections randomly determine a coordinate system. Both techniques can significantly compress datasets, especially those with many redundant features like images.