Download as PDF, PPTX


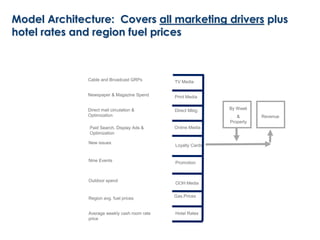
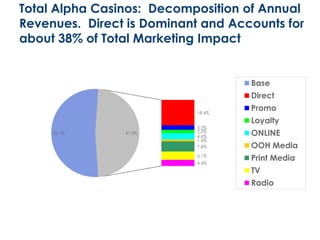


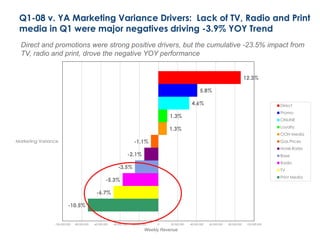
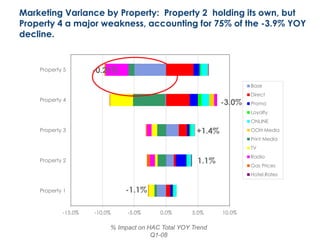
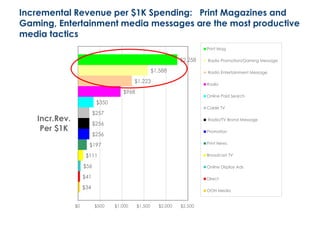
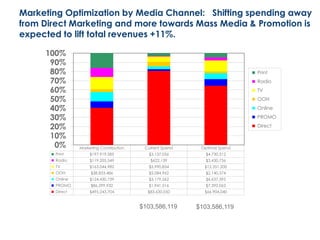
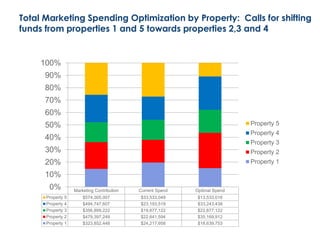

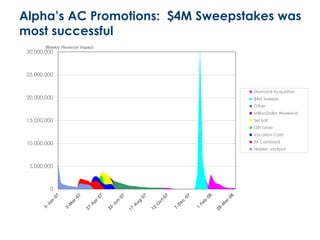
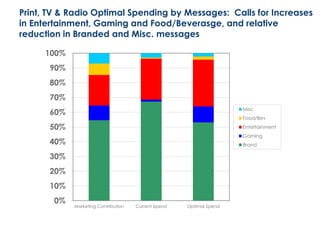
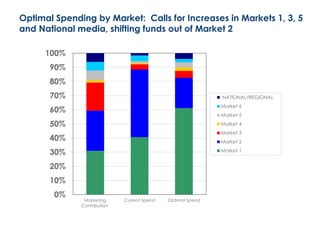

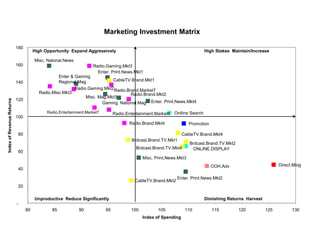
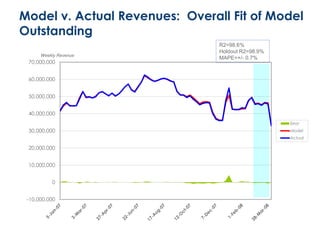


The document outlines a marketing response and optimization model for Alpha Casinos, focusing on marketing architecture, revenue decomposition, and optimization strategies across various properties and media channels. It highlights the significant impact of media presence, especially television and radio, on revenue performance and suggests reallocating marketing spending from underperforming to high-performing areas. Additionally, it discusses the influence of external factors such as fuel prices on revenue and emphasizes the importance of marketing synergies in maximizing overall effectiveness.