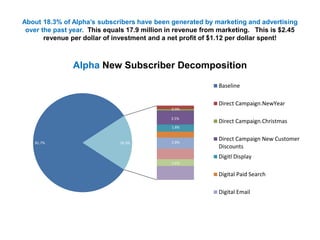
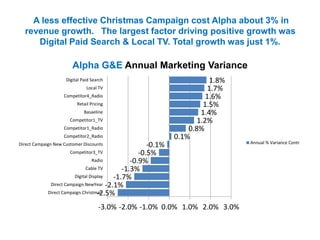
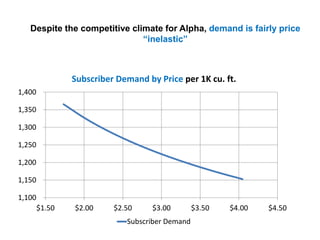
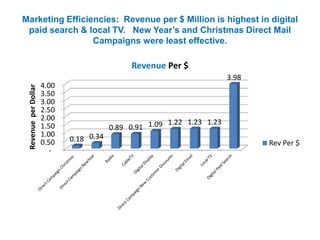
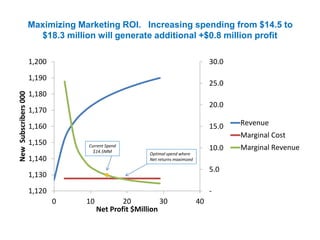
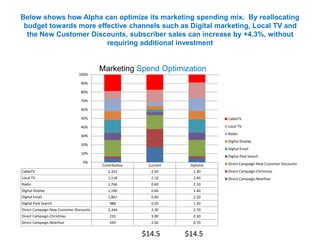
This is a story of how a retail natural gas firm used marketing/media response model to re-engineer its marketing spend to drive higher growth and climb out of a stagnant business situation
2. The Destination
• This presentation is all about destroying a well quoted marketing
myth. That came from the famous marketing guru, John
Wannamaker, who said “I know that half of my advertising budget is
wasted, I just don’t know which half”.
• This is a story about a company in the increasingly competitive and
unregulated utility business. This will show not only that the ROI of
media and marketing can be measured, but how this knowledge can
be applied and executed in order to drive higher levels of revenue
and newly acquired customers.
• Here, you will be exposed to a data analytic exercise commonly
referred to as marketing/media mix modeling; and how one retail
utility applied this technique to re-energize its sales and drive higher
level of new subscriber growth!
3. The Situation
• The following is a case study based on real data. Names have been
masked to protect confidentiality.
• Alpha Gas & Electric recently hired a new CMO, Robert Emory, to
guide their retail residential utility services marketing. Alfa suffered
from anemic +1% growth and Robert was charged to find ways to
improve marketing productivity and customer acquisition in a
competitive market. Alpha was one utility competing in a non-
regulated retail market.
• Robert started by engaging in a marketing modeling project. The
purpose of this project was to determine what current marketing
activities were working and which were not; and to truly measure
and understand marketing return-on-investment Most
importantly, the ultimate goal was to develop fact-based evidence
to drive and accelerate Alpha’s growth over the next year.
4. Modeling Architecture
We develop a marketing/media mix model for Alpha linking Digital/Traditional media,
pricing, weather and the economy to weekly retail subscriptions.
Digital Display
Wezther Temp & Precip
Paid Search
Digital Email
Competitive Media
Rates & Prices
TV Media Network & Cable
Radio Advertising & Direct Mailings
Macro-Economic Measures
Seasonality
Weekly
Customer
Subscriptions
5. Model Validation
-1000
0
1000
2000
3000
4000
5000
1/5/2004 1/5/2005 1/5/2006 1/5/2007
Actual
Model
Variance
R2=96.1 Holdout R2=97.7 MAPE = +/- 7.7%
Holdout
Forecast
Below shows how our predictive model fits to actual sales and how well we were able to predict a blind holdout
6. About 18.3% of Alpha’s subscribers have been generated by marketing and advertising
over the past year. This equals 17.9 million in revenue from marketing. This is $2.45
revenue per dollar of investment and a net profit of $1.12 per dollar spent!
81.7%
0.9%
3.5%
1.8%
2.8%
1.6%
18.3%
Alpha New Subscriber Decomposition
Baseline
Direct Campaign.NewYear
Direct Campaign.Christmas
Direct Campaign New Customer
Discounts
Digitl Display
Digital Paid Search
Digital Email
7. A less effective Christmas Campaign cost Alpha about 3% in
revenue growth. The largest factor driving positive growth was
Digital Paid Search & Local TV. Total growth was just 1%.
-2.5%
-2.1%
-1.7%
-1.3%
-0.9%
-0.5%
-0.1%
0.1%
0.8%
1.2%
1.4%
1.5%
1.6%
1.7%
1.8%
-3.0% -2.0% -1.0% 0.0% 1.0% 2.0% 3.0%
Direct Campaign.Christmas
Direct Campaign.NewYear
Digital Display
Cable TV
Radio
Competitor3_TV
Direct Campaign New Customer Discounts
Competitor2_Radio
Competitor1_Radio
Competitor1_TV
Basaeline
Retail Pricing
Competitor4_Radio
Local TV
Digital Paid Search
Alpha G&E Annual Marketing Variance
Annual % Variance Contr
8. Despite the competitive climate for Alpha, demand is fairly price
“inelastic”
1,100
1,150
1,200
1,250
1,300
1,350
1,400
$1.50 $2.00 $2.50 $3.00 $3.50 $4.00 $4.50
Subscriber Demand by Price per 1K cu. ft.
Subscriber Demand
9. Marketing Efficiencies: Revenue per $ Million is highest in digital
paid search & local TV. New Year’s and Christmas Direct Mail
Campaigns were least effective.
-
0.50
1.00
1.50
2.00
2.50
3.00
3.50
4.00
0.18 0.34
0.89 0.91 1.09 1.22 1.23 1.23
3.98
RevenueperDollar
Revenue Per $
Rev Per $
10. Maximizing Marketing ROI. Increasing spending from $14.5 to
$18.3 million will generate additional +$0.8 million profit
-
5.0
10.0
15.0
20.0
25.0
30.0
1,120
1,130
1,140
1,150
1,160
1,170
1,180
1,190
1,200
0 10 20 30 40
NewSubscribers000
Net Profit $Million
Revenue
Marginal Cost
Marginal RevenueCurrent Spend
$14.5MM
Optimal spend where
Net returns maximized
11. Below shows how Alpha can optimize its marketing spending mix. By reallocating
budget towards more effective channels such as Digital marketing, Local TV and
the New Customer Discounts, subscriber sales can increase by +4.3%, without
requiring additional investment
Contribution Current Optimal
CableTV 2,322 2.50 1.30
Local TV 1,118 2.10 2.60
Radio 1,766 0.60 2.10
Digital Display 1,190 0.60 1.40
Digital Email 1,867 0.40 2.20
Digital Paid Search 988 0.50 1.20
Direct Campaign New Customer Discounts 2,344 2.30 2.70
Direct Campaign.Christmas 233 3.00 0.30
Direct Campaign.NewYear 593 2.50 0.70
0%
10%
20%
30%
40%
50%
60%
70%
80%
90%
100%
CableTV
Local TV
Radio
Digital Display
Digital Email
Digital Paid Search
Direct Campaign New Customer Discounts
Direct Campaign.Christmas
Direct Campaign.NewYear
$14.5 $14.5
Marketing Spend Optimization