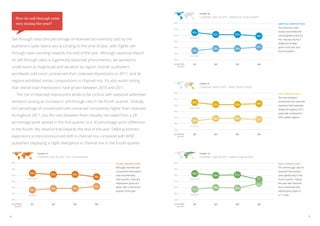
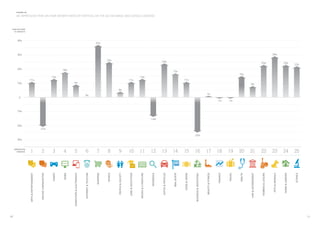
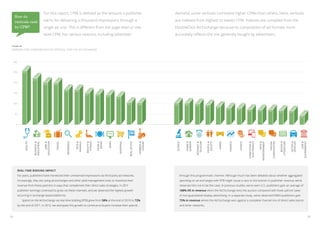
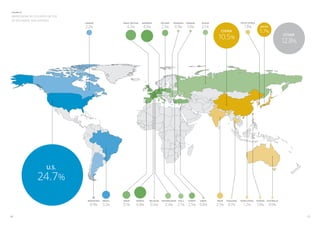
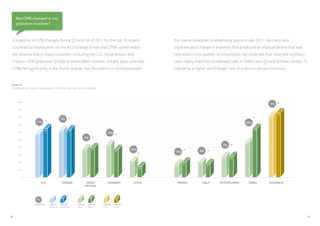
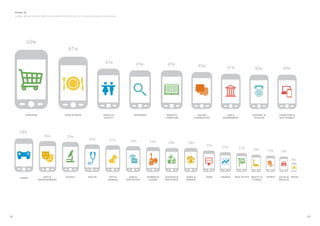
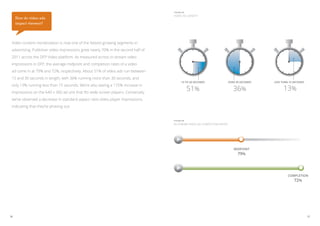
1) The document analyzes trends in the publisher display business based on data from Google publisher products. It finds that globally, unreserved impressions were higher than reserved impressions in 2011, though the gap narrowed towards the end of the year.
2) Arts & Entertainment was the top vertical by impressions and grew 11% year-over-year. Shopping and Sports also saw strong growth. The US, China, and Japan were the top countries by impressions.
3) CPMs varied widely by country, with some like the US and UK seeing growth from Q3 to Q4 2011 while others like Spain and Italy declined.
This document analyzes the effectiveness and efficiency of TV advertising versus YouTube Masthead advertising for a Heineken beer campaign.
1) TV reached more people but Masthead was more cost-efficient, providing 15% of campaign effects for only 9% of the budget.
2) Combining TV and Masthead produced higher impacts on key performance indicators than either medium alone, demonstrating synergy between the two.
3) Masthead was most efficient for targeting men aged 20-34, but TV is still needed for its greater reach. The analysis aimed to integrate online and offline advertising and compare their relative impacts and costs.
This document discusses measuring the effectiveness of social media marketing. It presents challenges in measuring social media due to the many platforms and metrics. The author advocates taking a holistic approach to analyze how all marketing activities, external factors, and economic conditions impact business goals. Econometric analysis of comprehensive data over time can determine what activities are most effective. The document provides examples of content, relevance, and impact social media metrics and recommends tying metrics to business goals to optimize marketing spend across channels. It raises measuring "social capital" as an emerging issue and invites participation in a pilot study.
The document discusses developing a marketing strategy for a new "natural" line of Pantene conditioners. It identifies the prime prospect as women aged 40-50 seeking confidence through natural beauty products. The strategy focuses on positioning the new line against competitor Timotei in the natural product segment. It proposes a distribution strategy in supermarkets, discounters, and chemical stores along with promotional pricing and in-store merchandising tactics to target the prime prospect and increase Pantene's market share in the growing natural hair care category.
This document discusses Sony Australia's marketing strategy and the results of an analysis of the effectiveness of their marketing spend in driving TV sales. It finds that traditional offline media like TV and print advertising are the largest drivers of offline sales, accounting for 35% and 21% respectively. Paid search also contributes significantly at 9% of offline sales. The analysis aims to optimize Sony's marketing mix to generate greater revenue from the same investment levels by understanding the response curves for each marketing channel.
This document provides an overview and analysis of advertising spending by the top 100 leading national advertisers in the United States in 2006 and 2007. Some key points:
- Total ad spending by the top 100 advertisers rose 3.1% to a record $104.8 billion in 2006, with most growth coming from unmeasured media like direct marketing and digital communications.
- Measured media like TV, print and internet advertising accounted for 58.2% of spending, down from 59.6% in 2005, as major advertisers extended their reach through unmeasured channels.
- Procter & Gamble was the top advertiser for the 50th time, increasing spending 6.8% to $4.
1. The document provides an economic and market overview as of October 1st 2010, summarizing key economic data such as GDP growth, inflation and unemployment rates, interest rates, and house and commodity prices.
2. It discusses factors that create value for customers, including reputation, trust in suppliers, and knowledgeable sales staff. Price is also important but these intangible factors provide advantages.
3. The author urges businesses to audit their reputation and ensure all staff consistently support this, as reputation really matters in competitive markets where price and time pressures are high. Maintaining a good reputation helps avoid becoming purely price-led.
MIU Conference 2005 Planning Workshops in Beer-ShevaNachman Shelef
www.miu.org.il
MIU - Movement for Israeli Urbanism
Planning Workshops as part of the Conference in Beer-Sheva 2005
מרחב - התנועה לעירוניות מתחדשת בישראל
כנס באר-שבע
The document is a reflection on arriving in Israel 40 years ago. It includes a photo from that time of the author's mom, sister, and themselves. The same location is revisited, which is now a conservatorium of music in Beer Sheva, where the former concert hall used to be. The document also lists two pieces of music: Sugar Cane Rag by Scott Joplin and a piece performed by Itzhak Perlman and Andre Previn.
Transit Score is a metric to measure public transit accessibility. The document discusses calculating Transit Score for Israel using General Transit Feed Specification (GTFS) data. A 100m by 100m grid is overlaid on Israel. Transit Score is computed for each grid cell by processing GTFS data, filtering for specific areas, and normalizing grid cell scores. KML files are generated to view Transit Scores on maps in Google Earth. Higher scores indicate better transit access.
The document provides information about Amir Mueller Landscape Architects, an ecological landscape design firm operating since 2000. It summarizes several of the firm's projects including the Ein Gev Bird-Watching Site, Raba Creek Restoration, Northern Gas Lines, Netanya Regional Plan, Rishonim High School, Eshkolot Elementary School, Verizland Garden, Gush Katif Memorial, Bell Garden, and Biet Eshel National Monument. For each project, it provides the location, challenges, solutions, status and credits. It also describes the firm's philosophy, services, and residential/resort projects including Vision India, Beerot Hila, and Jewish Brigade Street.
This document summarizes residential real estate market trends in Orange-Chatham counties from 2012 to the first half of 2013. It finds that the market has strengthened, with sales, prices and inventory declining while days on market have decreased. Specifically, sales have increased over 2012 levels in all areas, with inventory declining between 20-40% and prices and days on market also rising. The document concludes that the local housing market momentum has shifted to favor sellers as distressed property listings drop.
This document provides an overview of urban planning in Israel from 1948 to 2011. It discusses several key plans and policies that shaped Israel's development, including the Sharon Plan in 1952 which aimed to settle immigrants and disperse the population throughout the country. The National Outline Plan 35 from 2005 focused on strengthening cities, public transport, and regional development. Facts from 2009 show Israel's high population density and urbanization, with most people living in 220 cities and towns. The document also notes Tel Aviv's ranking as the 52nd largest metro economy in the world.
OpenX Survey: Programmatic + Premium: Current Practice & Future TrendsDigiday
The document discusses current practices and future trends in programmatic and premium advertising. Some key findings include:
- 71% of both publishers and buyers are currently engaged in programmatic ad trading.
- Publishers, as well as buyers, are trading both non-guaranteed and guaranteed inventory programmatically. However, "Programmatic Premium" is a more familiar term to publishers than buyers.
- While the percentage of programmatic inventory is currently small for many publishers, both publishers and buyers anticipate increasing their investments and volume in programmatic over the next year.
OpenX WhitePaper: Programmatic + Premium: Current Practices and Future TrendsDigiday
The document discusses current practices and future trends in programmatic and premium digital advertising. Both publishers and buyers are committed to programmatic trading and plan increased investment. Currently, 71% of publishers and buyers trade programmatically and expect double-digit growth. While programmatic revenues are up for 55% of respondents, some achieve better success than others. There are opportunities for programmatic to replace elements like billing/reconciliation and optimization, though publishers have concerns about maintaining control and relationships that may need addressed for further growth.
This document discusses improving sales incentive programs to motivate more than just the top 20% of salespeople. It argues that traditional 80/20 models of sales performance are unreliable, and that most sales actually come from the top 46% of salespeople. The author advocates for segmenting salespeople based on performance, setting individualized goals based on past performance baselines, and designing incentives that can motivate salespeople at all performance levels. Over 550 programs that used this approach saw engagement and improved performance throughout the salesforce, including significant contributions from the bottom 20-40% of salespeople.
Features major direct marketing and advertising trend with long term impact, details the 7 profit drivers for insurance direct marketing and explores Web 2.0 opportunities for direct marketers.
Global Programmatic spend and growth by media format and device North American programmatic spend and growth, with a focus on the United States EMEA programmatic spend and growth, with a focus on the UK, Germany, France, Italy and Spain APAC programmatic spend and growth, with a focus on China, Japan and Australia Latin American programmatic spend and growth, with a focus on Brazil Glossary and methodology summary The most important findings from the September 2016 MAGNA Programmatic Intelligence update.
Next-Generation Campaign Section Title Validation & OptimizationVivastream
This document summarizes the key findings from a study conducted by comScore in 2007-2008 that analyzed over 8 digital advertising campaigns across multiple metrics. Some of the main findings included:
- Only 19% of ad impressions actually reached the target audience frequency of 5 or more, while 61% of impressions hit the target audience fewer than 4 times
- Cookie-based targeting led to inaccuracies, with only 70% accuracy for 1 demographic target and 11% for 3 demographic targets
- Cookie deletion inflated ad frequency and deflated reach, sometimes by over 2.5 times
- 64% of users shared computers, challenging cookie-based identification
- A later initiative called 3MS aimed to improve measurement and reduce complexity in the
This document discusses a case study where a national retail chain with over 300 stores saw declining sales despite consistent media spending. The objectives were to understand the impact of media on sales for geographic clusters and optimize spending. Models were developed at the cluster level and optimization reallocated spending within the same total to maximize predicted sales lift. The outcome was a suggested media reallocation that reduced spending by $2M while generating an additional 2% in sales.
Sprint's Next Generation Campaign Validation & OptimizationVivastream
The document summarizes findings from a study that analyzed digital advertising campaigns across multiple advertisers. Some key findings included:
- On average, only 69% of ad impressions were viewed, meaning 31% of ads were not seen. In-view rates varied significantly by site.
- Geographic targeting was not always accurate, with some ads being delivered to regions outside the intended geography.
- Some ads were placed on content deemed unsafe for brands.
- Above-the-fold ad placement did not guarantee visibility, with in-view rates ranging from 48-100%. Some below-the-fold ads had high visibility rates too.
- There was a weak correlation between ad pricing (CPM) and in-view
Publishers face the ever-changing complexities of selling display ads and reaching new audiences. As a business partner to publishers around the world, Google is no stranger to these challenges. We rely on data-based insights to guide our business decisions. During our routine deep-dives into the publisher display dynamics, we frequently notice trends that may be of interest to our clients as well, which is what prompted us to introduce this research publication.
This document summarizes sponsorship ROI data from an FMCG brand's engagement with a property. It shows that the total customer base is 90.7 million, of which 15.4 million are passionate fans and 9.8 million can recall the sponsorship. Importantly, 6.3 million consumers are delighted by the sponsorship. The sponsorship provides brand lifts in trial, advocacy, and main brand usage, linked to both passion for and appreciation of the sponsorship. Sponsorship can impact brands through different mechanisms like passion or appreciation.
The document summarizes key findings from IBM's 2012 survey of marketers. It finds that marketers at high-performing companies take a more expansive role in leading the customer experience across the entire purchasing cycle. These marketers have greater ownership of products, pricing, place, and promotion. They also integrate marketing messages across channels and use analytics to measure performance. However, many marketers still struggle with data integration and leveraging online visitor data. The document advocates for marketers to remove silos, expand their strategic role, and better integrate technology and data to optimize the customer experience.
Sprint's Next Generation Campaign Validation & OptimizationVivastream
This document summarizes the findings of a study on digital advertising campaign delivery and optimization. Some key points:
- A 2007 study of 8 digital campaigns in the US found that only 19% of ad impressions actually reached the target audience, while 61% were shown to people in the US but outside the target.
- Cookie-based targeting is problematic due to high cookie deletion rates and proliferation of cookies across devices. Targeting accuracy declines significantly as more targeting criteria are added.
- A new initiative called 3MS aims to improve measurement, reduce complexity, and bolster confidence in digital ads.
- A charter study analyzed over 2 billion impressions across 18 campaigns and found on average only 69% of ads were
The document discusses how marketers are challenged by today's complex marketing environment and how conventional marketing mix models are limited in their ability to address this complexity. It introduces ThinkVine's agent-based marketing mix modeling approach, which simulates individual consumer behavior from the bottom-up to provide more accurate forecasts and insights. ThinkVine's software allows marketers to optimize their spending, tactics, targets, and timing to improve ROI across all of their marketing investments.
Shopper marketing is one of the fastest growing areas of advertising and promotions for CPG companies. Over the next three years, 83% of companies plan to increase their investments in shopper marketing, with 55% expecting to grow it over 5% annually. This is fueled by the need to better influence shoppers across the entire path to purchase and generate measurable results. Traditional media spending is declining as shopper marketing moves to center stage. CPG companies are investing in shopper marketing to capture insights on shoppers and create effective campaigns to engage deal-driven consumers in a fragmented marketing environment.
The efficiency of online advertising (Andrew Felbert - Nielsen)SEMPL
The nature of online advertising allows us the chance to deeply understand performance but in the past we haven’t done a very good job of making these capabilities work for us. The Nielsen representatives will show us how we are able to understand the effectiveness of brand based advertising online and use this information to become more efficient, but this requires organizational and attitudinal change.
This document discusses the need for consistent and transparent metrics to evaluate the effectiveness of digital advertising, particularly for brand campaigns. It addresses two key measures: 1) Reach and frequency metrics to evaluate audience delivery and campaign efficiency, and 2) Engagement metrics to validate the value digital media provides to brands. The document argues that combining publisher data with panel data allows calculating digital metrics like audience reach and frequency comparable to traditional media. However, engagement metrics are also needed to measure attention to ads and correlate it with subsequent brand behavior.
The document discusses metrics for evaluating the effectiveness of digital advertising for brand campaigns. It addresses the need for consistent measures of both quantity (audience reach and frequency) and quality (engagement with ads). For quantity, the document proposes using ad server and panel data to measure campaign reach and frequency among target audiences. For quality, it suggests that total dwell time (time spent interacting with ads) may correlate with favorable brand outcomes if standardized across campaigns. The document concludes that providing these audience and engagement metrics can help digital advertising fulfill marketers' needs around transparency and ROI measurement.
The document discusses metrics for evaluating the effectiveness of digital advertising for brand campaigns. It addresses the need for consistent measures of both quantity (audience reach and frequency) and quality (engagement with ads). For quantity, the document proposes using ad server and panel data to measure campaign reach and frequency. For quality, it suggests using total ad dwell time as a proxy for attention that correlates with downstream brand outcomes. The goal is to provide transparent, consistent metrics that are meaningful to advertisers for planning, optimizing and evaluating digital brand campaigns.
Effectiveness of Digital Advertising For Brand CampaignsEyeblaster Spain
The document discusses metrics for evaluating the effectiveness of digital advertising for brand campaigns. It addresses the need for consistent measures of both quantity (audience reach and frequency) and quality (engagement with ads). For quantity, the document proposes using ad server and panel data to measure campaign reach and frequency among target audiences. For quality, it suggests that total dwell time (time spent interacting with ads) may correlate with favorable brand outcomes if standardized across campaigns. The document concludes that providing these audience and engagement metrics can help digital advertising fulfill marketers' needs around transparency and ROI measurement.
Back to-school spending grows as parents restock, replenish children’s needs中文互联网数据研究资讯中心--199it
The document is a survey of 8,509 adults in the United States conducted in July 2012 about back-to-school shopping. Some key findings include:
- 31% of respondents have children aged 6-17 living in their household.
- Respondents plan to spend an average of $258 on clothing, $139 on shoes, and $100 on school supplies.
- Most shopping (67%) will be done at discount stores, with department stores, clothing stores, and online also being popular options.
- Nearly half of respondents (48%) will begin shopping 3 weeks to 1 month before school starts.
This document discusses how the economics of online advertising are affected by the supply and demand of digital ad impressions. It argues that treating all delivered ad impressions as equal creates an oversupply that depresses prices. By focusing on viewable impressions, the supply becomes limited like other media, and scarcity is reestablished. This benefits publishers by allowing them to charge prices more reflective of the true value provided to advertisers, increasing revenue potential for publishers. Overall, shifting to viewable impressions as the currency improves ad effectiveness measurement and creates a win-win scenario for advertisers, consumers, and publishers.
The document summarizes a study that analyzed how demographic-based TV media plans perform for key consumer packaged goods (CPG) brands. The study found that demo-based plans are inefficient, as they reach all buyer groups equally regardless of their value to brands. On average, brands wasted 30% of exposures on households that did not participate in their categories. Only 15% of exposures reached households that accounted for 80% of sales. Demographics are a poor surrogate for purchasing behavior, as over half of sales fell outside the largest demographic groups used for targeting. The findings suggest media plans should transition from demographic targeting to purchase-based audience buying to improve efficiency.
The document summarizes key developments in the 4-year history of the Apple App Store:
- The number of available apps has grown from 500 at launch to over 650k currently, though 334k apps have also been removed.
- The US initially dominated downloads but has lost some share to growing Asian markets like China and Japan in recent years.
- While total downloads increased, average downloads per app among the top 200 has declined from 15.4 to 8.4 as the store has become more fragmented.
- Revenues have grown due to the rise of in-app purchases, now generating 68% of revenue among top grossing apps compared to 7% four years ago.
Automobiles are a top driver of internet advertising. Cars increased their internet advertising spending by 80.2% in the period from January to April 2012, making them the fourth largest advertising product group online. Audi increased its advertising spending the most of any automaker, nearly doubling its expenditures and focusing on promoting the A1 and A4 models. Mobile display advertising for cars has also grown significantly.
Comscore media metrix ranks top 50 u.s. web properties for june 2012中文互联网数据研究资讯中心--199it
1) According to a June 2012 report by comScore, travel and retail websites saw increased traffic as summer began, with Americans booking travel and purchasing items for summer activities.
2) Top gaining categories included travel sites like hotels and cruises, as well as retail sites for sports/outdoor, toys, and tickets.
3) The top 50 overall websites included Google, Yahoo, Microsoft, Facebook and Amazon, while fast growing sites included Zynga and The Mozilla Organization.
The document discusses how retailers are working to enhance the customer experience in response to changing customer behaviors and expectations. A survey found that within five years, over 40% of retailers expect to provide personalized product details and coupons to customers based on location. Over 50% of transactions are expected to be completed via mobile. The primary drivers for retailers to invest in new technologies are improving customer service (51%) and keeping pace with competition (22%). The document argues that retailers must provide seamless omnichannel experiences to meet rising customer expectations of having information and options available both online and in physical stores.
1) "Next generation" retailers like flash sale sites dominate traditional online retailers in growing customer lifetime value in a customer's first year, capturing 385% of a customer's first month's spending on average compared to 94% for traditional retailers.
2) Customers of daily deal, group buying, and flash sale sites purchase nearly twice as frequently on average than customers of traditional online retailers, with 49-52 days between purchases compared to 89 days.
3) However, purchases from traditional online retailers are over 50% larger on average than from "next generation" retailers, at $105 compared to $61-82.
The study found that (1) Fortune Global 100 companies are mentioned over 10 million times per month on social media, primarily on Twitter, (2) social media usage among these companies has grown significantly in recent years as more create accounts and engage with users, and (3) companies are increasingly creating original content and multiple specialized accounts to target different audiences and regions on diverse platforms like Twitter, Facebook, YouTube, Google+, and Pinterest.
This document summarizes key online advertising trends from April to June 2012. It finds that while click volumes and costs increased year-over-year in the US, click-through rates were maintained. Google maintained its majority share of search traffic and spending. Exact matching of keywords grew and improved metrics over broad matching. Performance varied by industry, with trends shown for auto, business to business, education, finance, healthcare, retail, and travel. Targeting of mobile devices like smartphones and tablets is showing promise as their use increases.
This document summarizes data from a 2011 survey of over 3,800 respondents regarding social media sponsorships. Some key findings:
- 51.5% of marketers have compensated social media publishers for sponsored content.
- Marketers value a sponsored blog post at $114 on average and a sponsored tweet at $63.
- 51.5% of social media publishers have accepted compensation for sponsored content, though 77.1% dislike offers with no compensation.
- Publishers value a sponsored blog post at $190 on average, feeling their personal blogs are worth more than marketers calculate.
This document discusses the opportunities presented by big data for international development. It notes that innovations in technology have led to an explosion in the quantity and diversity of digital data being generated in real-time. This data holds potential to track development progress and understand how policies impact vulnerable populations. However, turning large and complex digital datasets into actionable information requires using computational techniques to identify trends and patterns. While big data presents opportunities, questions also remain regarding its analytical value, policy relevance, and privacy implications when used in development contexts. Overall, big data could complement traditional data sources and help narrow information gaps, but human expertise is still needed to properly analyze and interpret digital data.
The document is a survey conducted by Global Advisor on social media usage. It provides the following key information:
- The survey received responses from 19,271 individuals across various countries and demographics.
- 35% of respondents indicated they would rather be tech savvy, while 65% said they would rather be people savvy.
- The results are broken down by factors like gender, age, income level, employment status and country to show variations in preferences across different groups.
Holiday ecommerce sales in 2011 saw a 15% increase over 2010, showing strong consumer spending online. Merchants have adapted by embracing mobile commerce, with more having mobile-optimized sites and apps. Social media usage is also growing, with Pinterest seeing a rise in merchant activity. Merchants are also leveraging marketplaces more for prospecting and promotions, though some worry about losing control of customers. Overall, merchants are adapting well to changing consumer behaviors across channels.
The document summarizes key findings from the 2012 RIS/Cognizant Shopper Experience Study, which surveyed over 2,100 shoppers. It finds that while most purchases still occur in physical stores, shoppers want personalized in-store experiences. Retailers need to focus on the basics like competitive pricing and knowledgeable employees, while differentiating themselves through loyalty programs and cross-channel personalization. Shopper expectations vary between consumable and specialty products. Overall, retailers must reshape their strategies and stores to provide personalized solutions in order to keep shoppers from showrooming or buying elsewhere.
3 Simple Steps To Buy Verified Payoneer Account In 2024SEOSMMEARTH
Buy Verified Payoneer Account: Quick and Secure Way to Receive Payments
Buy Verified Payoneer Account With 100% secure documents, [ USA, UK, CA ]. Are you looking for a reliable and safe way to receive payments online? Then you need buy verified Payoneer account ! Payoneer is a global payment platform that allows businesses and individuals to send and receive money in over 200 countries.
If You Want To More Information just Contact Now:
Skype: SEOSMMEARTH
Telegram: @seosmmearth
Gmail: seosmmearth@gmail.com
Discover timeless style with the 2022 Vintage Roman Numerals Men's Ring. Crafted from premium stainless steel, this 6mm wide ring embodies elegance and durability. Perfect as a gift, it seamlessly blends classic Roman numeral detailing with modern sophistication, making it an ideal accessory for any occasion.
https://rb.gy/usj1a2
Anny Serafina Love - Letter of Recommendation by Kellen Harkins, MS.AnnySerafinaLove
This letter, written by Kellen Harkins, Course Director at Full Sail University, commends Anny Love's exemplary performance in the Video Sharing Platforms class. It highlights her dedication, willingness to challenge herself, and exceptional skills in production, editing, and marketing across various video platforms like YouTube, TikTok, and Instagram.
The Most Inspiring Entrepreneurs to Follow in 2024.pdfthesiliconleaders
In a world where the potential of youth innovation remains vastly untouched, there emerges a guiding light in the form of Norm Goldstein, the Founder and CEO of EduNetwork Partners. His dedication to this cause has earned him recognition as a Congressional Leadership Award recipient.
Industrial Tech SW: Category Renewal and CreationChristian Dahlen
Every industrial revolution has created a new set of categories and a new set of players.
Multiple new technologies have emerged, but Samsara and C3.ai are only two companies which have gone public so far.
Manufacturing startups constitute the largest pipeline share of unicorns and IPO candidates in the SF Bay Area, and software startups dominate in Germany.
❼❷⓿❺❻❷❽❷❼❽ Dpboss Matka Result Satta Matka Guessing Satta Fix jodi Kalyan Final ank Satta Matka Dpbos Final ank Satta Matta Matka 143 Kalyan Matka Guessing Final Matka Final ank Today Matka 420 Satta Batta Satta 143 Kalyan Chart Main Bazar Chart vip Matka Guessing Dpboss 143 Guessing Kalyan night
Top 10 Free Accounting and Bookkeeping Apps for Small BusinessesYourLegal Accounting
Maintaining a proper record of your money is important for any business whether it is small or large. It helps you stay one step ahead in the financial race and be aware of your earnings and any tax obligations.
However, managing finances without an entire accounting staff can be challenging for small businesses.
Accounting apps can help with that! They resemble your private money manager.
They organize all of your transactions automatically as soon as you link them to your corporate bank account. Additionally, they are compatible with your phone, allowing you to monitor your finances from anywhere. Cool, right?
Thus, we’ll be looking at several fantastic accounting apps in this blog that will help you develop your business and save time.
Brian Fitzsimmons on the Business Strategy and Content Flywheel of Barstool S...Neil Horowitz
On episode 272 of the Digital and Social Media Sports Podcast, Neil chatted with Brian Fitzsimmons, Director of Licensing and Business Development for Barstool Sports.
What follows is a collection of snippets from the podcast. To hear the full interview and more, check out the podcast on all podcast platforms and at www.dsmsports.net
[To download this presentation, visit:
https://www.oeconsulting.com.sg/training-presentations]
This PowerPoint compilation offers a comprehensive overview of 20 leading innovation management frameworks and methodologies, selected for their broad applicability across various industries and organizational contexts. These frameworks are valuable resources for a wide range of users, including business professionals, educators, and consultants.
Each framework is presented with visually engaging diagrams and templates, ensuring the content is both informative and appealing. While this compilation is thorough, please note that the slides are intended as supplementary resources and may not be sufficient for standalone instructional purposes.
This compilation is ideal for anyone looking to enhance their understanding of innovation management and drive meaningful change within their organization. Whether you aim to improve product development processes, enhance customer experiences, or drive digital transformation, these frameworks offer valuable insights and tools to help you achieve your goals.
INCLUDED FRAMEWORKS/MODELS:
1. Stanford’s Design Thinking
2. IDEO’s Human-Centered Design
3. Strategyzer’s Business Model Innovation
4. Lean Startup Methodology
5. Agile Innovation Framework
6. Doblin’s Ten Types of Innovation
7. McKinsey’s Three Horizons of Growth
8. Customer Journey Map
9. Christensen’s Disruptive Innovation Theory
10. Blue Ocean Strategy
11. Strategyn’s Jobs-To-Be-Done (JTBD) Framework with Job Map
12. Design Sprint Framework
13. The Double Diamond
14. Lean Six Sigma DMAIC
15. TRIZ Problem-Solving Framework
16. Edward de Bono’s Six Thinking Hats
17. Stage-Gate Model
18. Toyota’s Six Steps of Kaizen
19. Microsoft’s Digital Transformation Framework
20. Design for Six Sigma (DFSS)
To download this presentation, visit:
https://www.oeconsulting.com.sg/training-presentations
Call8328958814 satta matka Kalyan result satta guessing➑➌➋➑➒➎➑➑➊➍
Satta Matka Kalyan Main Mumbai Fastest Results
Satta Matka ❋ Sattamatka ❋ New Mumbai Ratan Satta Matka ❋ Fast Matka ❋ Milan Market ❋ Kalyan Matka Results ❋ Satta Game ❋ Matka Game ❋ Satta Matka ❋ Kalyan Satta Matka ❋ Mumbai Main ❋ Online Matka Results ❋ Satta Matka Tips ❋ Milan Chart ❋ Satta Matka Boss❋ New Star Day ❋ Satta King ❋ Live Satta Matka Results ❋ Satta Matka Company ❋ Indian Matka ❋ Satta Matka 143❋ Kalyan Night Matka..
The Genesis of BriansClub.cm Famous Dark WEb PlatformSabaaSudozai
BriansClub.cm, a famous platform on the dark web, has become one of the most infamous carding marketplaces, specializing in the sale of stolen credit card data.
2. 1.
Cha nnel mix 2 Publishers face the ever-changing complexities of selling display
ads and reaching new audiences. As a business partner to
publishers around the world, Google is no stranger to these
2.
Publishe r Ver ti c a l a nd 6 challenges. We rely on data-based insights to guide our
Geogra phic c o m p a r i s o ns business decisions. During our routine deep-dives into the
publisher display dynamics, we frequently notice trends
that may be of interest to our clients as well, which is what
3.
Ad S ize s 20 prompted us to introduce this research publication.
This premiere issue focuses on trends in the publisher
display business. It is not meant to be a comprehensive
industry report or forecast; rather its purpose is to share trends
4.
Mobile Web Ad I m p r es s i o ns 28 that publishers worldwide may find useful in planning digital
strategies, gleaning new insights, and supporting their hunches.
The metrics in this publication are derived from Google
publisher products—DoubleClick for Publishers (DFP), the
5.
Vid e o ad s 34 DoubleClick Ad Exchange, and Google AdSense network—to
allow us to provide commentary on various display patterns,
including geographic, vertical, and ad size trends over time.
Based on rigorous methodology, the data sets contain tens of
6.
Append ix 38 billions of impressions served by publishers globally, and are
aggregated to preserve publisher confidentiality.
1
3. Channel mix
An ongoing challenge for publishers is to strike the right balance
between direct sales (reserved) to advertisers and indirect
sales (unreserved) through third-party channels such as
networks and exchanges. How inventory is allocated between
these two channels impacts overall ad revenue, since reserved
inventory is generally sold at a higher price. In DFP, publishers
1.
assign different levels of inventory according to each channel.
These levels are aggregated here to illustrate what we’re calling
the channel mix: the ratio of impressions between reserved
and unreserved inventory.
3
4. Figure 1B
Channel mix in DFP—Americas publishers
How do sell-through rates
vary during the year? 80 % Americas Observations
The Americas most
70 %
65% closely resembled the
60 % 62% 62% overall global inventory
59%
Sell-through rates (the percentage of reserved ad inventory sold by the 50 %
unreserved
mix, varying only by a
single percentage
publisher’s sales team) vary according to the time of year, with higher sell- 40 % 41% point in the first and
38% 38%
35% fourth quarters.
through rates trending towards the end of the year. Although seasonal impact 30 %
reserved
on sell-through rates is a generally observed phenomenon, we wanted to 20 %
Quarters Q1 Q2 Q3 Q4
understand its magnitude and variation by region. Overall, publishers in 2011
worldwide sold more unreserved than reserved impressions in 2011, and all
regions exhibited similar compositions in channel mix. It’s also worth noting
Figure 1c
that overall total impressions have grown between 2010 and 2011. Channel mix in DFP—APAC publishers
80 %
The rise in reserved impressions tends to be cyclical, with seasonal advertiser APAC Observations
The ratio between
70 %
demand causing an increase in sell-through rate in the fourth quarter. Globally, 65% 63%
unreserved and reserved
60 % 62% 62% inventory held relatively
the percentage of unreserved sales remained consistently higher than reserved unreserved
steady throughout 2011,
50 %
especially compared to
throughout 2011, but the ratio between them steadily narrowed from a 28 40 % other global regions.
38% 38% 37%
35%
percentage point spread in the first quarter to a 16 percentage point difference 30 %
reserved
in the fourth. We observe that towards the end of the year, EMEA publishers 20 %
Quarters Q1 Q2 Q3 Q4
experience a more pronounced shift in channel mix compared with APAC in 2011
publishers displaying a slight divergence in channel mix in the fourth quarter.
Figure 1a Figure 1D
Channel mix in DFP—all publishers Channel mix in DFP—EMEA publishers
80 % Global Observations 80 % EMEA Observations
Although reserved and The sell-through rate for
70 % 70 %
unreserved impressions reserved impressions
64% 62% 62% 63%
60 % rose incrementally 60 % 60% 61% rose significantly in the
58%
unreserved each quarter, reserved unreserved 53% fourth quarter, closing
50 % 50 %
impressions grew at a the year with reserved
47%
40 % 42% faster rate in the fourth 40 % 40% and unreserved sold
38% 38% 37% 39%
36% quarter of the year. impressions closer to
30 % 30 %
reserved reserved a 1:1 ratio.
20 % 20 %
Quarters Q1 Q2 Q3 Q4 Quarters Q1 Q2 Q3 Q4
in 2011 in 2011
4 5
5. Publisher
Vertical and
Geographic
Comparisons Using the aggregated impressions running through DoubleClick
Ad Exchange and Google AdSense, this section compares how
unreserved publisher inventory is spread across vertical subject
2.
content and geographic areas worldwide.
7
6. Which verticals
show growth in ad
impressions?
In 2011, 15 out of the 25 publisher verticals experienced double-digit growth
in monetized impressions across AdSense and the Ad Exchange. Arts &
Entertainment ranked No.1 in impressions, while posting a healthy 11% year-
on-year increase. We also observed that both Shopping and Sports sites
showed very strong growth, at 37% and 25% respectively. Online Communities
and Business & Industrial sites experienced shifts in inventory mix, and
contracted during the year.
8 9
7. 10
0
30%
20%
10%
10%
20%
30%
40%
Ranking
Impression
% Growth
year-on-year
Figure 2a
1
Arts & Entertainment
11%
2
Online Communities
-21%
3
Games
13%
4
news
18%
5
Computers & Electronics
9%
6
Internet & Telecom
0%
7
Shopping
37%
8
Sports
25%
9
People & Society
4%
Jobs & Education
11%
10
Books & Literature
13%
11
Ad impression year-on-year growth rates by vertical on the Ad Exchange and Google AdSense
Reference
12
-14%
Autos & Vehicles
24%
13
Real Estate
17%
14
Food & Drink
11%
15
Business & Industrial
16
-25%
Beauty & Fitness
1%
17
Finance
-1%
18
Travel
-1%
19
Health
15%
20
Law & Government
8%
21
Hobbies & Leisure
23%
22
Pets & Animals
29%
23
Home & Garden
23%
24
Science
22%
25
11
8. For this report, CPM is defined as the amount a publisher demand, some verticals command higher CPMs than others. Here, verticals
How do
verticals rank earns for delivering a thousand impressions through a are indexed from highest to lowest CPM. Indexes are compiled from the
by CPM? single ad unit. This is different from the page-level or site- DoubleClick Ad Exchange because its composition of ad formats more
level CPM. For various reasons, including advertiser accurately reflects the mix generally bought by advertisers.
Figure 2B
Indexed CPM comparisons by vertical for the Ad Exchange
300
250 257
221
200
200 199
170 170
150
153 147 143
137
100 107 105 105 104 100 96
89
82 81
74 73 73 69 67
50
46
0
Health
Business &
Industrial
Jobs &
Education
travel
reference
pets &
animals
Beauty &
Fitness
food &
drink
news
shopping
Real Estate
Hobbies &
Leisure
Science
Home &
Garden
Internet &
Telecom
People &
Society
Games
Finance
Sports
Computers &
Electronics
Arts &
Entertainment
Online
Communities
Books &
Literature
Autos &
Vehicles
Law &
Government
Real-Time Bidding Impact
For years, publishers have monetized their unreserved impressions via third-party ad networks. through this programmatic channel. Although much has been debated about whether aggregated
Increasingly, they are using ad exchanges and other yield management tools to maximize their spending on ad exchanges with RTB might cause a race to the bottom in publisher revenue, we’ve
revenue from these partners in ways that complement their direct sales strategies. In 2011 observed this not to be the case. In previous studies, we’ve seen U.S. publishers gain an average of
publisher earnings continued to grow via these channels, and we observed the highest growth 188% lift in revenue when the Ad Exchange wins the auction compared with fixed upfront sales
occurring in exchange-based platforms. of non-guaranteed display advertising. In a separate study, we’ve observed EMEA publishers gain
Spend on the Ad Exchange via real-time bidding (RTB) grew from 58% at the end of 2010 to 72% 73% in revenue where the Ad Exchange won against a complete channel mix of direct sales teams
by the end of 2011. In 2012, we anticipate this growth to continue as buyers increase their spends and other networks.
12 13
9. Which countries
generate the most
impressions?
publicité
광고
One of the most fascinating aspects of online advertising is seeing content
originate from all over the world. North America and Western Europe have
traditionally produced the largest online publishing businesses, and remain the
廣告
powerhouses of online content. In 2011, Asia-Pacific publishers, especially
from East Asia, are delivering an even larger share of global impressions. With
rising internet accessibility and usage growing worldwide, some of the fastest
growth rates are being experienced by publishers outside these traditional
hot-spots of digital advertising, presenting attractive regional diversification
opportunities for publishers.
This global map calls out the 2011 impression contributions of the top 25
Anuncio
publisher countries on DoubleClick Ad Exchange and Google AdSense.
We’ve been incredibly impressed by the size and growth from publishers
based in China and Japan, who comprise 11% and 6% of total impressions,
Объявление
respectively. We also observe that publishers located in EMEA are
experiencing significant impression growth. pubblicità
Publishers included in this report come from 235 countries
and territories—from established, highly populated nations like
Japan right through to the island country of Palau, one of the
More and more ad networks—of which Google AdSense is one—
allow anyone with an internet connection and original content
to earn revenue as an online publisher, facilitating creation of
広告
Anzeige
world’s newest sovereign states. Below, we’ve highlighted some local content and new business models. Some are very small
emerging markets that are posting extraordinary ad impression countries in terms of population, but post ad impression growth
growth in 2011, and are ones to watch. rates that are (almost!) out of this world.
Egypt 45% growth Laos 382%
Indonesia 85% growth Equatorial Guinea 4635% growth
Venezuela 79% growth Montserrat 990% growth
Kenya 157% growth Palau 1106% growth
14 15
10. Figure 2C
Impressions by country on the
Ad Exchange and AdSense
canada great britain germany poland romania Ukraine russia south korea
2.2% 4.2% 4.9% 2.5% 0.9% 1.0% 2.1% 1.8% Japan
china 5.7%
10.5% other
12.8%
U.S.
24.7%
Argentina brazil spain france belgium Netherlands Italy turkey israel India thailand hong kong taiwan australia
0.9% 3.2% 3.1% 4.8% 0.6% 2.4% 2.1% 2.5% 0.8% 2.5% 0.7% 1.2% 1.0% 0.9%
16 17
11. Has CPM changed in top
publisher countries?
A snapshot of CPM changes during Q3 and Q4 of 2011 for the top 10 largest the overall slowdown in advertising spend in late 2011. Germany also
countries by impressions on the Ad Exchange shows that CPMs varied widely. experienced a change in inventory that produced an atypical decline that was
We observe that in many countries—including the U.S., Great Britain, and restricted to this quarter. In conjunction, we observed that reserved inventory
France—CPM grew over Q3-Q4. In some EMEA markets, notably Spain and Italy, sales nearly matched unreserved sales in EMEA over Q3 and Q4 (see Section 1),
CPMs fell significantly in the fourth quarter, but this seems to correspond with indicating a higher sell-through rate of premium-priced inventory.
Figure 2D
Changes in CPM by publisher country on the Ad Exchange
200
5%
180
173
160 165
2%
11% 39%
140
130 131
125 127
120 -16%
117
4%
100
94
88 0%
80
76
79 -33% -8%
74 14%
60
56 56
40 43
41 40
36 37
29
20
0
U.S. canada great germany spain france Italy Netherlands israel australia
britain
%
%Growth CPM Q3 CPM Q4 CPM Q3 CPM Q4 CPM Q3 CPM Q4
Americas Americas EMEA EMEA apac apac
18 19
12. Ad Sizes
Publishers can maximize their revenue by choosing to offer
ad sizes that are in higher demand by advertisers. They aim
to strike a balance between customized ad packages with
exclusive sizes that can be tailored to the needs of an individual
3.
advertiser, and standardized sizes that will accommodate
creatives from the majority of advertisers and networks.
21
13. Which ad sizes
are growing in
popularity?
300 x 250
Publishers make decisions on ad sizes based on the audience they wish to
target, the content environment, and the ad size that advertisers prefer to
use to reach that audience. To determine the most popular ad sizes and
728 x 90
identify any growth trends, we took a look at ad sizes trafficked through the 320 x 50
DFP ad serving platform. The top three ad formats—the medium rectangle,
leaderboard and skyscraper—comprise nearly 80% of all served ad
impressions. However, the remainder of impressions span a wide variety of
uncommon sizes. There were over one thousand different ad sizes trafficked—
yet only 300 unique sizes posted more than 1 million impressions during 2011. 300 x 600
The growth in non-standard ad sizes is notable, and it has mostly been at 468 x 60
the expense of traditional ad sizes like the 468 x 60 banner and 120 x 600
skyscraper. Of interest is the growth of larger “premium” formats, which
160 x 600 300 x 100
offer advertisers a richer visual canvas for their creatives.
88 x 31
120 x 600
336 x 280
22 23
14. Figure 3a
Growth of top 10 ad sizes by impressions served through DFP and platforms
119%
120%
100%
80%
70%
% of impressions
60%
% Growth Q1–Q4
40% 37%
33% 32%
21%
20% 18%
13%
10%
3% 2% 2% 2% 2% 1% 1% 1%
0%
20% -16% -15%
300 x 250 728 x 90 160 x 600 468 x 60 120 x 600 300 x 100 88 x 31 300 x 600 336 x 280 320 x 50
Top Three Ad Units Smaller-sized ad units Premium ad sizes Mobile ad sizes
The medium rectangle, leaderboard, and In general, impressions shrank in this category. The In 2011, 300 x 600 and its companion sizes 300 x 50 and In 2011, mobile optimized sizes, including 320 x 50
skyscraper comprise the vast majority of ads 468 x 60 banner and 264 x 60 half banner, as well as 300 x 100 grew by double digits, and were particularly and 300 x 50, experienced record growth among
served. All three posted robust growth rates. buttons 125 x 125 and 120 x 120, have become less favored by News, Sports, and Entertainment publishers. publishers. The 300 x 50 is the 21st most popular
popular. The only small unit that is holding its ground The increase in the 300 x 600 unit is indicative of a trend ad size, but grew 186% in 2011.
is the 88 x 31 micro bar, which is mostly used to where publishers are offering more visually impactful
advertise financial products. ad sizes that are favored by brand advertisers, over the
functionality to direct response advertisers.
24 25
15. How do ad sizes
compare by CPM?
The CPM index of the 10 most popular ad sizes on the Ad Exchange shows that Ad networks show fewer ad size variations since most sellers and buyers have
the 300 x 250 medium rectangle posted a 12% increase over the leaderboard standardized their offered inventory to reflect the most popular ad sizes. One
and an 18% increase over the skyscraper formats in 2011. The top three explanation for the relatively high CPM of the 336 x 280 large rectangle may be
ad sizes in the Ad Exchange comprise approximately 95% of all impressions the result of lower publisher supply for this format. However, advertiser
served, and they are identical to the top three ad sizes seen on DFP. demand is also correspondingly lower.
Figure 3b
Ad Size CPM Comparisons on the Ad Exchange
180
160
159
140
120
109
100
97
92
80
68
60
53
40
41
27
20
14
8
0
300 x 250 728 x 90 160 x 600 468 x 60 120 x 600 336 x 280 200 x 200 234 x 60 120 x 240 125 x 125
26 27
16. Mobile
Web Ad
Impressions
With consumer mobile usage growing rapidly, publishers are
rethinking their content monetization strategy. Advertisers look
to reach audiences across screens and formats, and publishers
are responding to this demand with ever-more sophisticated
4.
channels for monetizing mobile content. Mobile has become
essential to the overall ad inventory mix, but some publisher
verticals on the mobile web are growing faster than others.
29
17. Is mobile growing
across the board?
There has never been a better time for publishers to engage mobile users,
whether through a mobile-optimized site or a full-featured app. Growth in
mobile usage has exploded with impressions on the Ad Exchange and
AdSense platforms increasing by 250% over Q3 and Q4 2011. This growth is
not just happening in highly mobilized cities like Seoul and San Francisco, but
also in emerging markets where users are first interacting with the internet
not on a desktop but on a mobile phone. Both mobile and desktop ad
impressions exhibit strong growth, but due to increased mobile web usage,
mobile ads are growing at a faster rate and have increased as a proportion
of overall ad impressions.
We took a look at mobile web impressions over the last quarter of 2011 to get
a sense of average vertical impression growth. Globally, all publisher verticals,
with the exception of Travel, experienced double-digit growth in mobile web
ad impressions in the fourth quarter of 2011. As might be expected from
seasonal consumer mobile usage, the strongest vertical market in mobile
usage was Shopping, with 69% growth, followed by Food & Drink at 61%.
30 31
18. Figure 4a
Global mobile web ad impression growth by vertical on the Ad Exchange and AdSense
69%
61%
47% 45% 45% 43% 41% 40% 40%
Shopping Food & Drink People & Reference Books & Online Law & Internet & Computers &
Society Literature Communities Government Telecom Electronics
39%
36% 35%
32% 31% 30% 29% 28% 28%
25% 23% 22% 20% 19% 18%
9%
Games Arts & Science Health Pets & Jobs & Hobbies & Business & Home & news Finance Real Estate Beauty & Sports Autos & Travel
Entertainment Animals Education Leisure Industrial Garden Fitness Vehicles
32 33
19. Video Ads
Videos tell stories—from publishers as well as advertisers.
Video is becoming a lucrative part of a publisher’s ad inventory,
partly because it offers creative opportunities that attract
brand advertisers, and partly due to tremendous viewer
5.
demand. We’re excited about the growth in video advertising,
and we have more comprehensive metrics in store—so stay
tuned for more to come.
35
20. Figure 5a
Video ad length
How do video ads
impact viewers?
Video content monetization is now one of the fastest-growing segments in
advertising. Publisher video impressions grew nearly 70% in the second half of
2011 across the DFP Video platform. As measured across in-stream video
impressions in DFP, the average midpoint and completion rates of a video
ad come in at 79% and 72%, respectively. About 51% of video ads run between
15 and 30 seconds in length, with 36% running more than 30 seconds, and
15 to 30 seconds over 30 seconds less than 15 seconds
only 13% running less than 15 seconds. We’re also seeing a 175% increase in
impressions on the 640 x 360 ad unit that fits wide-screen players. Conversely,
51% 36% 13%
we’ve observed a decrease in standard aspect-ratio video player impressions,
indicating that they’re phasing out.
Figure 5B
In-stream video ad completion rates
Midpoint
79%
Completion
72%
36 37
21. Appendix
Important notes about the data in this report
• The data sets used to obtain the metrics presented in this report are
sourced from DoubleClick for Publishers (DFP) ad serving platform, the
DoubleClick Ad Exchange, and Google AdSense.
• The data sets contain tens of billions of impressions served by publishers
globally for the year 2011.
• Although revenue and absolute CPM benchmarks would be useful to
publishers, to preserve client confidentiality, that information is unavailable.
• A publisher’s vertical is determined by the site’s primary content subject.
• A publisher’s geography is determined by their billing country.
6. 39
22. Google’s Publisher Display Products
DoubleClick for Publishers (DFP) is a comprehensive DoubleClick Ad Exchange enables publishers to
ad serving solution that helps publishers streamline make the most of every display impression, across
their ad management to increase efficiency every channel. It is the only ad exchange that offers
and minimize costs. Featuring efficient trafficking real-time access to every major demand source,
workflows, robust inventory management and including the Google Display Network. In addition,
forecasting, revenue optimization, and granular the Ad Exchange connects seamlessly with the DFP
reporting, DFP equips publishers with a complete ad serving platform, making it easy for publishers to
tool kit for ad delivery and revenue optimization achieve the maximum value from every impression.
across all digital ad inventory. DFP can be seamlessly For more information, visit google.com/doubleclick
customized with platform modules to meet a
publisher’s current and future advertising needs.
For more information, visit google.com/dfp
Google AdSense is a free program that helps online Admeld, acquired by Google in December 2011, is
publishers earn revenue by displaying relevant text the most recent addition to DoubleClick’s publisher
and display ads on a wide variety of online content, offerings. Admeld helps the world’s top online
including websites, site search results, mobile sites, publishers sell their ad inventory smarter, capture
video content and games. The Google AdSense new revenue streams, and simplify their operations.
program includes more than 2 million publishers Admeld’s unique approach is marked by high-touch
globally and supports 33 different languages. For services and its track record of innovation in Private
more information, visit google.com/adsense Exchanges, Traditional Yield Management, and
Mobile Yield Management. For more information,
visit admeld.com
40