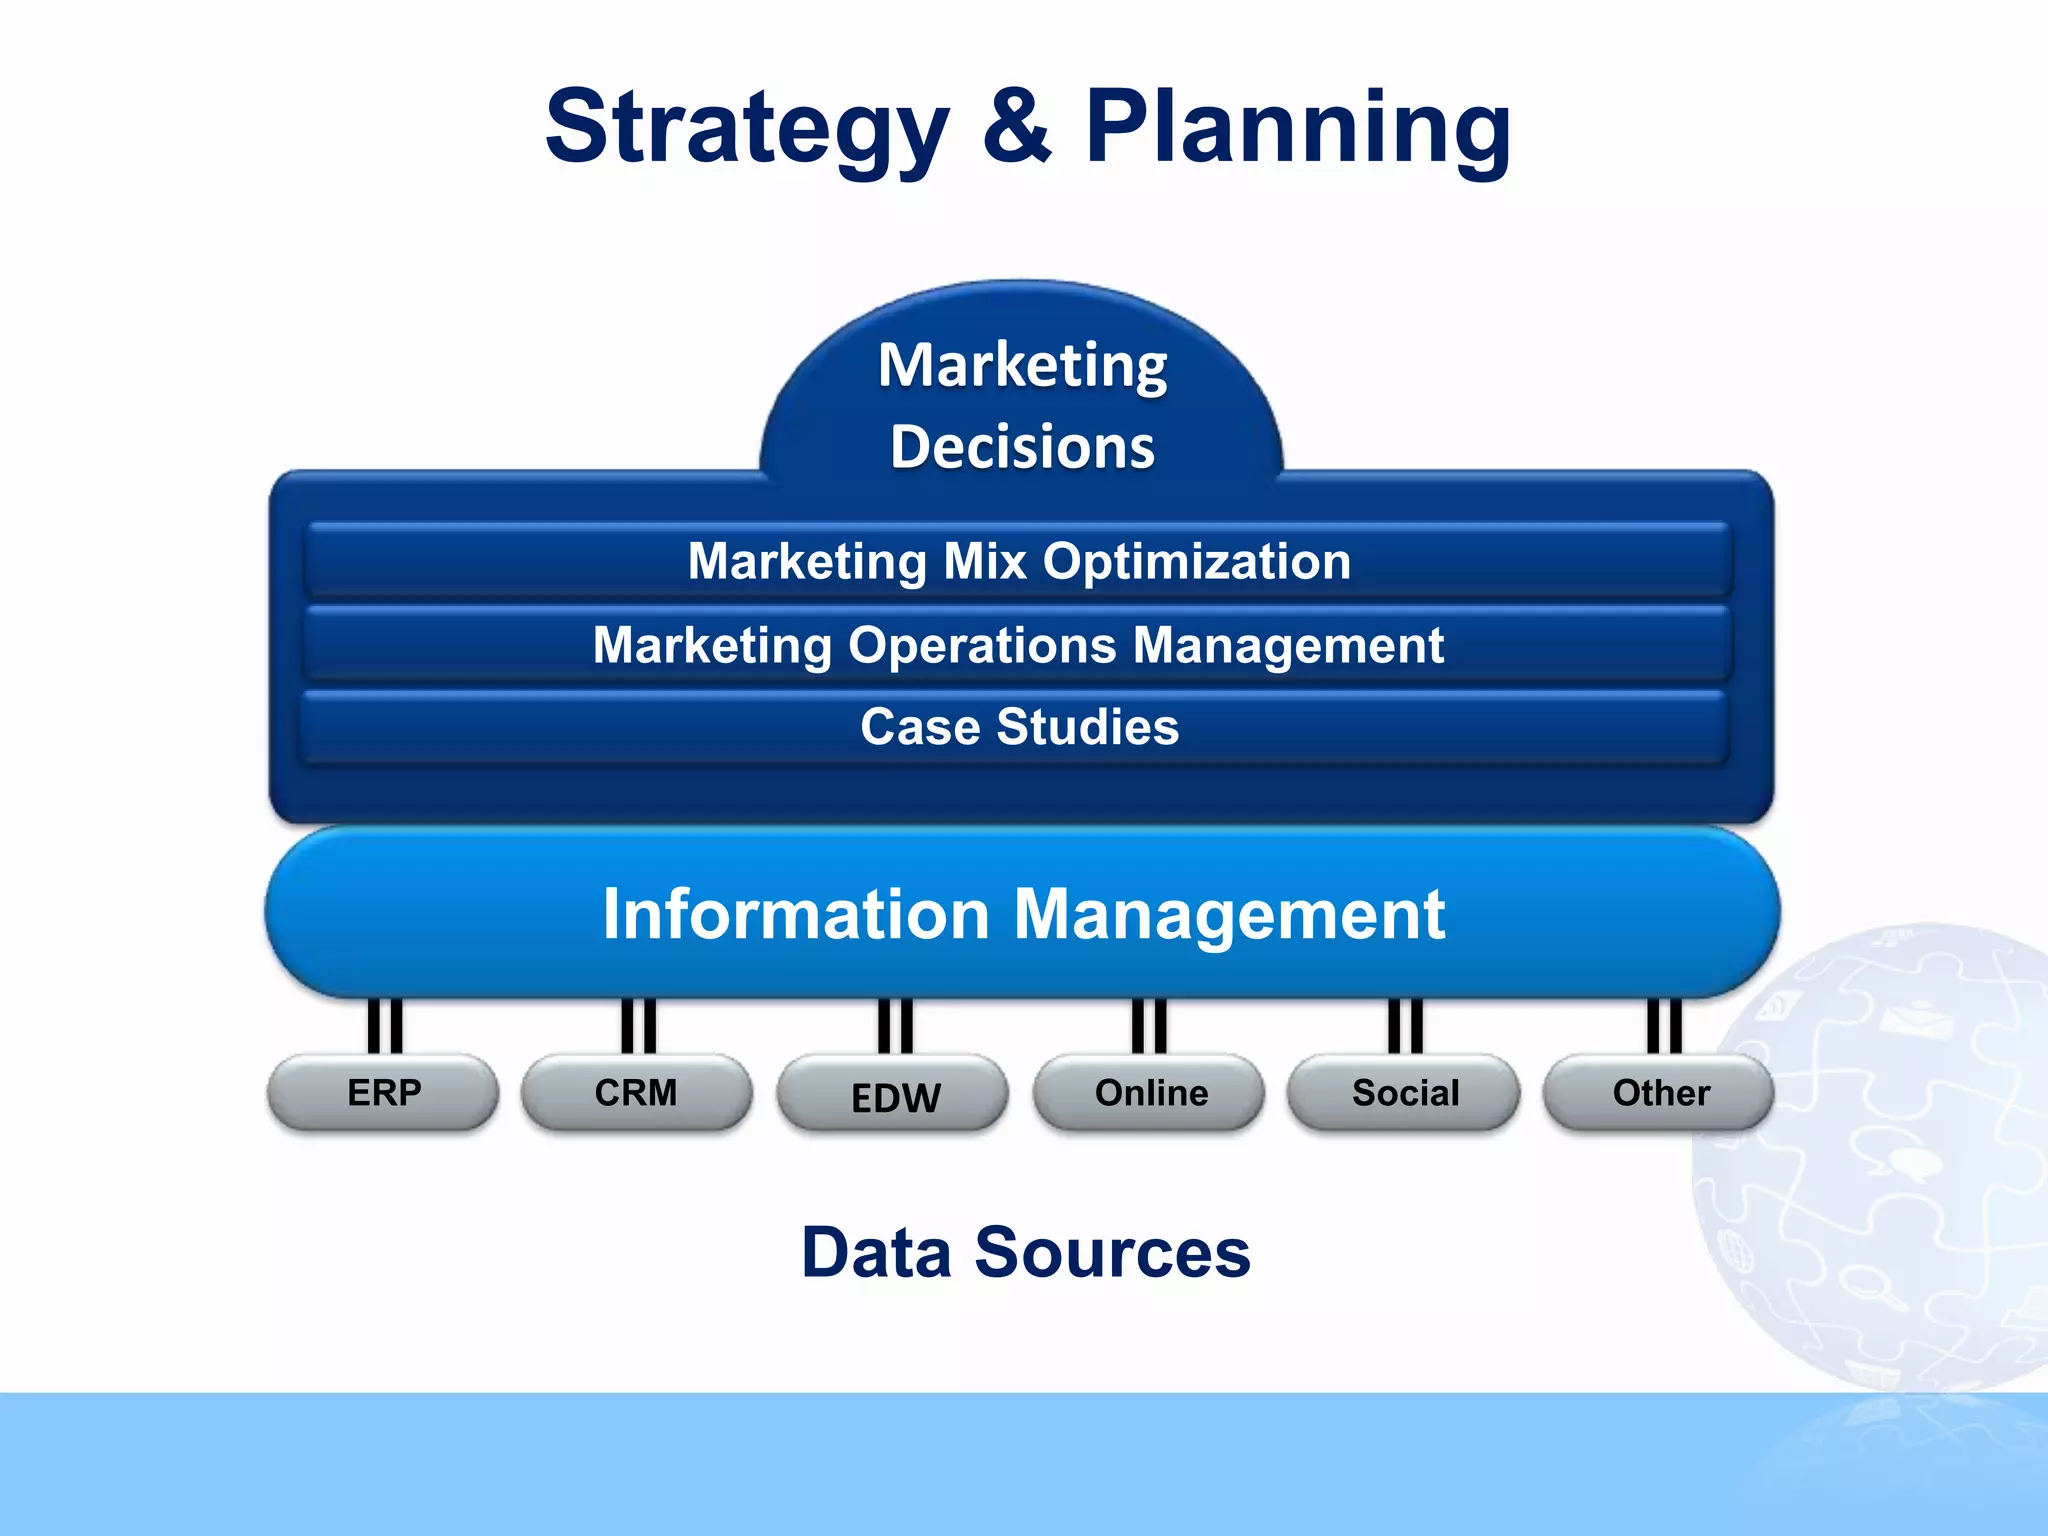
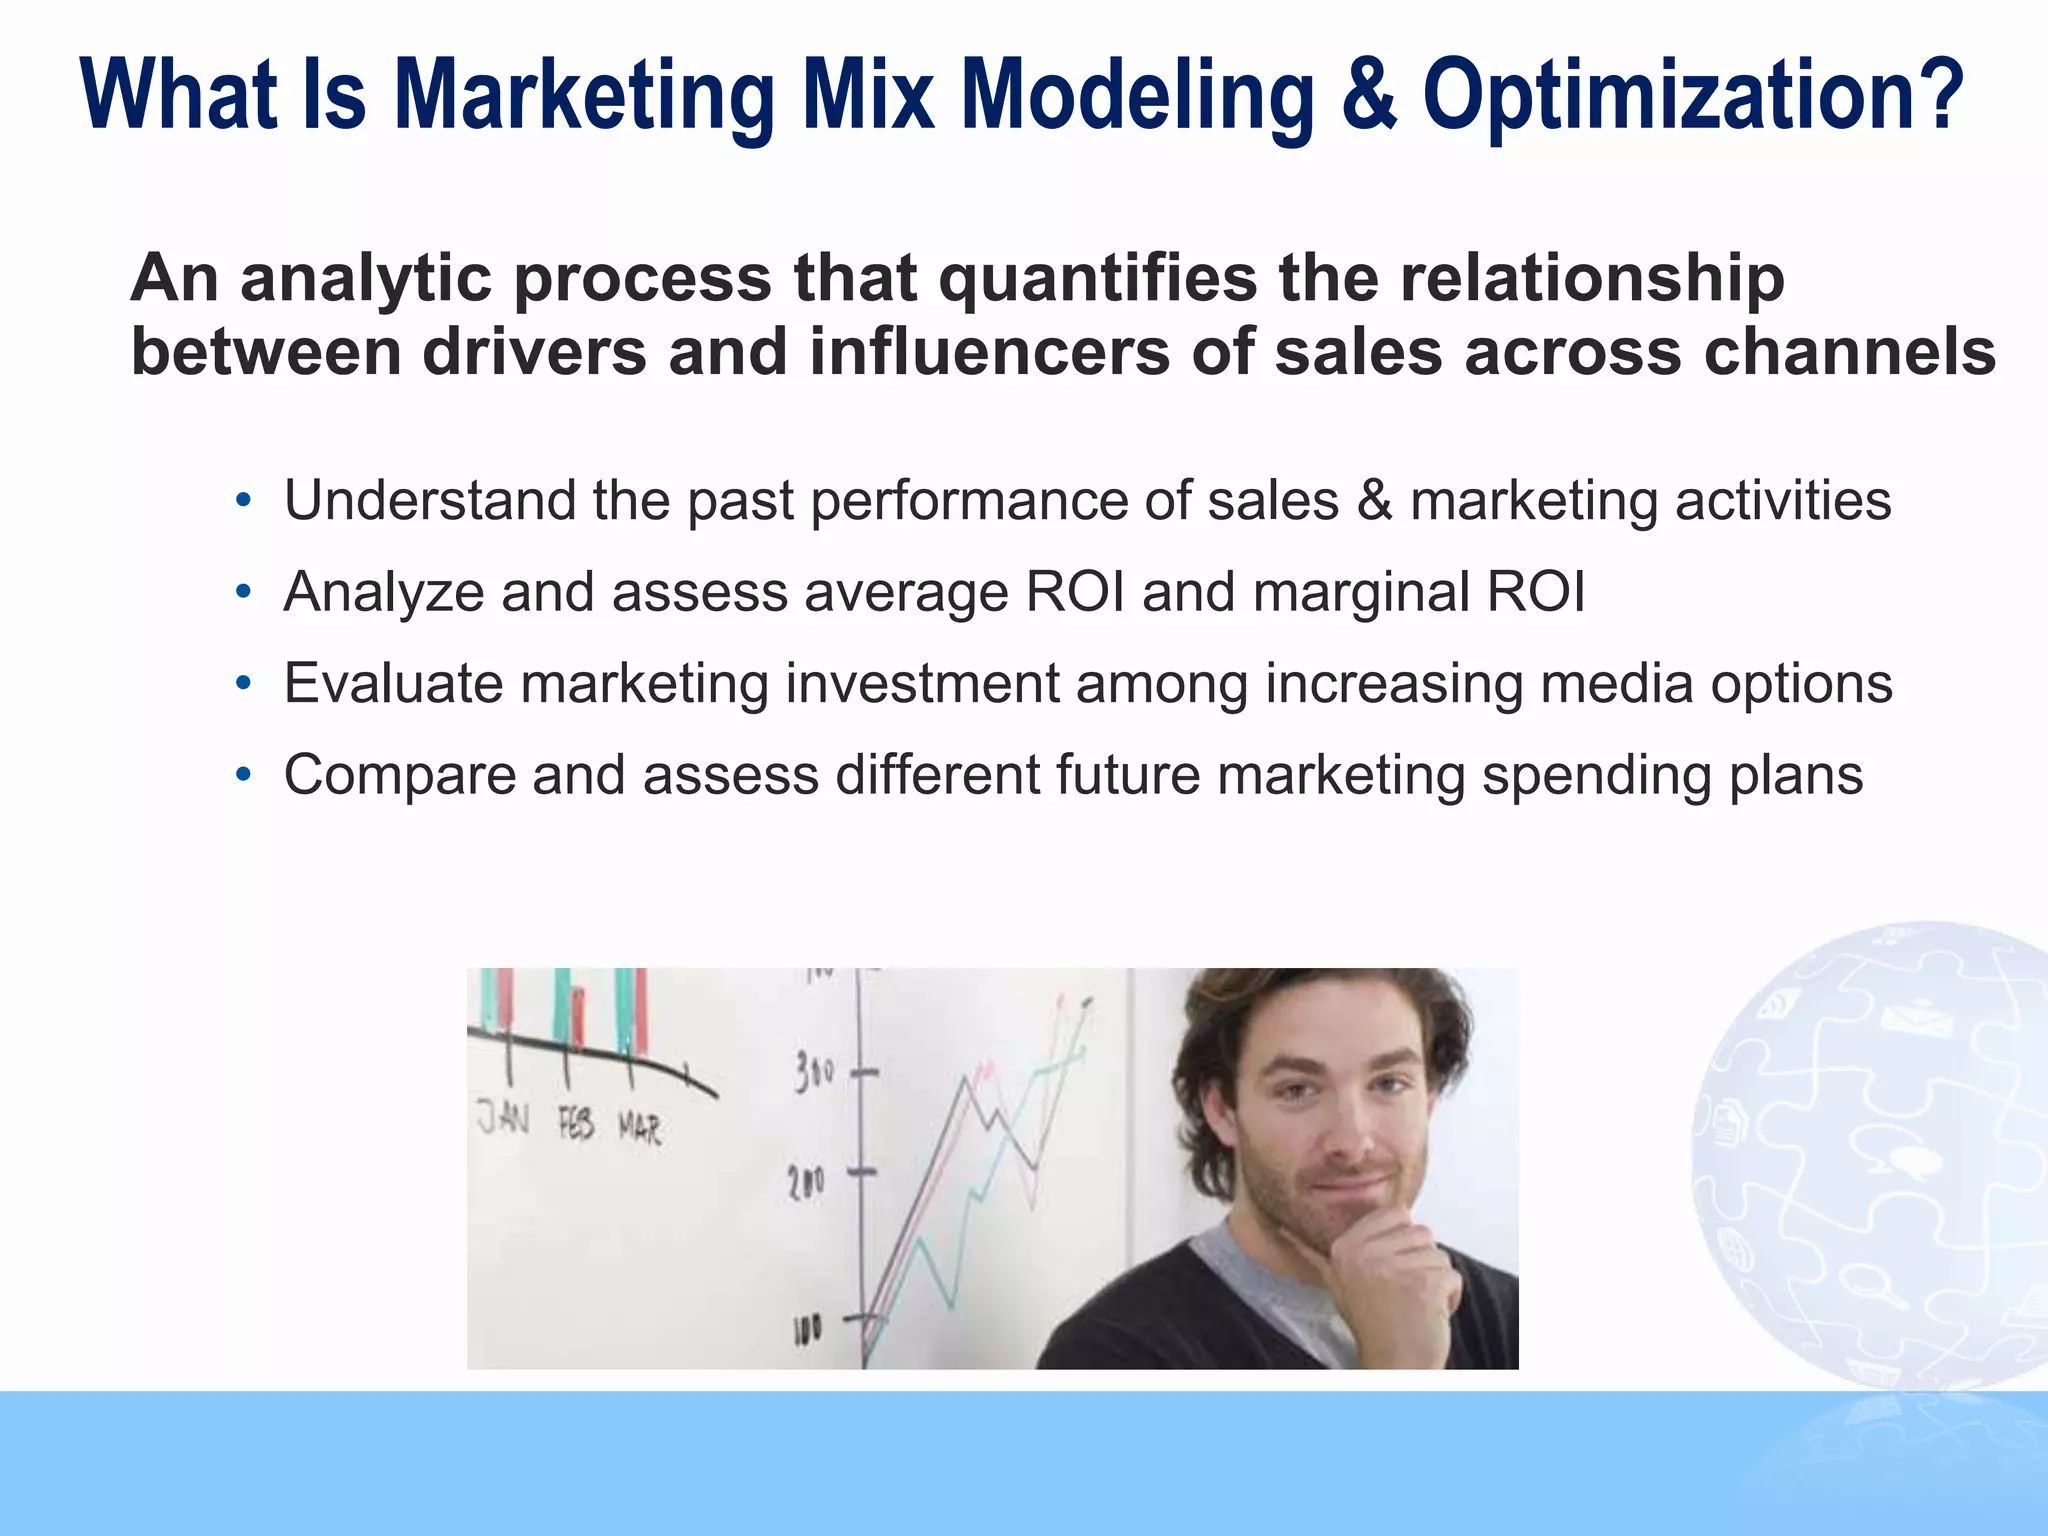
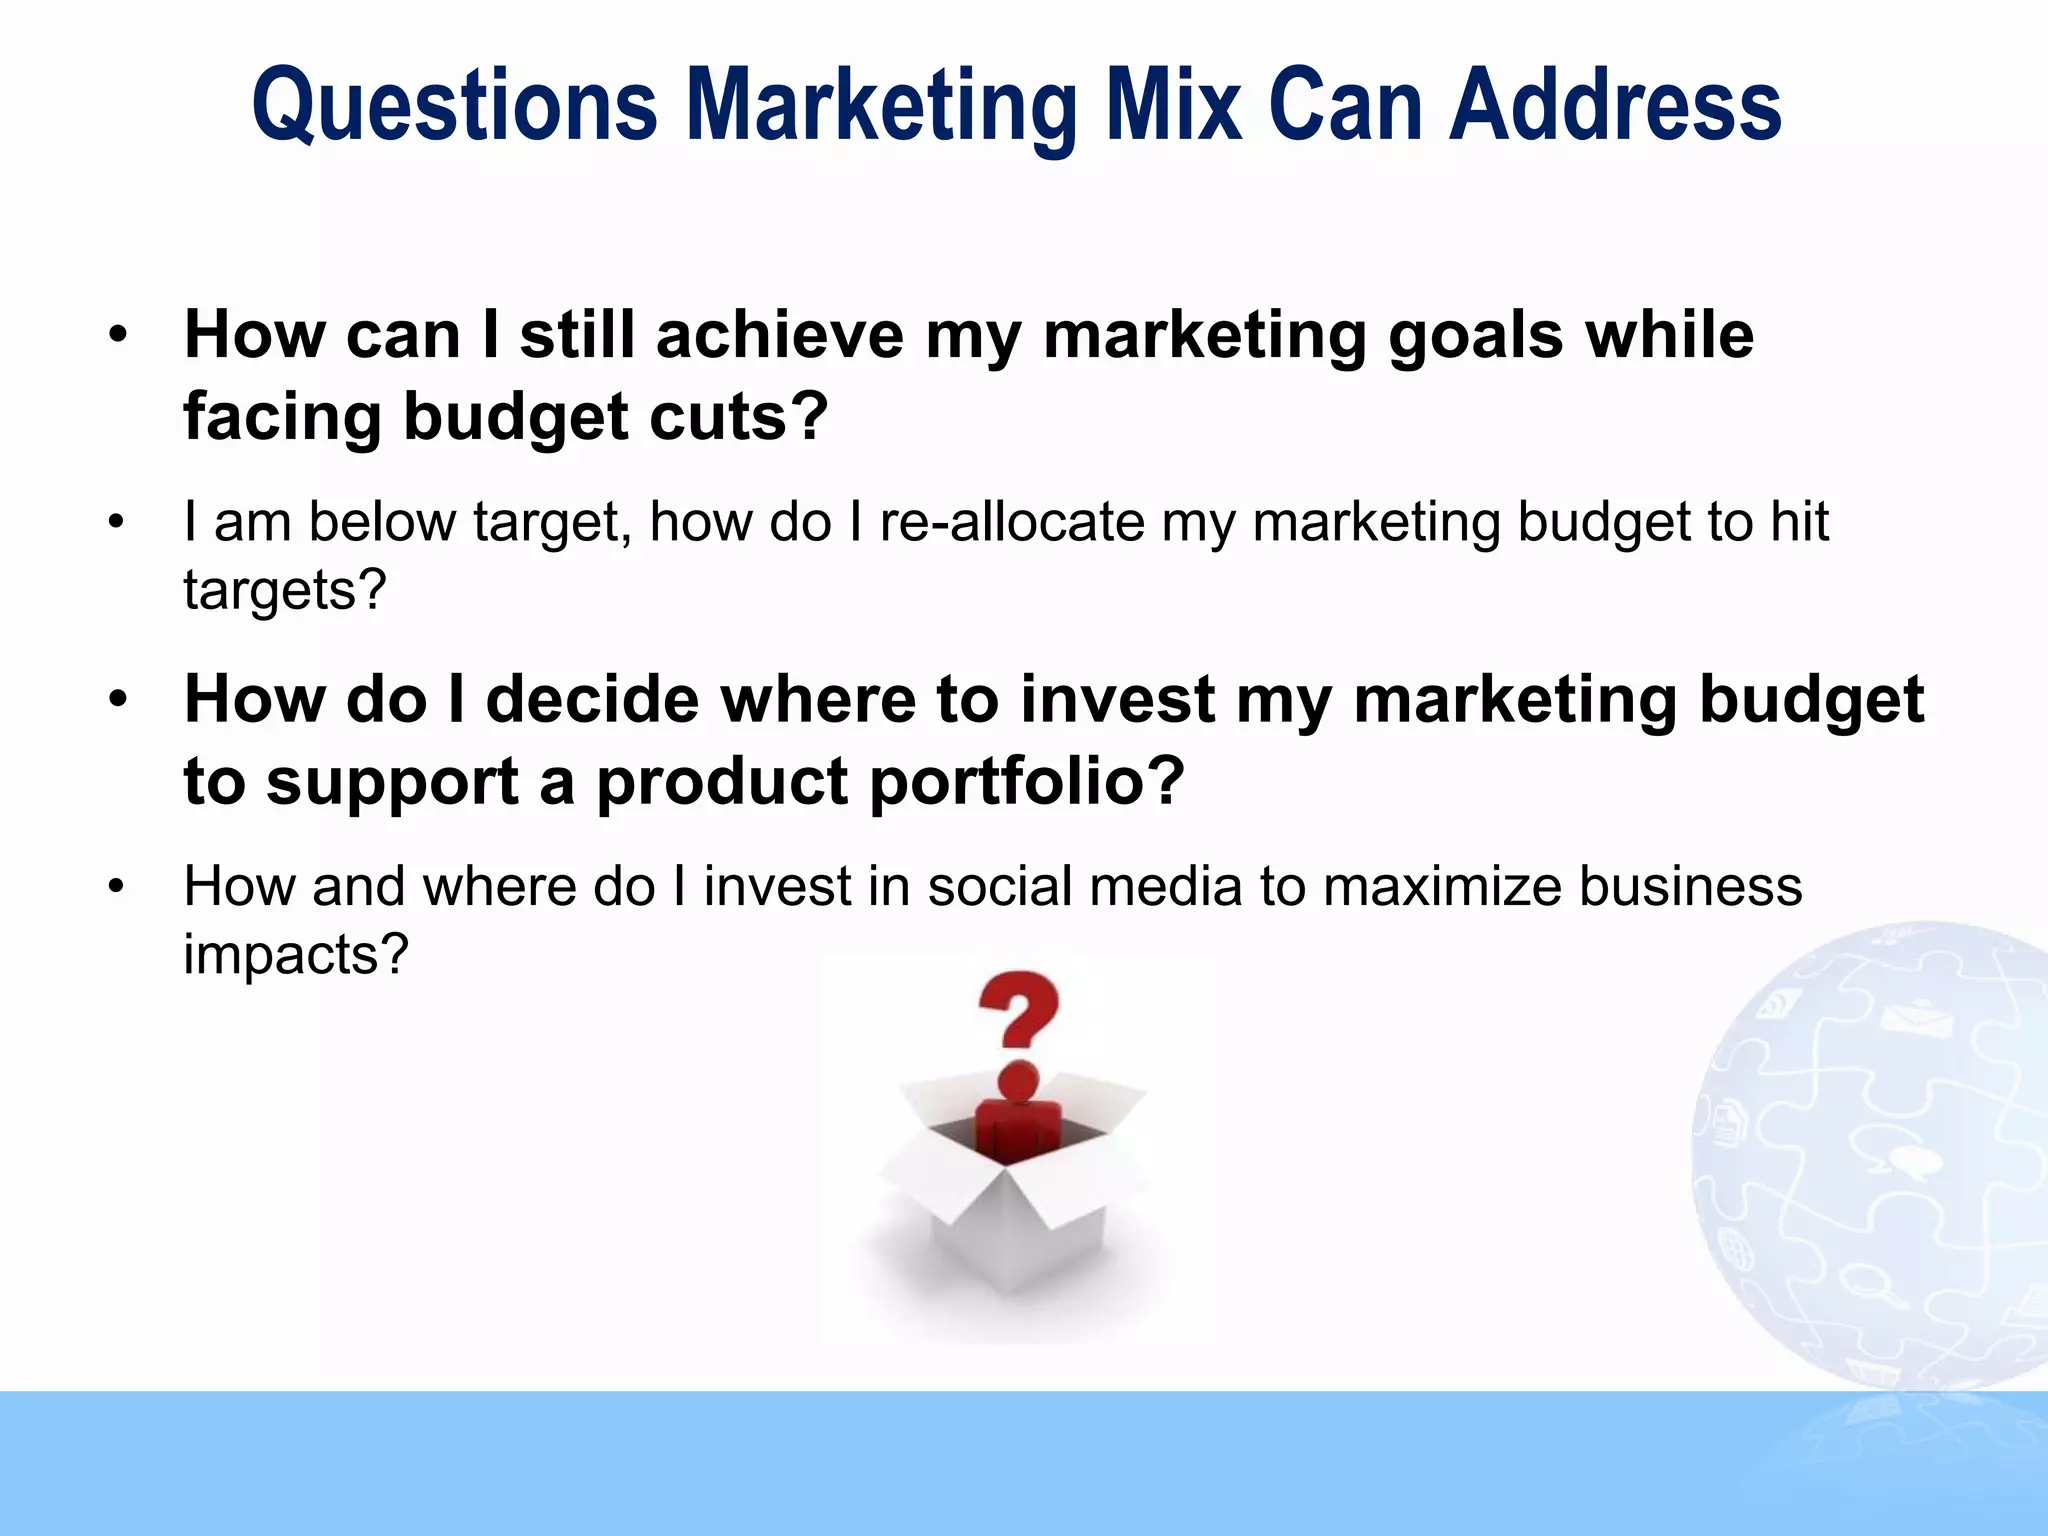
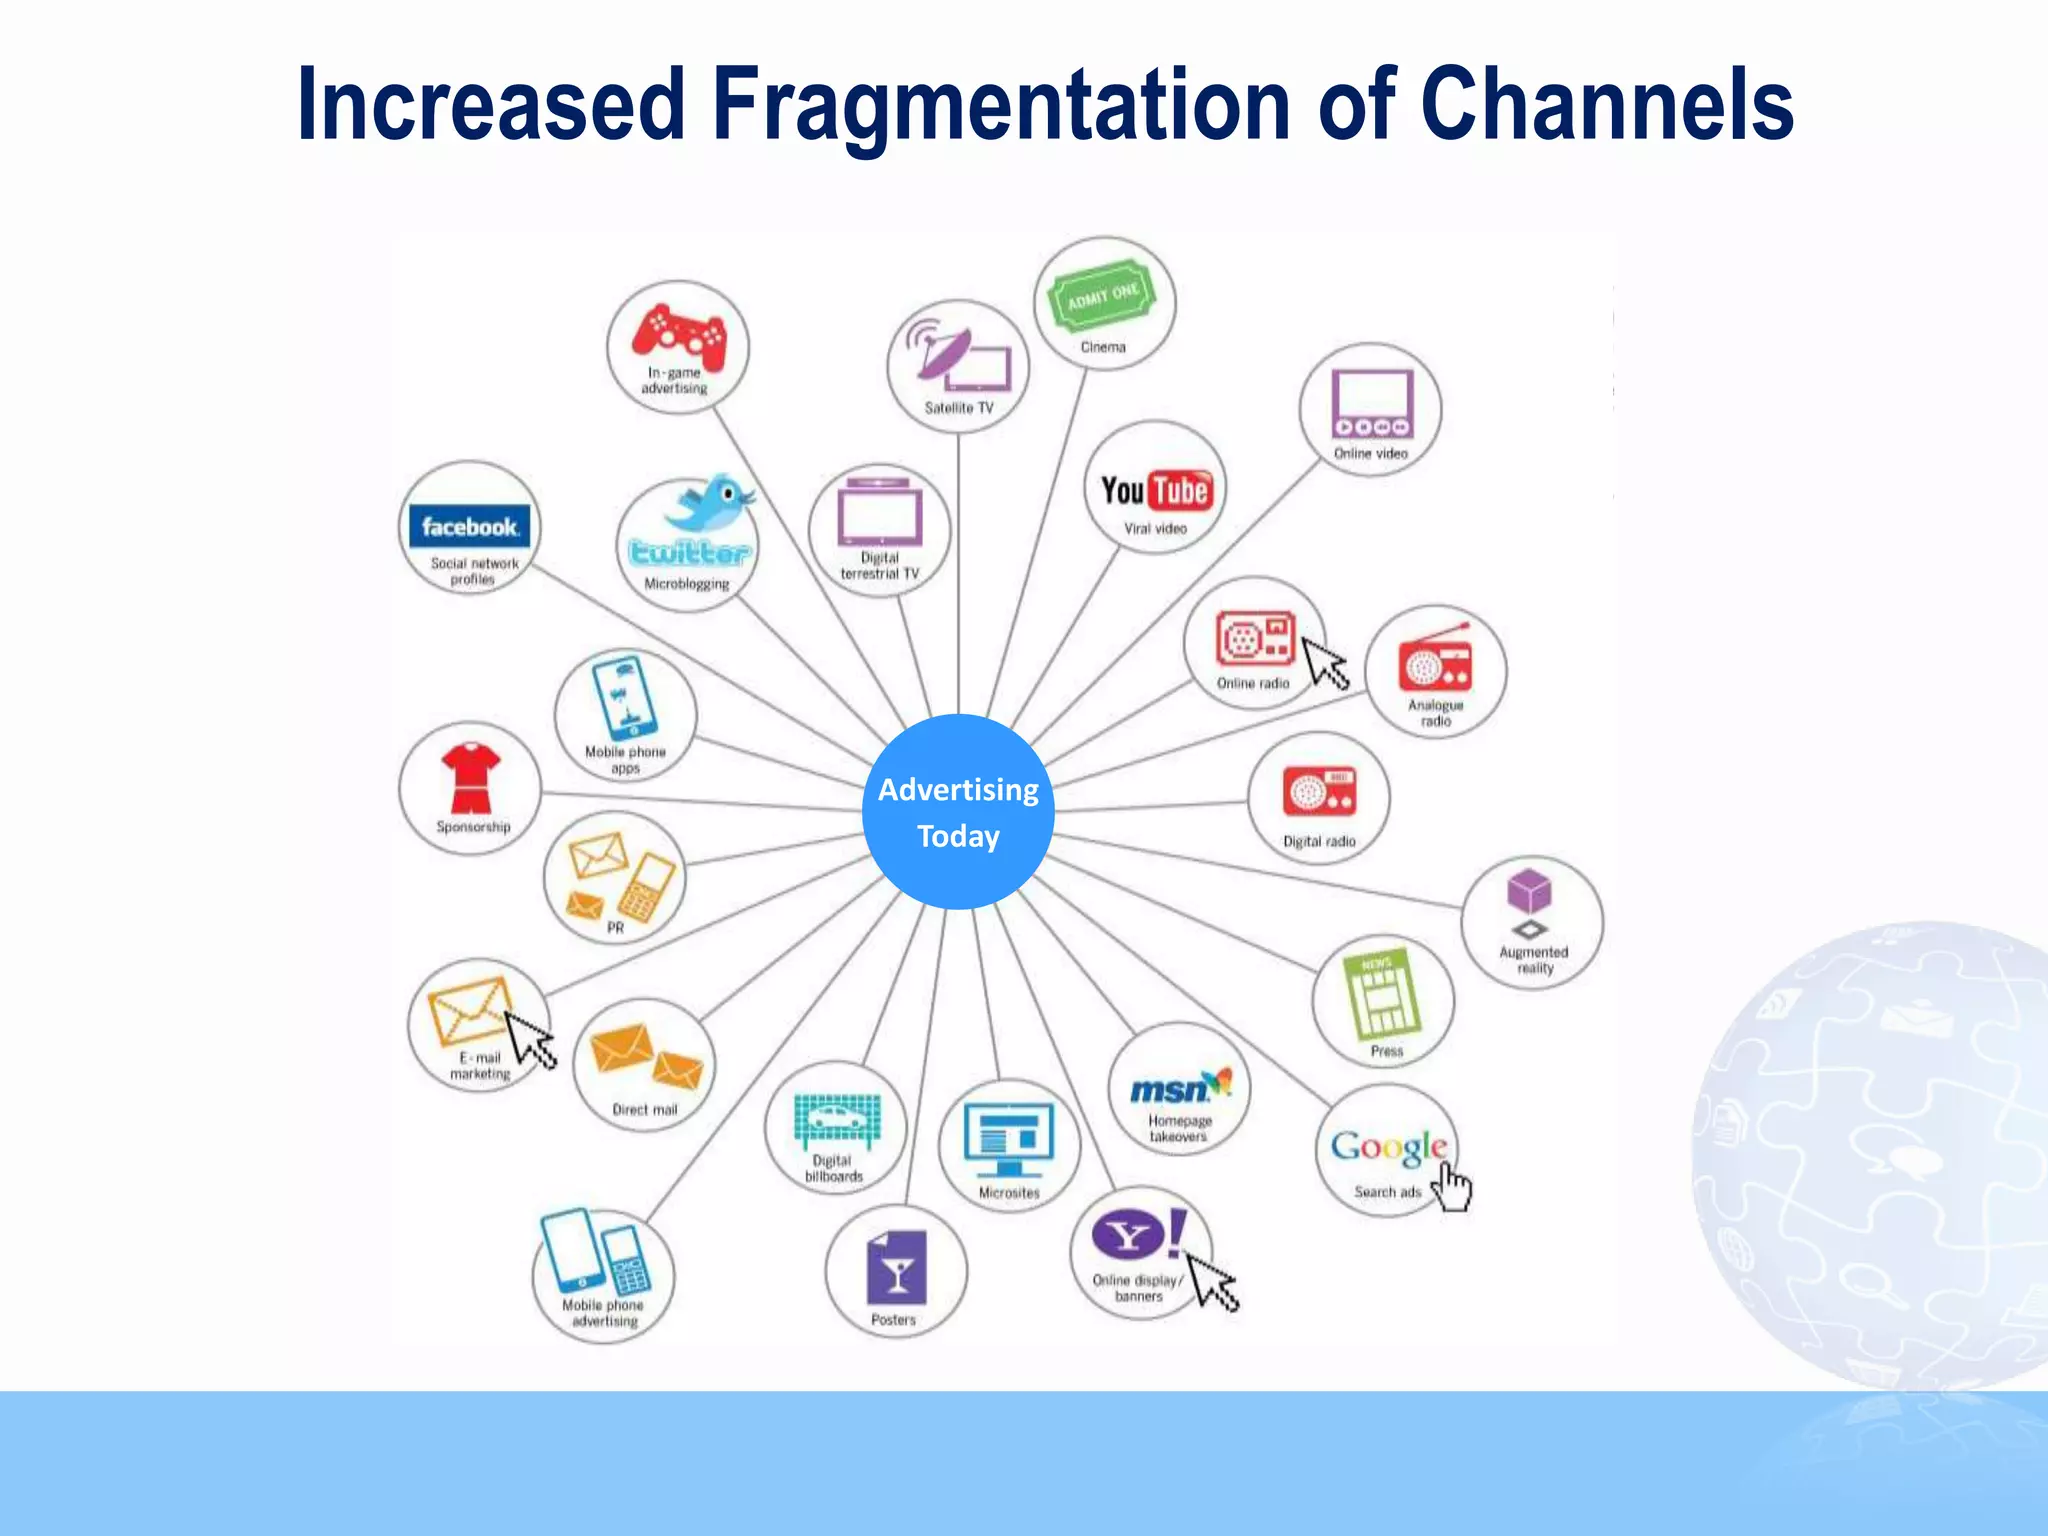
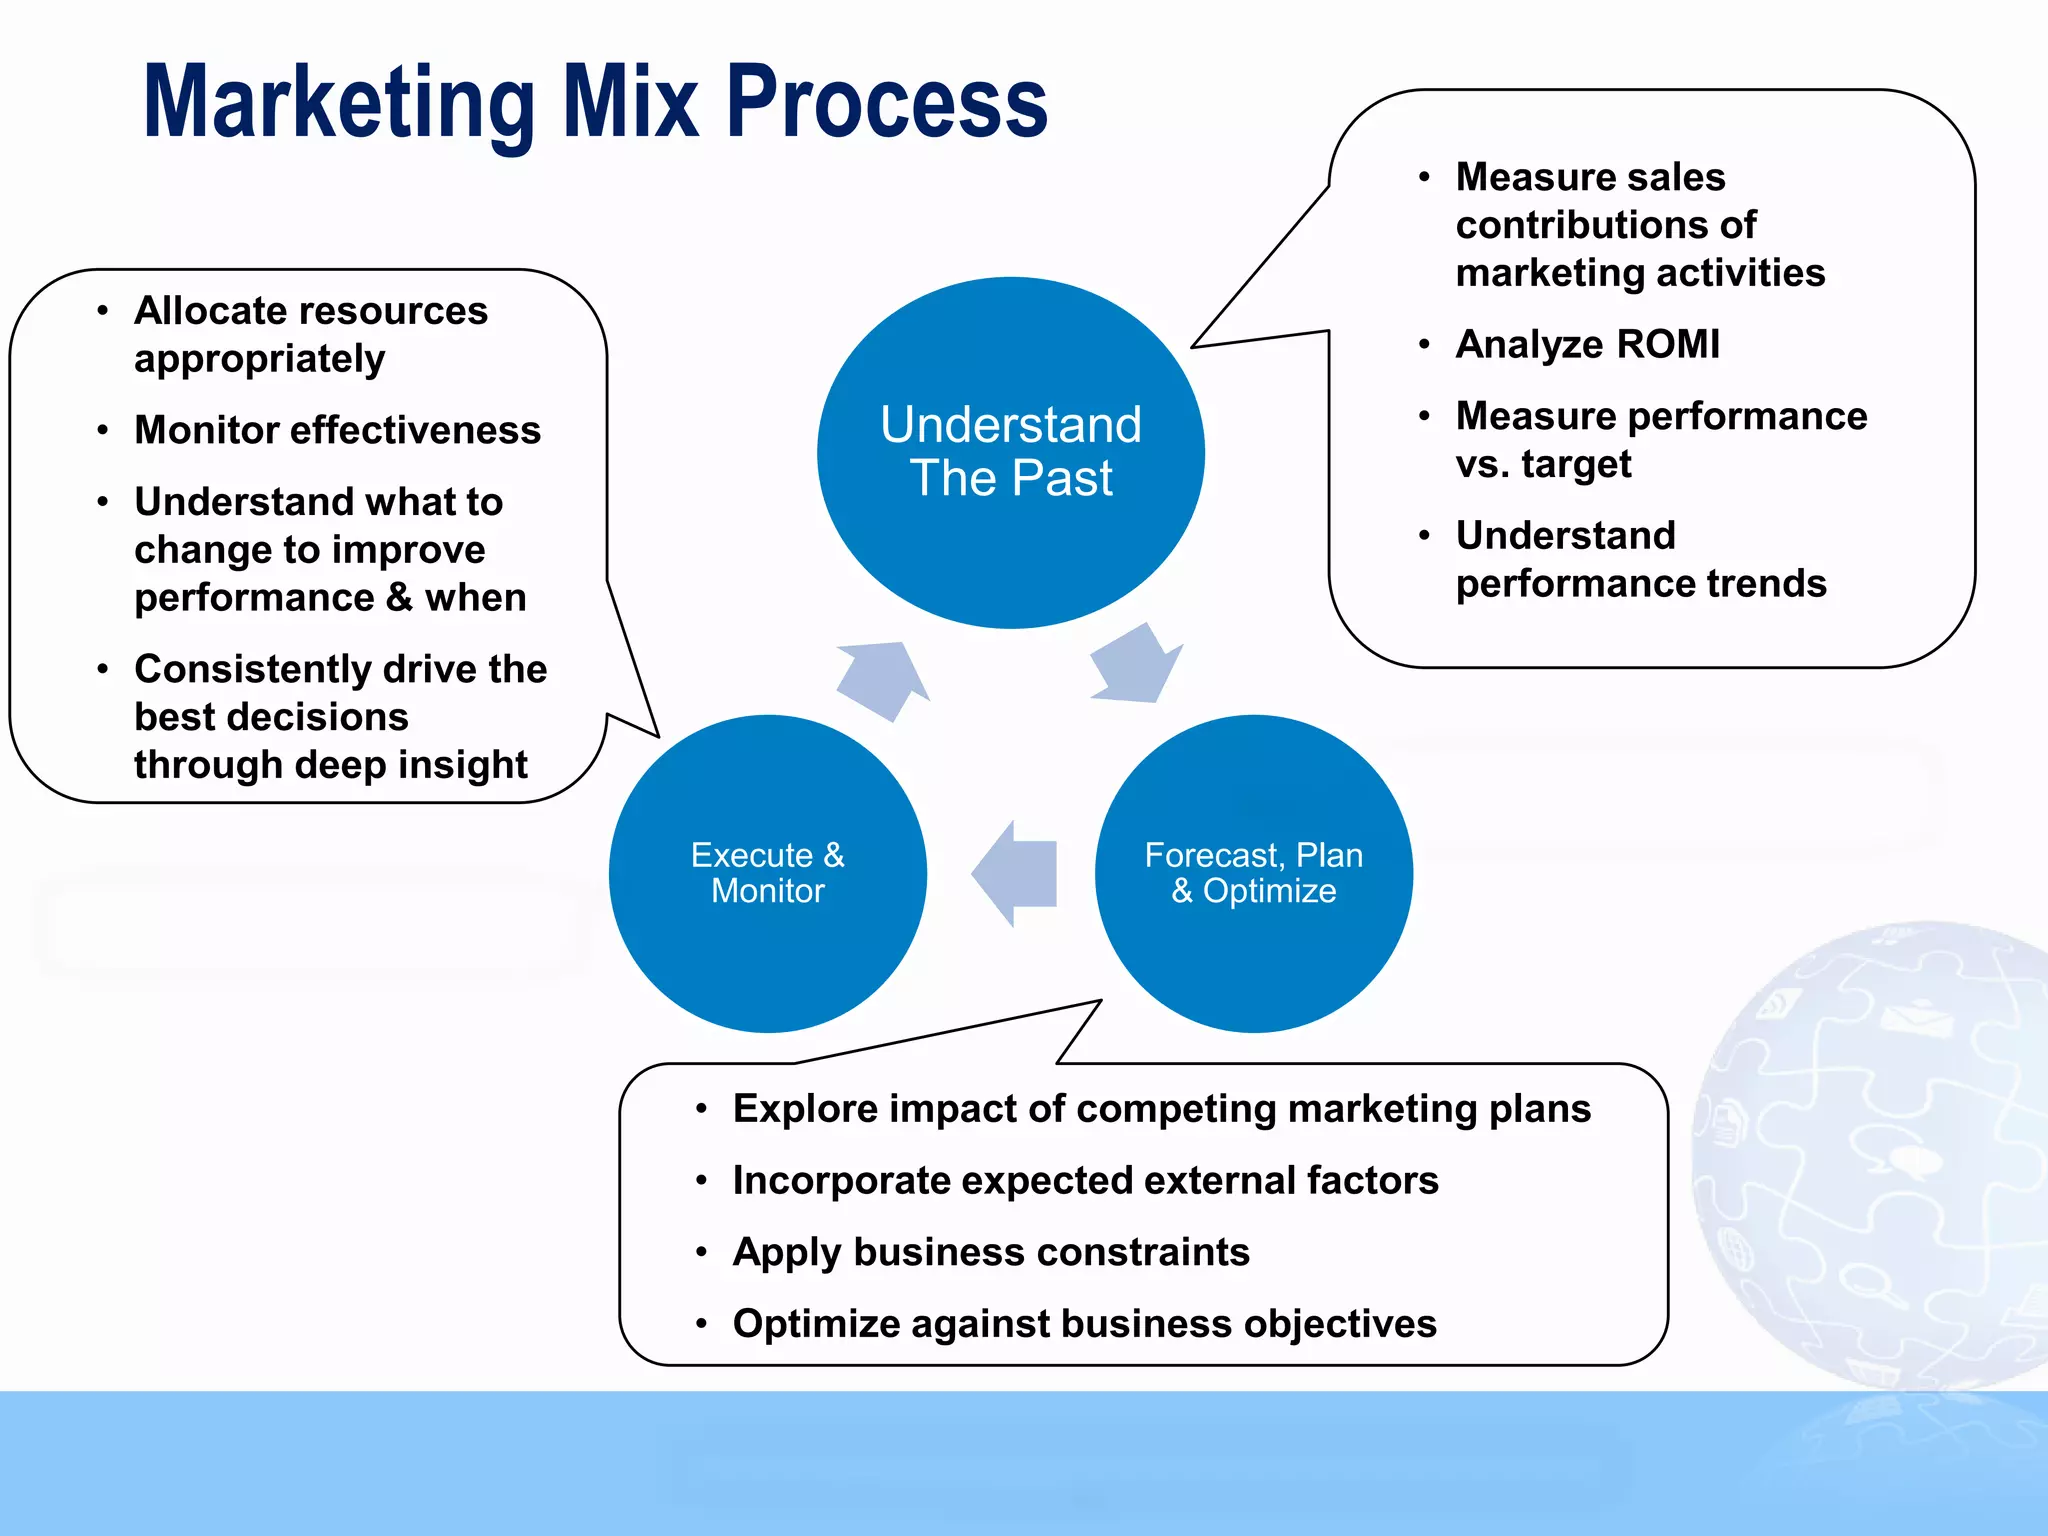
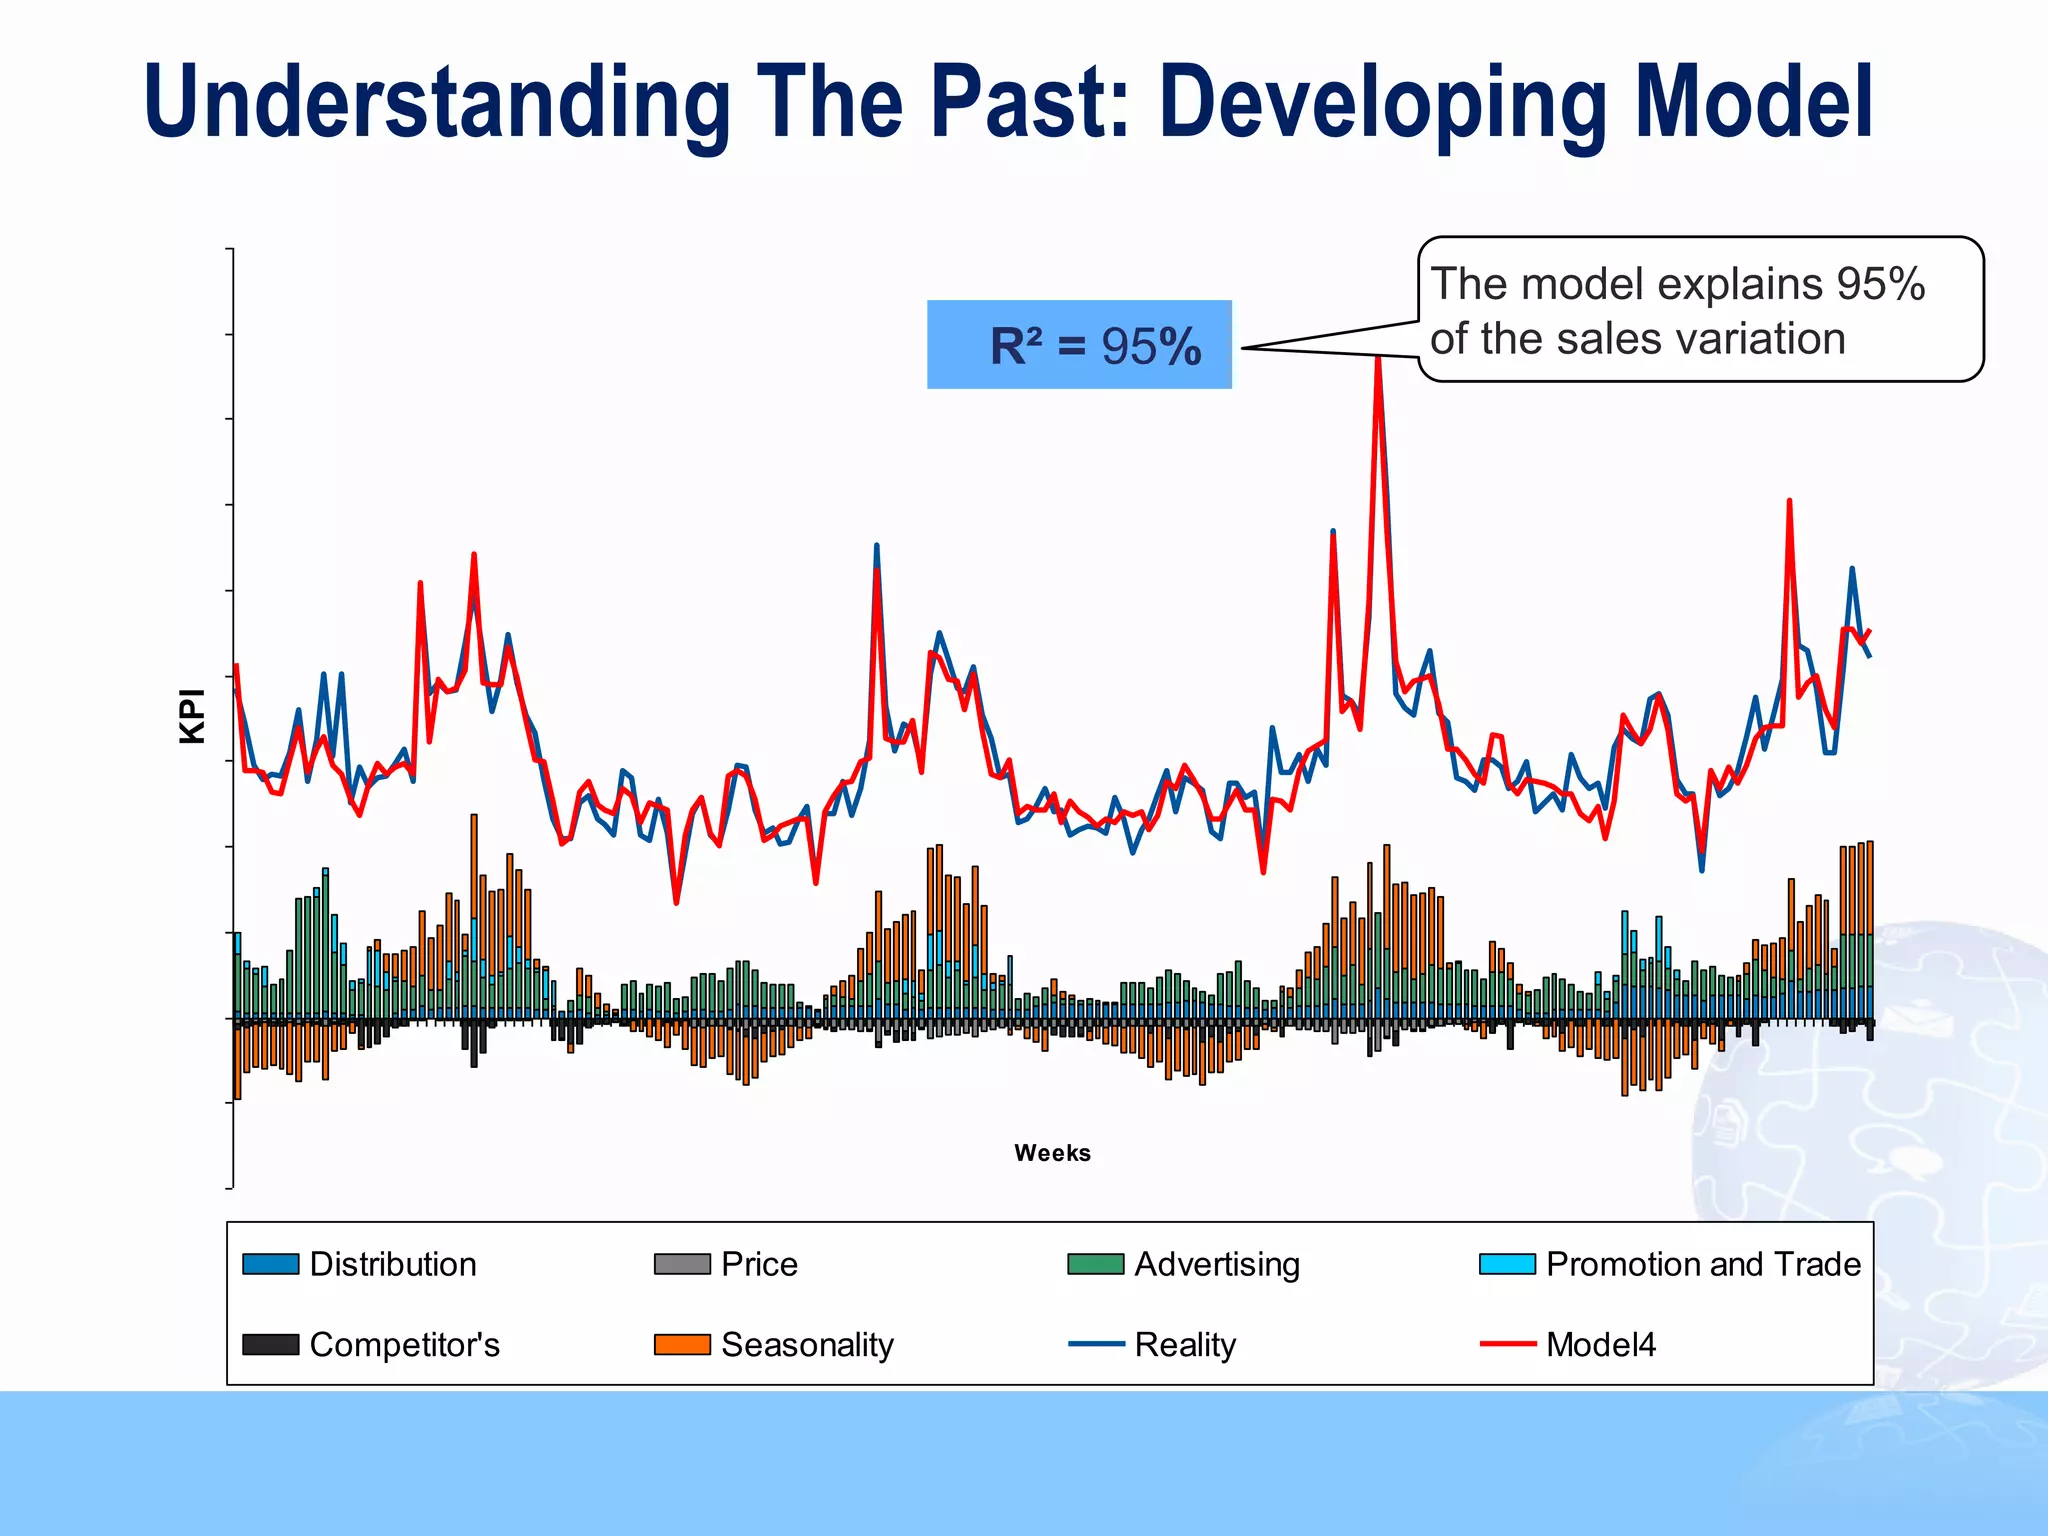
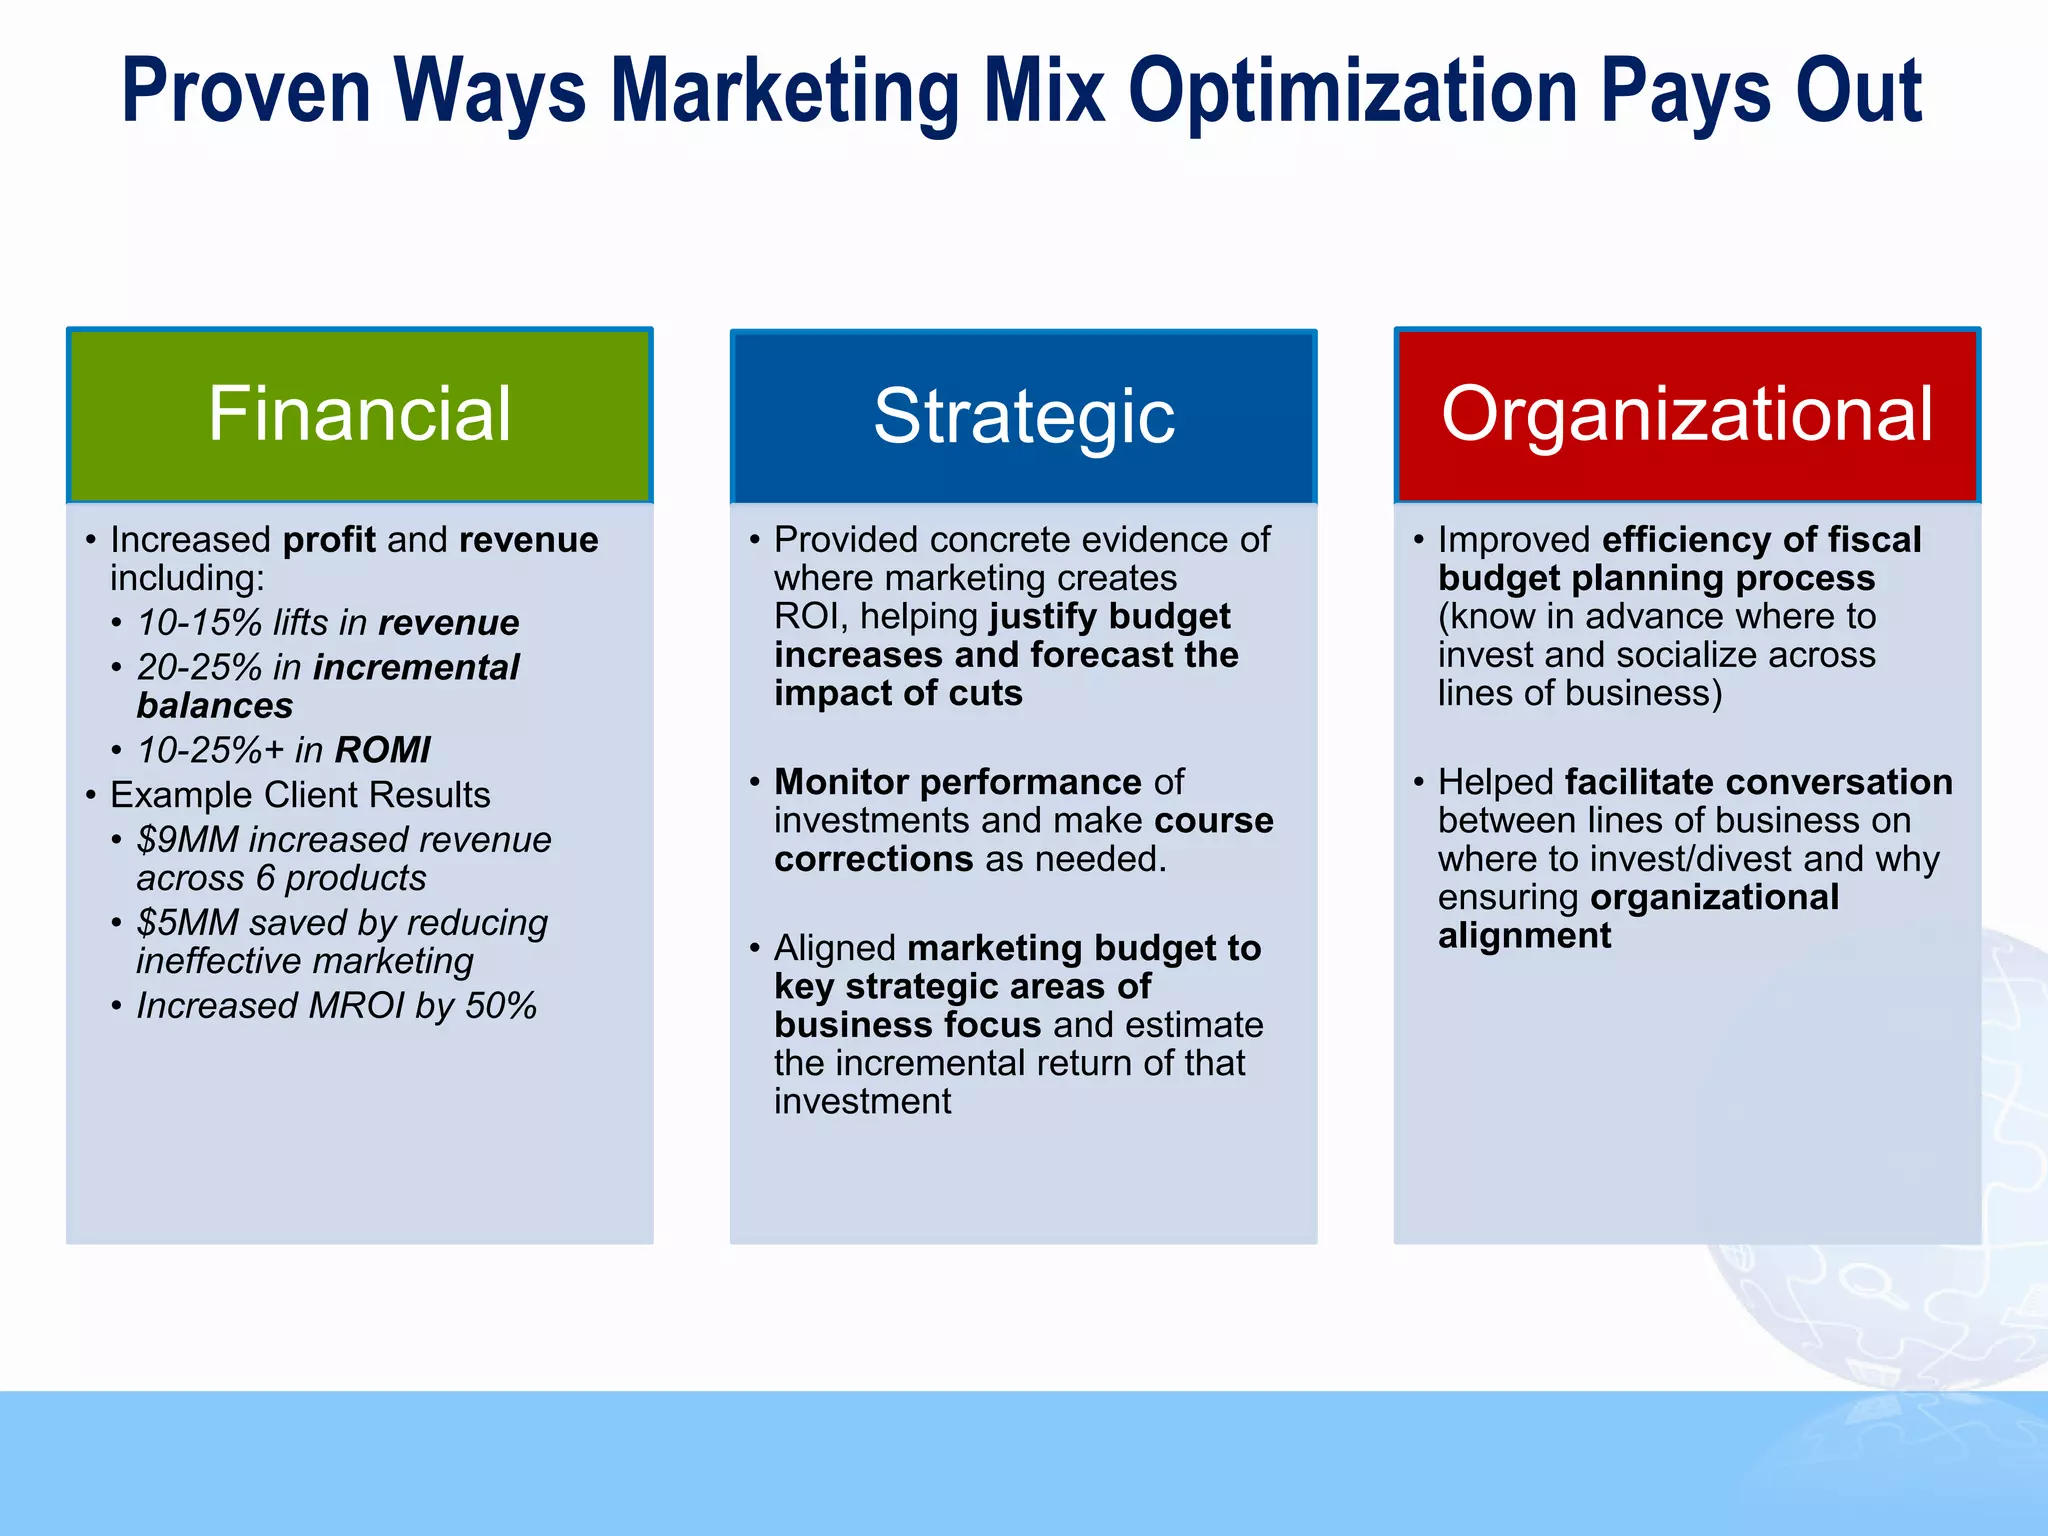
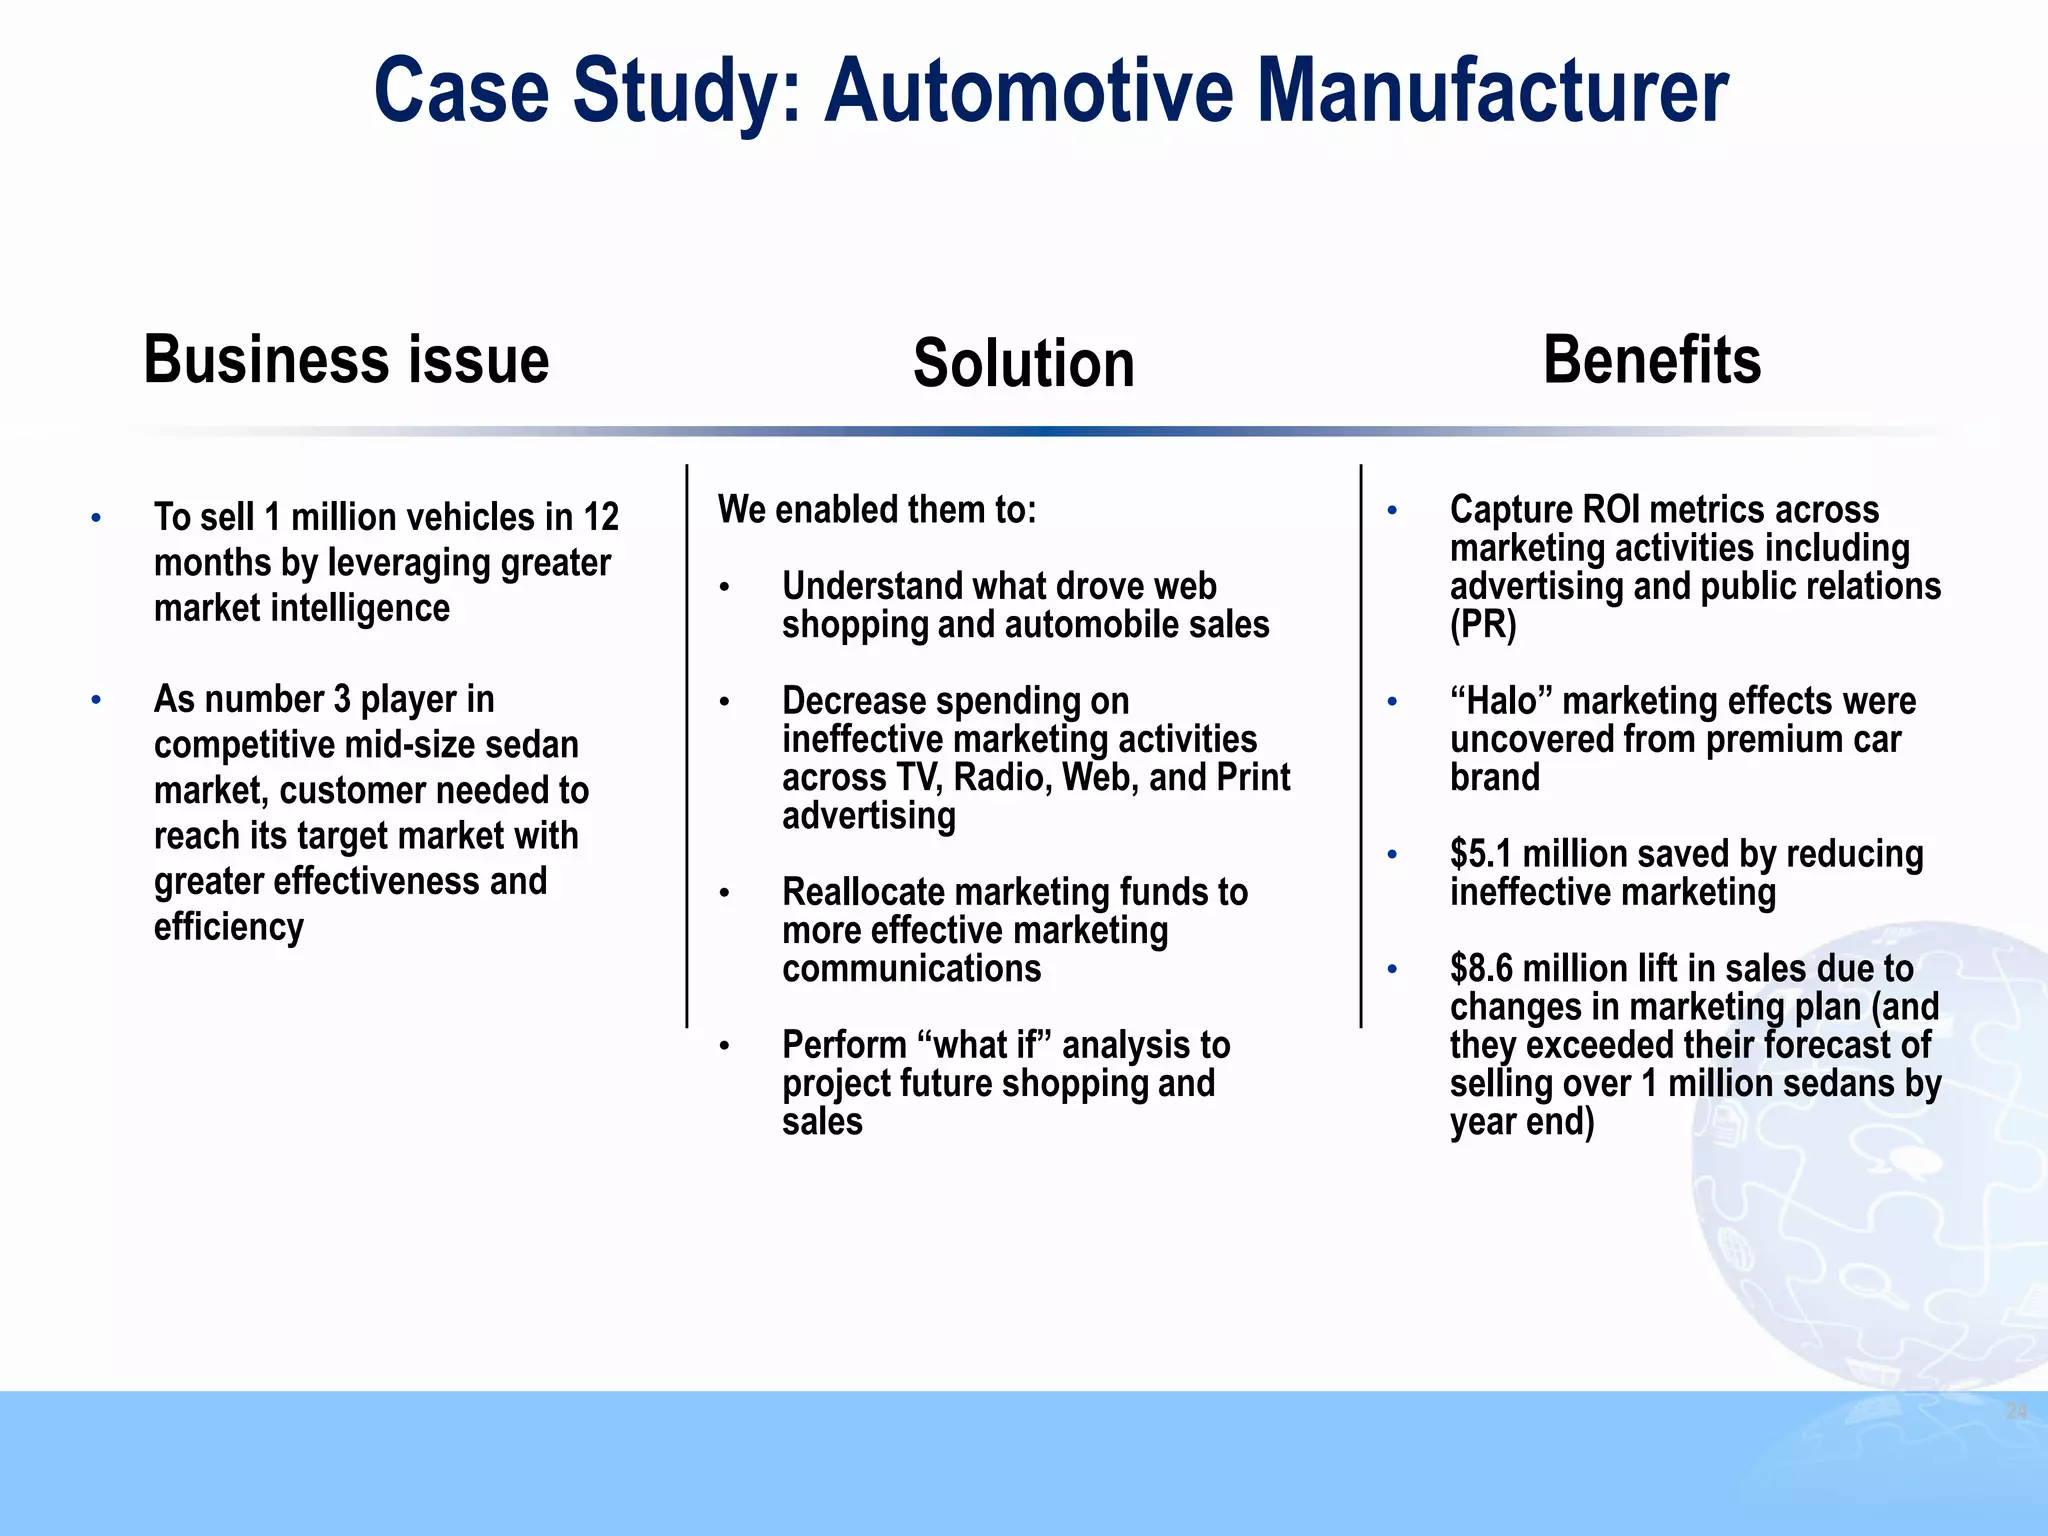
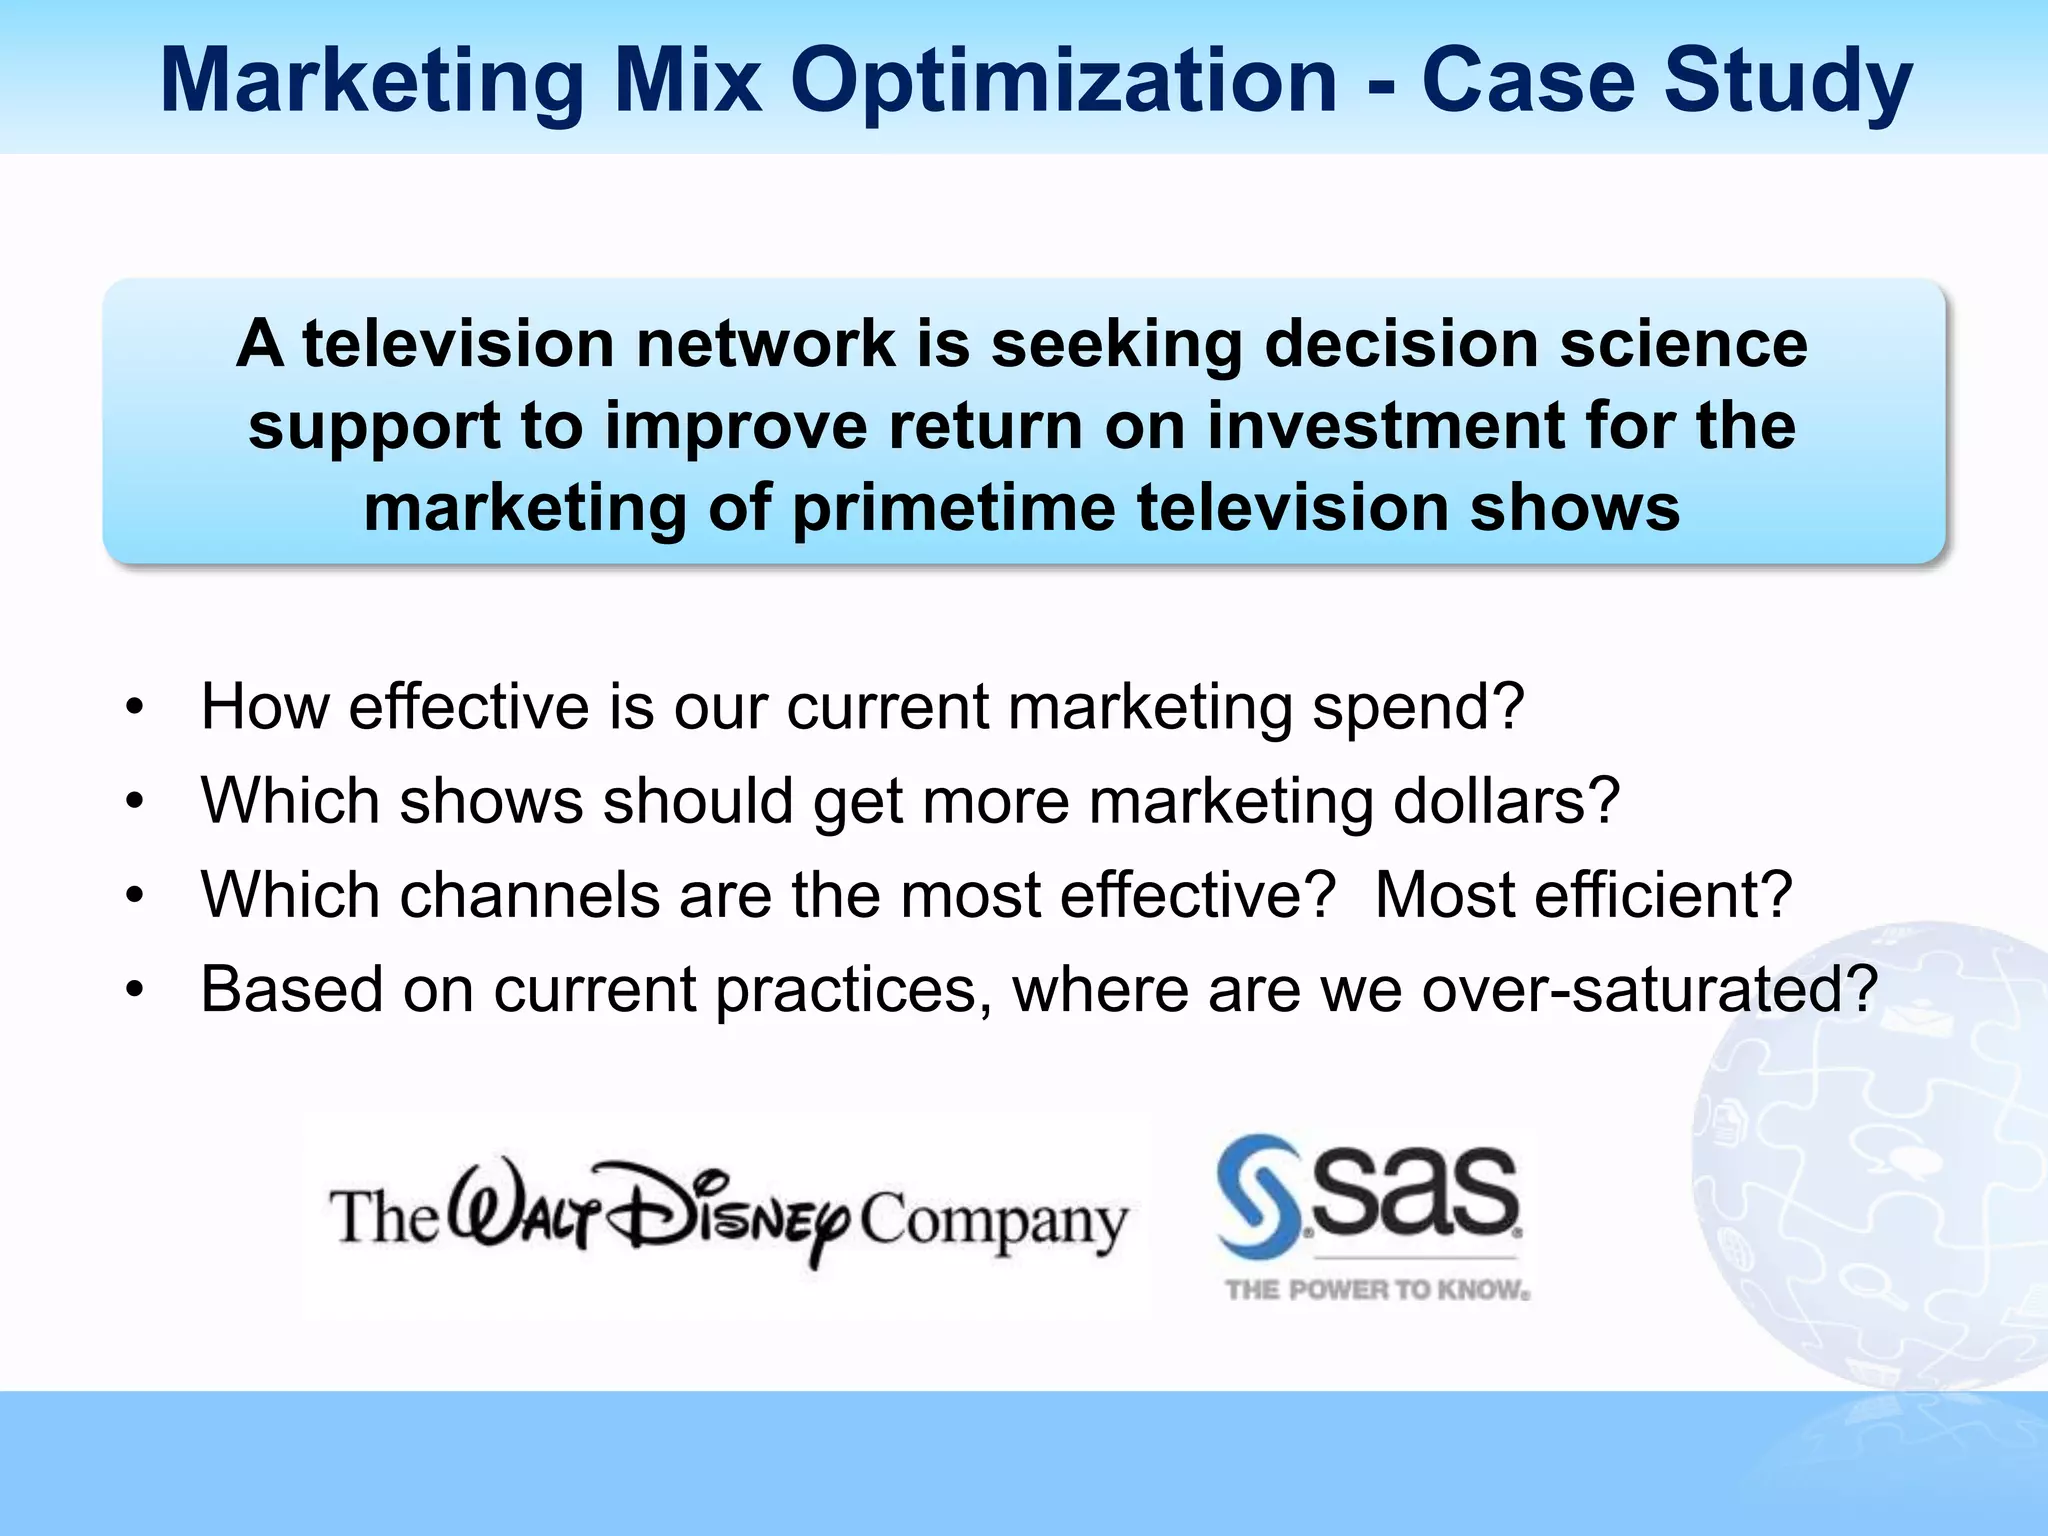
Real-Time Analytics &
     Attribution
• Noah Powers
  – Principal Solutions Architect, Customer Intelligence, SAS

• Patty Hager
  – Analytics Manager, Content/Communication/Entertainment, SAS

• Suneel Grover
  – Solutions Architect, Integrated Marketing Analytics & Visualization, SAS
  – Adjunct Professor, Business Analytics & Data
    Visualization,                 New York University (NYU)
Data Driven Strategy


http://youtu.be/oa6fi08T4n4?hd=1
Module 4
Strategy &
 Planning
Strategy & Planning

                    Marketing
                    Decisions
             Marketing Mix Optimization
      Marketing Operations Management
                   Case Studies


       Information Management

ERP    CRM         EDW      Online    Social   Other


                 Data Sources
What Is Marketing Mix Modeling & Optimization?
 An analytic process that quantifies the relationship
 between drivers and influencers of sales across channels

    • Understand the past performance of sales & marketing activities
    • Analyze and assess average ROI and marginal ROI
    • Evaluate marketing investment among increasing media options
    • Compare and assess different future marketing spending plans


                                                                        6
Questions Marketing Mix Can Address

• How can I still achieve my marketing goals while
  facing budget cuts?
• I am below target, how do I re-allocate my marketing budget to hit
  targets?
• How do I decide where to invest my marketing budget
  to support a product portfolio?
• How and where do I invest in social media to maximize business
  impacts?


                                                                       7
Increased Fragmentation of Channels


             Advertising
               Today


                                      8
Traditional Marketing Ecosystem


               The “Line”


                                  9
Push vs. Pull


 Push


                Pull


                       10
Change In Marketing Budgets


Source: E-Consultancy and SAS, Marketing Budgets 2011, Feb 2011


                                                                  11
How Big Is The Marketing Mix Challenge?
    Global Advertising Spending by Segment (US$ millions)
                         700,000
 Advertising
  spending is on a       600,000
  strong growth                                                                                         Trade magazines
  trajectory after       500,000
                                                                                                        Directories
  taking a dip in 2009                                                                                  Out-of-home
                         400,000                                                                        Radio
 Global advertising                                                                                    Newspapers
  spending is            300,000                                                                        Consumer magazines

  expected to exceed                                                                                    Video games
                                                                                                        Cinema
  half a trillion        200,000
                                                                                                        Television
  dollars in 2013                                                                                       Internet: wired and mobile
                         100,000

 Fastest growing
  channel is internet         0
                               2006 2007 2008 2009 2010p 2011 2012 2013 2014 2015
  and largest channel
                              Note: Television, radio, newspaper, consumer magazine, trade magazine, and directory Web site
  remains TV                  and mobile advertising is included in the respective segments and in the Internet advertising
                              segment but only once in the overall total.
                              Sources: PricewaterhouseCoopers LLP, Wilkofsky Gruen Associates


                                                                                                                                 12
Marketing Challenges: Financial Pressures
                Aggressive corporate goals & objectives
                Reductions in budgets
                Increased accountability and scrutiny into
                 marketing budgets


                                                              13
Marketing Mix Process
                                                                     • Measure sales
                                                                       contributions of
                                                                       marketing activities
• Allocate resources
  appropriately                                                      • Analyze ROMI

• Monitor effectiveness                Understand                    • Measure performance
                                        The Past                       vs. target
• Understand what to
  change to improve                                                  • Understand
  performance & when                                                   performance trends

• Consistently drive the
  best decisions
  through deep insight

                           Execute &                Forecast, Plan
                            Monitor                  & Optimize


                           • Explore impact of competing marketing plans
                           • Incorporate expected external factors
                           • Apply business constraints
                           • Optimize against business objectives
                                                                                              14
Understanding The Past: Developing Model

                             R² = 31%
KPI


                             Weeks


      Distribution   Price              Reality   Model 1


                                                            15
Understanding The Past: Developing Model

                             R² = 55%
KPI


                             Weeks


      Distribution   Price   Advertising   Reality   Model2


                                                              16
Understanding The Past: Developing Model

                                           R² = 70%
KPI


                                           Weeks


      Distribution   Price   Advertising      Promotions and Trade   Reality   Model 3


                                                                                         17
Understanding The Past: Developing Model
                                                         The model explains 95%
                                   R² = 95%              of the sales variation
KPI


                                   Weeks


      Distribution   Price                 Advertising        Promotion and Trade

      Competitor's   Seasonality           Reality            Model4
                                                                                    18
Isolating Brand’s Sales Drivers
                                                                     Where do our incremental sales
                                                                     come from?


       How are my sales affected
SOM


       by competitor activity?


                                              weeks


          price vs category              main competitor's advertising   base
          number of variants available   TV advertising                  Trade Marketing


                                                                                                      20
Sales Response Curves
     Diminishing Returns


 How much should I spend in one                  Diminishing returns- channel overinvested
 channel to have impact but not to
 overspend?
       incremental sales


Where can we generate savings
without hurting revenues and
profitablility?


                                              investement
                              TV     Online      POS        Direct Marketing


                                                                                             21
Scenario Planning & Optimization
                               What is the impact on sales of
                               different marketing plans?
      Understand                                                Simulate the
       the past          What will be the impact to my
                                                                   future
                         sales if my competitor increases
                         their advertising by 10%?
                                                                       scenario2
                   If I have to cut my budget
                   which activity I cut first and
                   by how much?
                                                                       scenario1

                                                                Simulate the
                                                                   future
KPI


                               Weeks


                                                                                   22
Proven Ways Marketing Mix Optimization Pays Out


       Financial                        Strategic                    Organizational
• Increased profit and revenue   • Provided concrete evidence of    • Improved efficiency of fiscal
  including:                       where marketing creates            budget planning process
  • 10-15% lifts in revenue        ROI, helping justify budget        (know in advance where to
  • 20-25% in incremental          increases and forecast the         invest and socialize across
    balances                       impact of cuts                     lines of business)
  • 10-25%+ in ROMI
• Example Client Results         • Monitor performance of           • Helped facilitate conversation
                                   investments and make course        between lines of business on
  • $9MM increased revenue
                                   corrections as needed.             where to invest/divest and why
    across 6 products
                                                                      ensuring organizational
  • $5MM saved by reducing                                            alignment
    ineffective marketing        • Aligned marketing budget to
                                   key strategic areas of
  • Increased MROI by 50%
                                   business focus and estimate
                                   the incremental return of that
                                   investment


                                                                                                       23
Case Study: Automotive Manufacturer

    Business issue                                 Solution                             Benefits

•   To sell 1 million vehicles in 12   We enabled them to:                    •   Capture ROI metrics across
    months by leveraging greater                                                  marketing activities including
                                       •   Understand what drove web              advertising and public relations
    market intelligence                    shopping and automobile sales          (PR)
•   As number 3 player in              •   Decrease spending on               •   “Halo” marketing effects were
    competitive mid-size sedan             ineffective marketing activities       uncovered from premium car
    market, customer needed to             across TV, Radio, Web, and Print       brand
                                           advertising
    reach its target market with                                              •   $5.1 million saved by reducing
    greater effectiveness and          •   Reallocate marketing funds to          ineffective marketing
    efficiency                             more effective marketing
                                           communications                     •   $8.6 million lift in sales due to
                                                                                  changes in marketing plan (and
                                       •   Perform “what if” analysis to          they exceeded their forecast of
                                           project future shopping and            selling over 1 million sedans by
                                           sales                                  year end)


                                                                                                                      24
Marketing Mix Optimization - Case Study

     A television network is seeking decision science
     support to improve return on investment for the
         marketing of primetime television shows

•   How effective is our current marketing spend?
•   Which shows should get more marketing dollars?
•   Which channels are the most effective? Most efficient?
•   Based on current practices, where are we over-saturated?
Marketing Mix Optimization - Case Study
Marketing Operations Management


                                  27
Marketers Tell Us…
 They are being asked to do more with the same or fewer resources
  in less time.

 They lack visibility into marketing activities to ensure alignment with
  organizational objectives and strategies

 They often do not have a way to effectively manage and measure
  marketing spend.

 They lack a central system of record for collaboratively managing
  their portfolio across all channels

 Their processes are neither optimized nor consistent across all
  channels

 Their processes, assets and data are not readily available for re-use

                                                                            28
How Do You Manage Your Marketing Operations?


There is a better way….


                                               29
Marketing Operations Management
      Software Can Help Organizations
 Improving the marketing velocity by enabling the
  marketing team to perform more effectively and
  efficiently
 Providing greater transparency & visibility into the
  process
 Providing automated processes to manage all aspects of
  your marketing operations including
    Planning
    Process Management
    Budgeting and Spend Management
    Performance and Financial Tracking

                                                           30
Marketing Operation Workflow
                            Planning

                                Calendars/Resources

                                Budgets/Performance


Reports                                               Execution
    Dashboards/Reports                                     Workflows/Approvals

    Integration/Warehouse                                  Estimates/Expenses


                            Content

                                 Assets/Sites

                                 Customization


                                                                                 31
Marketing Planning


         CMO, Marketing VPs              Corporate Finance   Marketing Analytics


•   Determine Overall Marketing Strategy
•   Annual Marketing Planning and Budget allocation
•   Establish Metrics and Key Performance Indicators
                                                                                   32
Planning & Budgeting – Conceptual Framework
CEO, CFO, CMO                            Enterprise


VP Marketing         Plan for BU1         Plan for BU2               Plan for BU3…


Brand, Product,           Product         Integrated             Events &               Collateral
Marketing Managers        Launch          Campaigns             Tradeshows                  …


Campaign           Print, TV,               Direct                    Online &
Manager          Radio, Outdoor            Marketing                 Social Media


Marketing Services          Email          Direct Mail         Telemarketing           Door-to-door
Creative Agency


Printers             Budgets &      Resources &                              Digital          Metrics &
                                                         Workflows
                      Spends         Calendars                               Assets             KPIs
                                                                                                          33
Marketing Execution


             Requestor                   Project Manager         Contributors


           Brief                            Project                 Tasks


                                                Deliverables
•   Align Marketing Plans w/ Overall Strategy
•   Marketing Deliverable Planning & Budget Allocation
•   Process Automation to Streamline Collaboration & Execution
•   Resource Management & Time Tracking
                                                                                34
Manage & Monitor Projects


                            35
Digital Asset Management


              Agency                      Contributors      End Users


•   Central Repository of all Digital Assets
•   Catalogue Digital Assets for History & Re-use
•   Digital Rights Management for Compliance Tracking
•   Enable process ownership vs. hiring 3rd party support
                                                                        36
Digital Asset Management


                           37
Analytics & Reporting


    CMO, Marketing VPs   Corporate Finance   Marketing Analytics   Agency   Contributors


•     Real-time Reporting on Marketing Activities
•     Enable Closed-Loop Marketing
•     Integrate with Enterprise Data Warehouse
•     Out-of-the-box &Ad hoc Reporting
                                                                                           38
Marketing Analytics & Reports


                                39
Analyze The Campaign


                       40
Integrated Marketing Management (IMM)


 Plan Created             Marketing Workflow         Build Campaign
 • Marketing Calendar     •Deliverable created       Details
 • Budgets created        •Tasks defined             • Counts generated
                          •Gather brief info         • Campaign ready for
                          •Gather UDF info             approval
                          •Initiate campaign to CM
                          •Email Sent


 Send to Scheduler        Campaign Approval          Campaign Review
 • Schedule created and   • Campaign is approved     • Counts
   sent to scheduler or   • State changed to         • Brief details
   Admin                    approved in CM           • Treatments
                          • Email Sent


                                                                            41
Advantages of IMM

 Enhanced collaboration between marketing strategists, project
  managers, and campaign analysts
 Improved productivity via both top-down and bottom-up direct
  marketing campaign planning and execution, as well as reusability
  of all facets of marketing campaigns
     Including segments, creative materials, workflow, etc.
 Increased visibility as a result of being able to plan, execute, and
  track all campaign types within a central repository
     “Above the line” or indirect marketing such as TV advertisements,
      billboards, and radio ads
     “Below the line” marketing such as direct mail/email/mobile/website
      personalization)


                                                                            42
Case Study: Consumer Packaged Goods
Business Issue
 Ownership of final artwork with agencies
                                                     “Without this approach, it
 Huge losses in collateral management because of
                                                     would take four project
  no digital asset re-use
                                                     coordinators instead of two
 Mismanagement of content, no collateral tracking   to process the transactions.
  system                                             This has resulted in annual
                                                     cost savings of more than
                                                     $200,000.”
Results
                                                     Director, Creative Services
 Approvals cycles reduced from 14 to 2 weeks
 No defects in graphics development
 Annual artwork savings of $3 Million
 Overall 25% Productivity gain


                                                                                    43
Case Study: Global Agribusiness
Business Issue
 New corporate and brand identity needed

 Better ongoing maintenance of brand assets required

 Manual processing of artwork delayed product launches

 Cost transparency not feasible


Results
 Design approval backlog has been eliminated and total design time has reduced
  by 50%.

 Yearly savings of $200,000 on production and distribution of identity manuals.

 Yearly savings of $2 million on streamlining design process of digital printing.

 Total cost per packaging label has been reduced by 65%.


                                                                                     44
Questions?
THANK YOU


C op yr i g h t © 2 0 1 2 , S A S I n s t i t u t e I n c . A l l r i g h t s r es er v e d .     www.SAS.com

Module 4 strategy & planning final

  • 1.
  • 2.
    • Noah Powers – Principal Solutions Architect, Customer Intelligence, SAS • Patty Hager – Analytics Manager, Content/Communication/Entertainment, SAS • Suneel Grover – Solutions Architect, Integrated Marketing Analytics & Visualization, SAS – Adjunct Professor, Business Analytics & Data Visualization, New York University (NYU)
  • 3.
  • 4.
  • 5.
    Strategy & Planning Marketing Decisions Marketing Mix Optimization Marketing Operations Management Case Studies Information Management ERP CRM EDW Online Social Other Data Sources
  • 6.
    What Is MarketingMix Modeling & Optimization? An analytic process that quantifies the relationship between drivers and influencers of sales across channels • Understand the past performance of sales & marketing activities • Analyze and assess average ROI and marginal ROI • Evaluate marketing investment among increasing media options • Compare and assess different future marketing spending plans 6
  • 7.
    Questions Marketing MixCan Address • How can I still achieve my marketing goals while facing budget cuts? • I am below target, how do I re-allocate my marketing budget to hit targets? • How do I decide where to invest my marketing budget to support a product portfolio? • How and where do I invest in social media to maximize business impacts? 7
  • 8.
    Increased Fragmentation ofChannels Advertising Today 8
  • 9.
  • 10.
    Push vs. Pull Push Pull 10
  • 11.
    Change In MarketingBudgets Source: E-Consultancy and SAS, Marketing Budgets 2011, Feb 2011 11
  • 12.
    How Big IsThe Marketing Mix Challenge? Global Advertising Spending by Segment (US$ millions) 700,000  Advertising spending is on a 600,000 strong growth Trade magazines trajectory after 500,000 Directories taking a dip in 2009 Out-of-home 400,000 Radio  Global advertising Newspapers spending is 300,000 Consumer magazines expected to exceed Video games Cinema half a trillion 200,000 Television dollars in 2013 Internet: wired and mobile 100,000  Fastest growing channel is internet 0 2006 2007 2008 2009 2010p 2011 2012 2013 2014 2015 and largest channel Note: Television, radio, newspaper, consumer magazine, trade magazine, and directory Web site remains TV and mobile advertising is included in the respective segments and in the Internet advertising segment but only once in the overall total. Sources: PricewaterhouseCoopers LLP, Wilkofsky Gruen Associates 12
  • 13.
    Marketing Challenges: FinancialPressures  Aggressive corporate goals & objectives  Reductions in budgets  Increased accountability and scrutiny into marketing budgets 13
  • 14.
    Marketing Mix Process • Measure sales contributions of marketing activities • Allocate resources appropriately • Analyze ROMI • Monitor effectiveness Understand • Measure performance The Past vs. target • Understand what to change to improve • Understand performance & when performance trends • Consistently drive the best decisions through deep insight Execute & Forecast, Plan Monitor & Optimize • Explore impact of competing marketing plans • Incorporate expected external factors • Apply business constraints • Optimize against business objectives 14
  • 15.
    Understanding The Past:Developing Model R² = 31% KPI Weeks Distribution Price Reality Model 1 15
  • 16.
    Understanding The Past:Developing Model R² = 55% KPI Weeks Distribution Price Advertising Reality Model2 16
  • 17.
    Understanding The Past:Developing Model R² = 70% KPI Weeks Distribution Price Advertising Promotions and Trade Reality Model 3 17
  • 18.
    Understanding The Past:Developing Model The model explains 95% R² = 95% of the sales variation KPI Weeks Distribution Price Advertising Promotion and Trade Competitor's Seasonality Reality Model4 18
  • 20.
    Isolating Brand’s SalesDrivers Where do our incremental sales come from? How are my sales affected SOM by competitor activity? weeks price vs category main competitor's advertising base number of variants available TV advertising Trade Marketing 20
  • 21.
    Sales Response Curves Diminishing Returns How much should I spend in one Diminishing returns- channel overinvested channel to have impact but not to overspend? incremental sales Where can we generate savings without hurting revenues and profitablility? investement TV Online POS Direct Marketing 21
  • 22.
    Scenario Planning &Optimization What is the impact on sales of different marketing plans? Understand Simulate the the past What will be the impact to my future sales if my competitor increases their advertising by 10%? scenario2 If I have to cut my budget which activity I cut first and by how much? scenario1 Simulate the future KPI Weeks 22
  • 23.
    Proven Ways MarketingMix Optimization Pays Out Financial Strategic Organizational • Increased profit and revenue • Provided concrete evidence of • Improved efficiency of fiscal including: where marketing creates budget planning process • 10-15% lifts in revenue ROI, helping justify budget (know in advance where to • 20-25% in incremental increases and forecast the invest and socialize across balances impact of cuts lines of business) • 10-25%+ in ROMI • Example Client Results • Monitor performance of • Helped facilitate conversation investments and make course between lines of business on • $9MM increased revenue corrections as needed. where to invest/divest and why across 6 products ensuring organizational • $5MM saved by reducing alignment ineffective marketing • Aligned marketing budget to key strategic areas of • Increased MROI by 50% business focus and estimate the incremental return of that investment 23
  • 24.
    Case Study: AutomotiveManufacturer Business issue Solution Benefits • To sell 1 million vehicles in 12 We enabled them to: • Capture ROI metrics across months by leveraging greater marketing activities including • Understand what drove web advertising and public relations market intelligence shopping and automobile sales (PR) • As number 3 player in • Decrease spending on • “Halo” marketing effects were competitive mid-size sedan ineffective marketing activities uncovered from premium car market, customer needed to across TV, Radio, Web, and Print brand advertising reach its target market with • $5.1 million saved by reducing greater effectiveness and • Reallocate marketing funds to ineffective marketing efficiency more effective marketing communications • $8.6 million lift in sales due to changes in marketing plan (and • Perform “what if” analysis to they exceeded their forecast of project future shopping and selling over 1 million sedans by sales year end) 24
  • 25.
    Marketing Mix Optimization- Case Study A television network is seeking decision science support to improve return on investment for the marketing of primetime television shows • How effective is our current marketing spend? • Which shows should get more marketing dollars? • Which channels are the most effective? Most efficient? • Based on current practices, where are we over-saturated?
  • 26.
  • 27.
  • 28.
    Marketers Tell Us… They are being asked to do more with the same or fewer resources in less time.  They lack visibility into marketing activities to ensure alignment with organizational objectives and strategies  They often do not have a way to effectively manage and measure marketing spend.  They lack a central system of record for collaboratively managing their portfolio across all channels  Their processes are neither optimized nor consistent across all channels  Their processes, assets and data are not readily available for re-use 28
  • 29.
    How Do YouManage Your Marketing Operations? There is a better way…. 29
  • 30.
    Marketing Operations Management Software Can Help Organizations  Improving the marketing velocity by enabling the marketing team to perform more effectively and efficiently  Providing greater transparency & visibility into the process  Providing automated processes to manage all aspects of your marketing operations including  Planning  Process Management  Budgeting and Spend Management  Performance and Financial Tracking 30
  • 31.
    Marketing Operation Workflow Planning Calendars/Resources Budgets/Performance Reports Execution Dashboards/Reports Workflows/Approvals Integration/Warehouse Estimates/Expenses Content Assets/Sites Customization 31
  • 32.
    Marketing Planning CMO, Marketing VPs Corporate Finance Marketing Analytics • Determine Overall Marketing Strategy • Annual Marketing Planning and Budget allocation • Establish Metrics and Key Performance Indicators 32
  • 33.
    Planning & Budgeting– Conceptual Framework CEO, CFO, CMO Enterprise VP Marketing Plan for BU1 Plan for BU2 Plan for BU3… Brand, Product, Product Integrated Events & Collateral Marketing Managers Launch Campaigns Tradeshows … Campaign Print, TV, Direct Online & Manager Radio, Outdoor Marketing Social Media Marketing Services Email Direct Mail Telemarketing Door-to-door Creative Agency Printers Budgets & Resources & Digital Metrics & Workflows Spends Calendars Assets KPIs 33
  • 34.
    Marketing Execution Requestor Project Manager Contributors Brief Project Tasks Deliverables • Align Marketing Plans w/ Overall Strategy • Marketing Deliverable Planning & Budget Allocation • Process Automation to Streamline Collaboration & Execution • Resource Management & Time Tracking 34
  • 35.
    Manage & MonitorProjects 35
  • 36.
    Digital Asset Management Agency Contributors End Users • Central Repository of all Digital Assets • Catalogue Digital Assets for History & Re-use • Digital Rights Management for Compliance Tracking • Enable process ownership vs. hiring 3rd party support 36
  • 37.
  • 38.
    Analytics & Reporting CMO, Marketing VPs Corporate Finance Marketing Analytics Agency Contributors • Real-time Reporting on Marketing Activities • Enable Closed-Loop Marketing • Integrate with Enterprise Data Warehouse • Out-of-the-box &Ad hoc Reporting 38
  • 39.
  • 40.
  • 41.
    Integrated Marketing Management(IMM) Plan Created Marketing Workflow Build Campaign • Marketing Calendar •Deliverable created Details • Budgets created •Tasks defined • Counts generated •Gather brief info • Campaign ready for •Gather UDF info approval •Initiate campaign to CM •Email Sent Send to Scheduler Campaign Approval Campaign Review • Schedule created and • Campaign is approved • Counts sent to scheduler or • State changed to • Brief details Admin approved in CM • Treatments • Email Sent 41
  • 42.
    Advantages of IMM Enhanced collaboration between marketing strategists, project managers, and campaign analysts  Improved productivity via both top-down and bottom-up direct marketing campaign planning and execution, as well as reusability of all facets of marketing campaigns  Including segments, creative materials, workflow, etc.  Increased visibility as a result of being able to plan, execute, and track all campaign types within a central repository  “Above the line” or indirect marketing such as TV advertisements, billboards, and radio ads  “Below the line” marketing such as direct mail/email/mobile/website personalization) 42
  • 43.
    Case Study: ConsumerPackaged Goods Business Issue  Ownership of final artwork with agencies “Without this approach, it  Huge losses in collateral management because of would take four project no digital asset re-use coordinators instead of two  Mismanagement of content, no collateral tracking to process the transactions. system This has resulted in annual cost savings of more than $200,000.” Results Director, Creative Services  Approvals cycles reduced from 14 to 2 weeks  No defects in graphics development  Annual artwork savings of $3 Million  Overall 25% Productivity gain 43
  • 44.
    Case Study: GlobalAgribusiness Business Issue  New corporate and brand identity needed  Better ongoing maintenance of brand assets required  Manual processing of artwork delayed product launches  Cost transparency not feasible Results  Design approval backlog has been eliminated and total design time has reduced by 50%.  Yearly savings of $200,000 on production and distribution of identity manuals.  Yearly savings of $2 million on streamlining design process of digital printing.  Total cost per packaging label has been reduced by 65%. 44
  • 45.
  • 46.
    THANK YOU C opyr i g h t © 2 0 1 2 , S A S I n s t i t u t e I n c . A l l r i g h t s r es er v e d . www.SAS.com

Editor's Notes

  • #7 Speaker:So, who are we? SAS is the worldwide leader in business analytics software. Our founder created the first tools to mine business data 34 years ago. We are now the largest independent software company in the world with over $2.3B in revenues offices globally with over 11000 peopleWe have offices around the globe with a full sales and service team, as well as training facilities. We serve 45,000 customers worldwide and are pervasive among the Fortune Global 500 companies. SAS ‘ customer focused culture has led us to the highest customer satisfaction rankings in our industry with 9/10 customers satisfied with our services and willing to recommend us. SAS Advanced Analytics Lab - is dedicated to solving complex marketing problems for customers across your industry. The AAL team employs many of the leading statistical minds across North America and has the unique depth, experience, and education to solve complex customer problems through using analytically creative approaches. This highly-skilled team will lead your Marketing Mix Optimization initiative focusing on better ways to:Accelerate your time to value. Using proven deployment methodologies, the AAL will identify an overall plan that will achieve your objectives and map data and modeling strategies to this plan. The AAL can also work with you to define and prioritize overall objectives, as well as leverage strategies and results from other client undertakings. Reduce costs and gain competitive advantages by acquiring in-house capabilities. The SAS AAL approach to marketing mix modeling strives to empower your team to develop in-house analytical skills and deploy leading systems and processes to guide decision-making. By developing these skills, your marketing analysts and decision makers are able to generate instant reports at no extra charge rather than outsourcing analytics to vendors at high costs and slow turnaround. Reduce costs associated with switching vendors. The AAL and Marketing Mix Advisor promotes the consolidation of results from multiple sources of marketing mix models (regardless of who built them). The SAS approach can intelligently store insourced and outsourced model results thereby allowing your team to enhance their own analytical skills and more readily pick and choose agencies and vendors that meet their ever-changing needs. In effect, the solution lowers the switching costs associated with selecting market research providers all the while establishing a path toward developing their own analytical capability.
  • #9 Media consumption is more fragmented than ever. Consumers enjoy media on more devicesand platforms than ever before, often simultaneously.1 According to Forrester, 73% of US adultsmultitask with at least one other medium while watching TV.2 In order to correctly measure theeffectiveness of their marketing efforts, marketers need to understand the interdependence ofold and new media as customers are exposed to multiple messages at the same time.
  • #10 ATL refers back to the balance sheet – Above the Line advertising costs are part of ‘costs of sales’ and are deducted before Gross Profit is determined, non-commission baring advertising is part of the operating expenses and is deducted before Net Profit is determined.ATL marketing makes use of print, broadcast, and outdoor advertising to reach large audiences that strengthen brands and convey general product information or elicit emotional responses from consumers exposed to the advertisementsBTL marketing uses direct mail, insert media, database marketing, interactive marketing, and promotional marketing to create specifically aimed marketing campaigns that offer consumers the ability to easily respond while allowing marketers to track the success of the efforts with little difficulty
  • #11 Create a solar system of owned media. Owned media is a channel you control. There is fully-owned media (like your website) and partially-owned media (like Facebook fan page or Twitter account). Owned media creates brand portability. Now you can extend your brand's presence beyond your web site so that it exists in many places across the web - specifically through social media sites and unique communities. In a recession in which marketing budgets are being cut by 20%, the ability to communicate directly with consumers who want to engage with your brand through long-term relationships can be invaluable.   Recognize that earned media is a result of brand behavior. "Earned media" is an old PR term that essentially meant getting your brand into free media rather than having to pay for it through advertising. However the term has evolved into the transparent and permanent word-of-mouth that is being created through social media. You need to learn how to listen and respond to both the good (positive organic) and bad (spurned) as well as consider when to try and stimulate earned media through word-of-mouth marketing. Your paid media is not dead, but it is evolving into a catalyst. Many people are predicting the end of paid media (aka advertising). However, that prediction may be premature as no other type of media can guarantee the immediacy and scale that paid media can. However, paid media is shifting away from the foundation and evolving into a catalyst that is needed at key periods to drive more engagement
  • #12 TV still has it challenges ahead, but for now, when it comes to reach and impact – it still remains the only game in town
  • #13 The larger the advertising spend, the larger the need for organizations to understand and optimize their advertising spending
  • #16 Marketing-Mix Modeling leverages econometric techniques like regression models to quantify the contribution of each driver to brands KPIThe more dependable variables we can introduce into the model the more likely we are that the model will explain the reality. The model should fit historic data. There are to measures of a model fit R-squard and Estimated Standard Error
  • #20 Thanks to modeling we can calculate Base sales: sales level that is referred to as long run demand level or consumers preferences which would have stayed unchanged in a short term even if brand had stopped all marketing activityIncremental sales: captures additional sales driven by marketing activity.
  • #21 One key advantage is that Econometrics can separate out the brand drivers, quantify their individual effects and arbitrate between them.Making a sales decomposition we can not only calculate incremental sales- i.e how much you would have sold if it haden’t been for the marketing activity in question. It also allowes you to quantify negative impact of some factors. For example we can calculate how much sales was lost due to brand’s price relative to category price or our competitor’s TV activity. It is common practice to measure the sales effect of a piece of direct response activity or promotion (whether online and offline) by counting the number of people who responded to it, and then counting how many of them went on to buy the product. However, this calculation assumes that all of those sales were incremental sales generated by the direct response activity. In fact, some of those people would probably have bought the product anyway, even if they hadn’t been exposed to the activity. This is were econometrics can also helpBecause you can quantify the effect of an individual activity you can calculate What’s the return on investment (ROMI) on our marketing activities Marketing effectivenessisoftenassesed in terms of incrementalrevenuegeneratedratherthanprofit.Usuallybecause data to calculate profit is not availableTo calculate profit youneed to calculateIncrementalsalesrevenue to manufacturer ( need to knowwhatis the retailergrossmargin) – most agencieswork with data sourcesthatmeasuresales data attheirretailpriceIncrementalvariablecostsMarginalcontribution from incrementalsalesNet profit = marginalcontribution from incrementalsales –cost of the campaign
  • #24 There are three ways that SAS has seen optimization benefit organizations. 1) Financial:Depending upon the client and industry, customers have used optimization to increase their incremental profits and revenues derived from marketing initiativesCustomers have also looked at how to best drive balance growth and incremental funds managed that are driven off of marketing activities. Finally, every marketer is concerned with being more efficient and marketing return on investment is one of the key measures marketers use to business case this type of solution to improve their overall returns. CUSTOMER EXAMPLES: Reduced Marketing Spend by 2% due to optimizations found (International B2B/B2C Company – Office Depot)Using the combination of MMX & MO, ROI- MMX/MO vs. BAU yielded an ~$9,000,000 increased revenue for each of the 6 products. (Qwest)13.7 million saved by reducing ineffective marketing, “Halo” marketing effects were uncovered from premium car brand, experienced lift in sales due to changes in marketing plan (they exceeded their forecast of selling over 1 million sedans by year end) (International Automotive Company)Using the solution, MMX forecasts showed that response would be down 5 to 10% for the first quarter of this year, given the planned marketing spend/activity. As the solution was so new, the company decided to go with their in-house forecasts. As the results came in for the first quarter, it became apparent that the SAS advanced forecasting based on marketing input was right on target and they did realize a reduction in response of 10%. Had they accepted the SAS forecasts, they might have been able to increase marketing activity to off-set the reduction in response.2) Strategic: In addition to the financial benefits, there are overarching strategic benefits of such a solution. This tool helps you justify budget increases (and where to put the incremental dollars for the best pay back), and in the inevitable cases where budgets are cut. It helps you determine WHERE to cut and how to make the impact of that cut have less of a negative impact on your business. Optimization also helps ensure you get to market quicker and align your budget against those areas that make sense to the goals of the bank and your key areas of growth opportunity. CUSTOMER EXAMPLES: Optimizing constrained channel resources while satisfying budget requirements, increased Marketing Program ROI by 50% (North American Bank: Scotiabank)SAS helped Wachovia to realize that they could increase spend on on-line advertising, and decrease spend in traditional advertising categories (radio and television) while retaining existing customers and attracting new ones. “We want to better understand whether our marketing dollars are being used effectively, and SAS helps us do that.” - SVP Marketing (North American Bank: Wachovia) 3) Organizational:Lastly, and while you might not see this on a business case template, it is very much a benefit for customers who we’ve seen implement optimization solutions. It helps neutralize the business and provide key facts that help facilitate conversations between lines of business regarding where to invest marketing dollars for the good of the retail bank overall. Because if you’re like most resort/destination companies, the marketing budget is held centrally and each line of business gets a piece. The question is who gets what piece and does it pay? This helps you answer that and play the corporate steward who allocates budget on behalf of the entire bank. CUSTOMER EXAMPLE: Cultural change led by analytical approach to Marketing Budget Optimization – they had to learn to balance Customer Acquisition goals with Customer Equity goals (North American Bank – Wachovia)
  • #44 Dreyers
  • #45 Syngenta