Download as PDF, PPTX


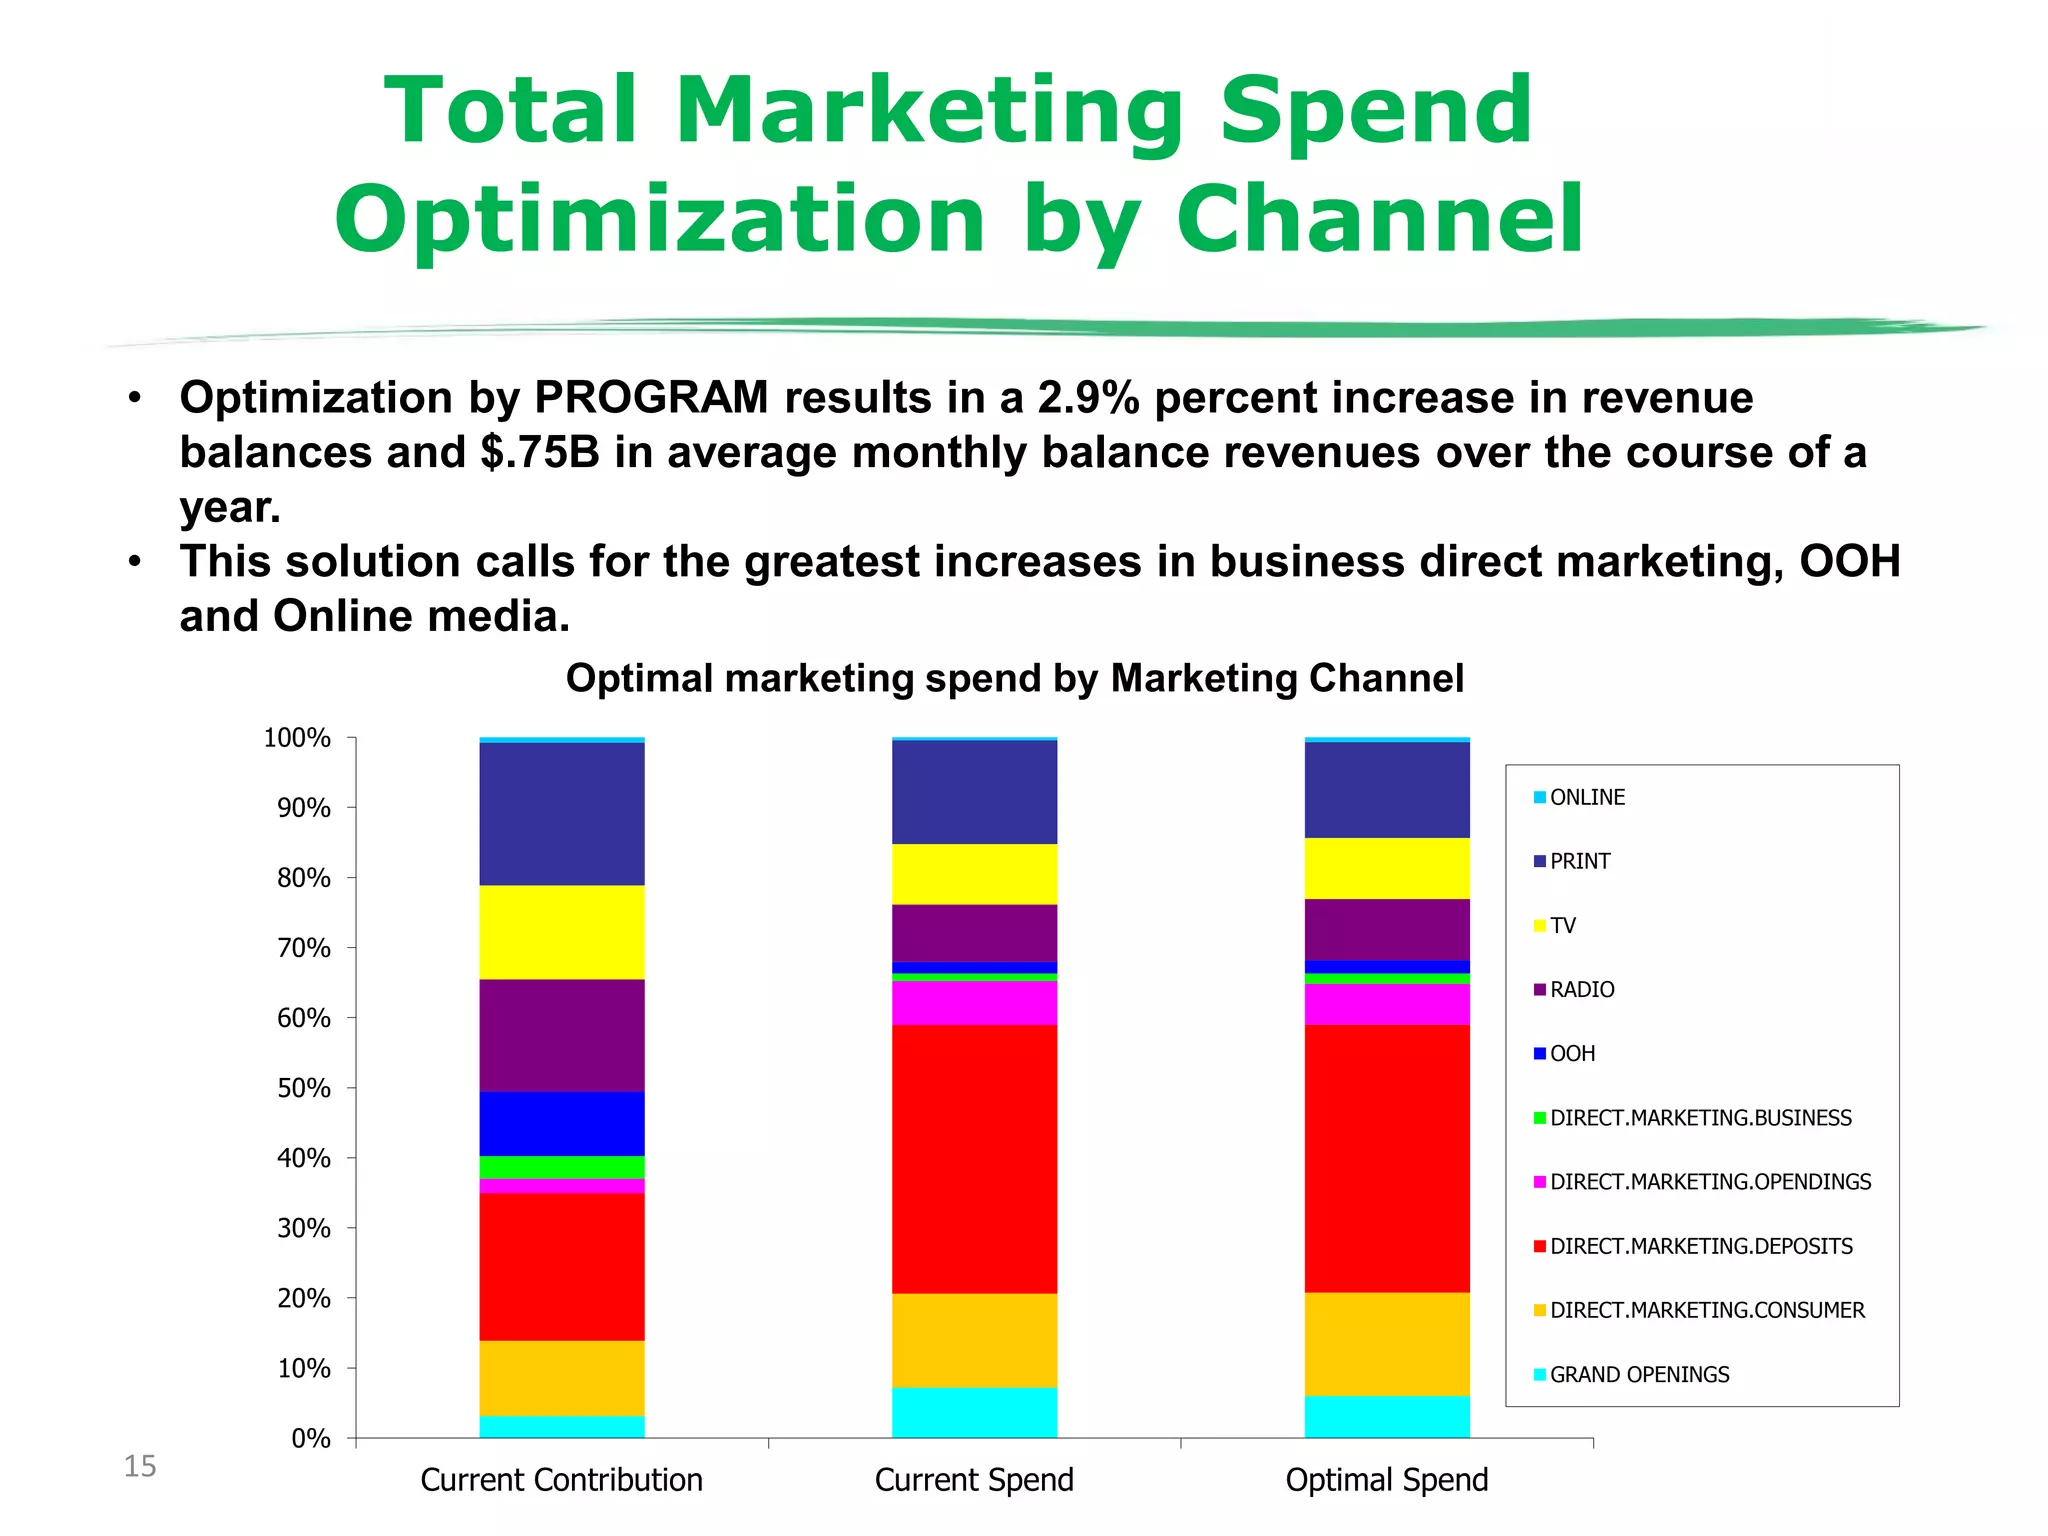
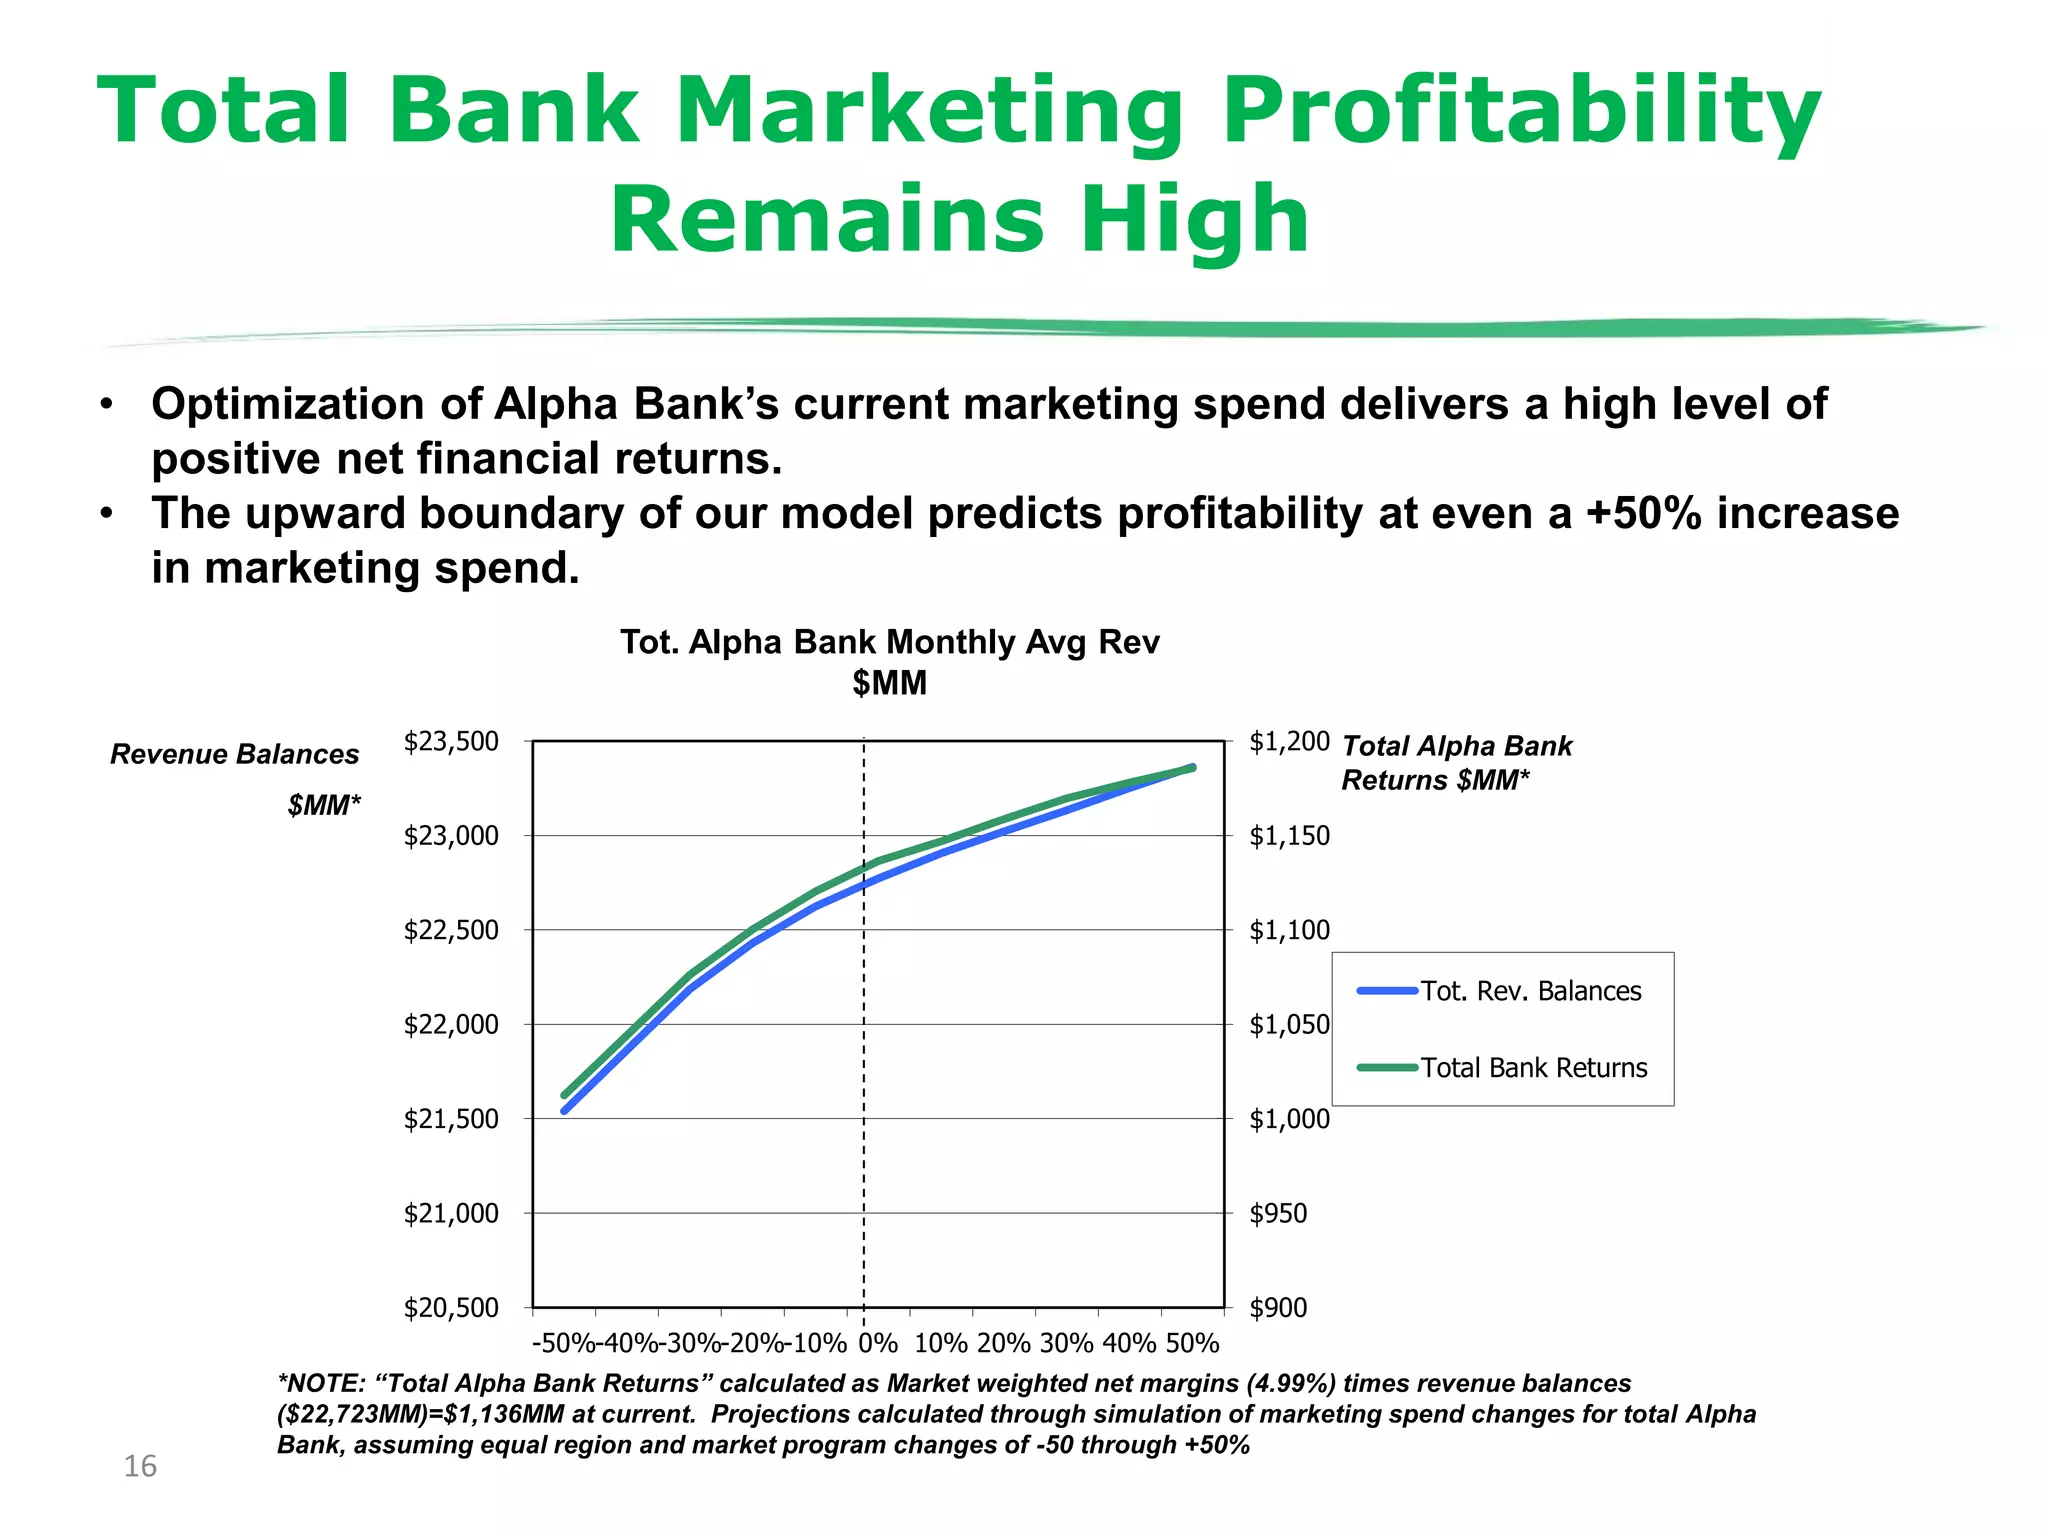


The document details a marketing optimization modeling study conducted for Alpha Bank, which revealed that marketing contributed only 8.4% of total revenue despite the bank spending $39.5 million, generating a substantial ROI. Notably, the modeling found that the bank was under-investing in marketing and could achieve significantly higher growth with increased spending, especially in new markets and for branded products. Additionally, the impact of Hurricane Katrina was surprisingly positive, contributing to increased revenues due to inflows from federal aid and insurance claims.


![ict_presentation_final_final_final[1].pptx](https://cdn.slidesharecdn.com/ss_thumbnails/ictpresentationfinalfinalfinal1-251230145259-2b4839bd-thumbnail.jpg?width=640&height=640&fit=bounds)


