Downloaded 863 times


![Phoenix Marketing International 55 Walls Drive Suite 205 Fairfield, CT 06824 Don Holtz Group President (203) 254-8311 [email_address]](https://image.slidesharecdn.com/mmmwebnarshare-100224061554-phpapp02/85/Marketing-Mix-Models-In-a-Changing-Environment-39-320.jpg)

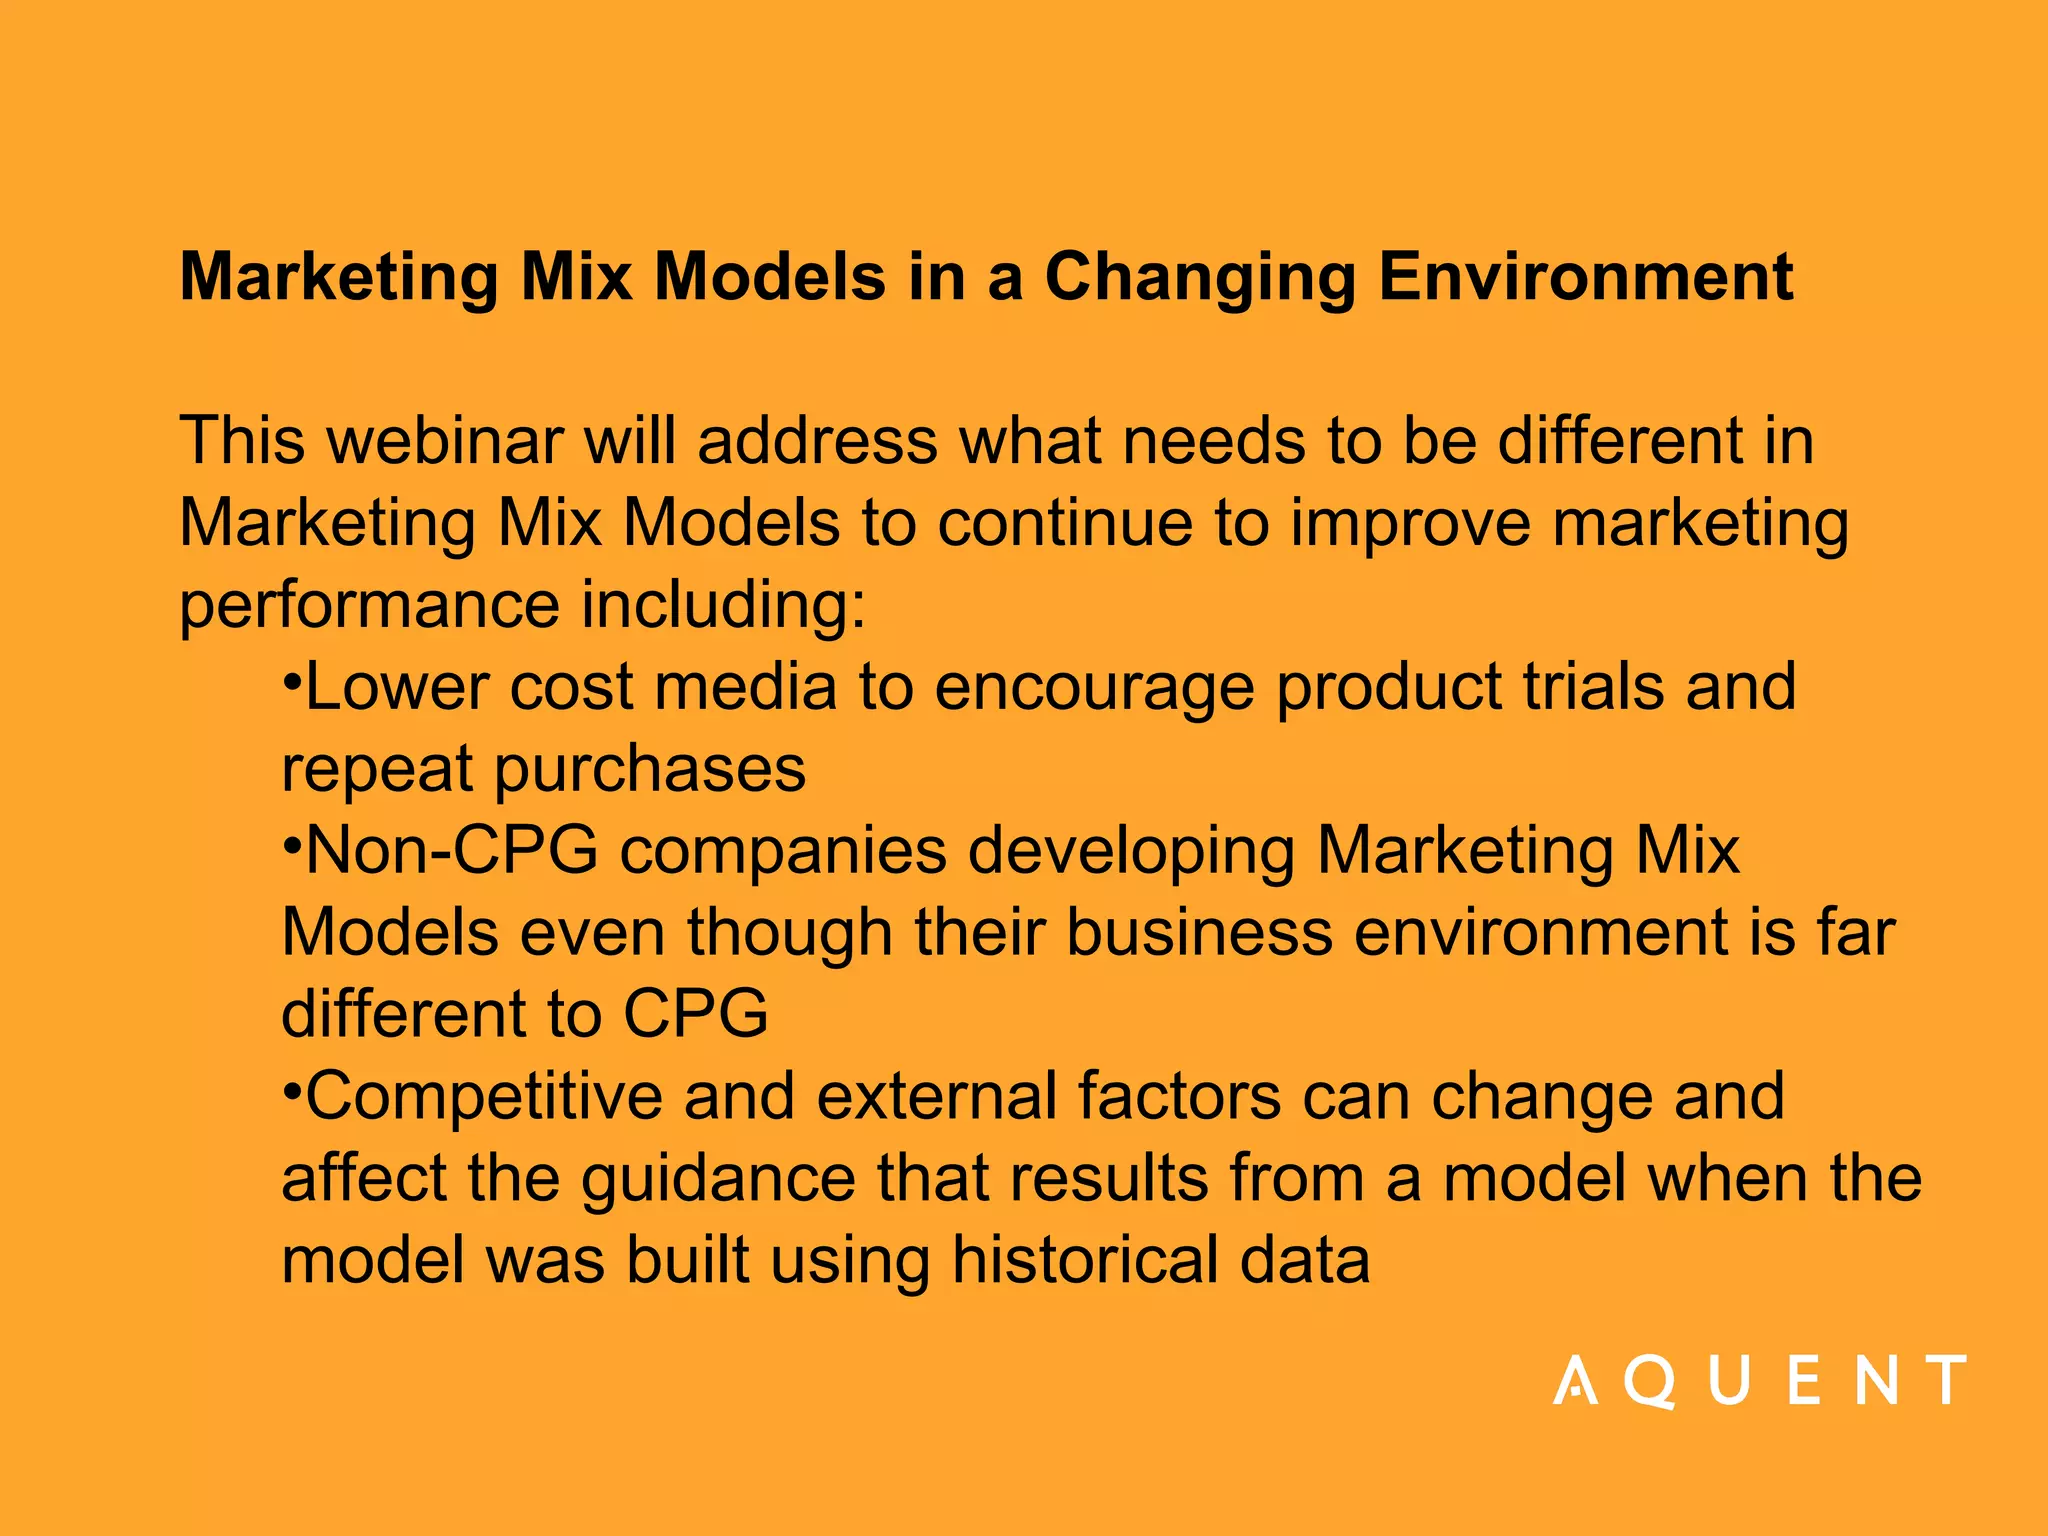
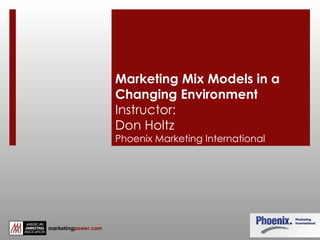
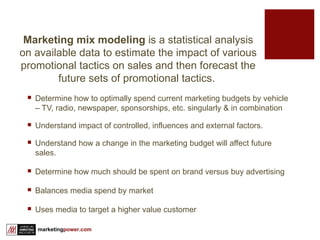
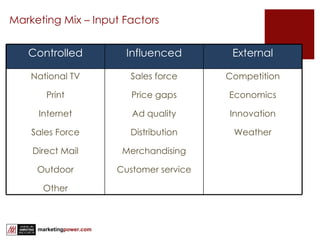
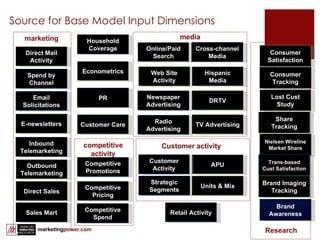
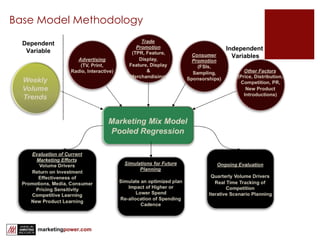
The webinar discusses necessary adjustments to marketing mix models to enhance marketing performance, addressing issues such as cost-effective media strategies and the impacts of competitive and external factors on model predictions. Led by Don Holtz from Phoenix Marketing International, the session emphasizes the importance of understanding historical data correlations to optimize marketing budgets and improve ROI through statistical analyses. It also highlights the ongoing relevance of marketing mix modeling in both consumer packaged goods and non-consumer packaged goods contexts, especially amidst changing market dynamics.