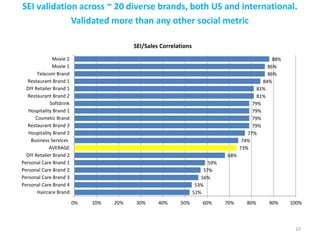
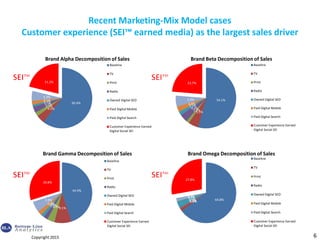
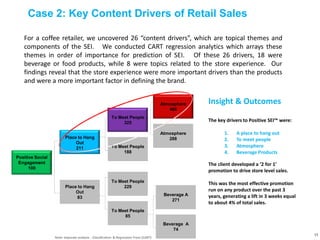
Measuring the Customer
Experience with Social Media
New Developments in Measurement and Analytics
Measuring the Customer Experience is Essential
1. It has been found the be the largest single business driver for many
brands
2. Measurement of this experience is considered to be essential for firms
who aspire to be “customer centric”.
Millions of social media comments, all reflecting real brand-
customer experiences. As Jeff Bezos said: “Your brand is
what people say about you when you’re not in the room.”
United Airlines is
never on-time and
their service sucks
I love drinking
Coke with pizza!
My iPhone
is an essential
part of my life!
Progressive has the
cheapest insurance
but their claims service
Is terrible!
I bought a Maytag
at Lowe’s and it
cleans like no other
My Honda CRV is
great on gas
economy!
For health reasons
I have cut back
on Diet Coke
The Porsche 911
Is the sexiest
car on the planet!
I keep getting
dropped calls on the
Sprint network!
I love how my son
plays with his Lego
blocks
A Unique Way to Mine Social
Conversations
4
Stance
Shift
Syntax &
Structure
Tonality &
Sentiment
Experiential
Statement
Custom
Dictionary Context
Personal
Emotional
Customer Experience
• Leverages 30+ rules of language through a ‘scoring algorithm’ that turns textual data into a scaled
metric called the Semantic Engagement Index (SEITM)
• Is built upon a validated Linguistics approach known as ‘Stance Shift Analysis’
• Takes into account several critical components of conversations usually ignored
• Captures and measures
the value of the customer
experience
• Links closely to sales -
represents brand health
• Uncovers the Why’s and
the underlying drivers
both positive and negative
I just got my cool new iPhone from BestBuy,
however, I keep getting dropped calls on the
Brand X 4G network
Positive
Negative
Flag Brands & Relative Importance
Custom coding
Engagement
5
UNIQUE BLA VALUE
1. Evaluate the Entire Conversation
2. Account for Context
3. Adapt to Industry Language, Terms
4. Adjust to Channel Communication (Facebook, Twitter, specialist forums, blogs)
Leveraging social media is about building a
metric based on linguistics principles
Teasing out the nuances of language
Transitional
word (Shift in
Stance)
From Millions of Cleaned
social media
Conversations
Powerful social insights on Themes
and topics that are most important
to consumers.
Small Pepermint Afternoon Snack 12Pack
Great Deal Breakfast yum Large
Miss it Get me one Orange on sale
Morning Half Priced got coupon Drive Home
Vanilla Mocha 8 Oz need a hit
Small Pepermint Afternoon Snack 12Pack
Great Deal Breakfast yum Large
Miss it Get me one Orange on sale
Morning Half Priced got coupon Drive Home
Vanilla Mocha 8 Oz need a hit
We Detect Thousands of interesting
“nodes” of Consumer information
Clear Themes
and Topics of
Importance
Emerge
Advanced Analytics to help drive
content strategy and measure social
ROI.
Our Supervised Learning Pattern
Detection organizes the nodes
Adding Structure to Unstructured Data: The Solution Path For Consumer Chaos
Fusing SEITM based language
measurement with
advanced analytics to
understand competitive
brand positioning, content
drivers, reputation and
essential elements and
structure of the customer-
brand experience.
Using known tools to listen
and monitor high level
consumer brand-experience
conversations.
Measure language based
on engagement and
importance through the
Semantic Engagement
Index (SEITM).
Listening,
Monitoring and
basic Sentiment
Measuring
Language for
brand insights
Social
Media Advanced
Analytics
Social
Monetization
Applying a trended SEITM
within Media Mix
Modelling to monetise
customer-brand
experience (earned social
media) alongside all other
media and quantify any
synergistic effects.
Extend the Value of Social Media Insights
BLA Social Insights, Analytics and ROI Framework
We will focus on this
specific application of SEI
today
Available Social Media “Sentiment Metrics” fall short as a tool
for measuring ROI, but the SEITM shows great promise
-20% 0% 20% 40% 60% 80% 100%
Sentiment Metric 1
Sentiment Metric 2
Sentiment Metric 3
Sentiment Metric 4
Sentiment Metric 5
Sentiment Metric 6
SEI™ POS/NEG RATIO
11.2%
3.1%
-2.3%
8.8%
21.2%
8.2%
83.1%
Figure 1: Compares correlation to sales of $6B client with SEI and sentiment
metrics for 6 leading social data vendors, there is a wide gap.
Sentiment Metric 1
Sentiment Metric 2
Sentiment Metric 3
Sentiment Metric 4
Sentiment Metric 5
Sentiment Metric 6
SEI™ POS/NEG RATIO
The correlation* to sales over time shows the SEI™ has Predictive Power
9
SEI validation: four categories
Correlation = 86%
Correlation = 84%
Correlation = 81%
Correlation = 83%
Correlation = 83%
*Lead lag analysis has confirmed that causation is only one way – the SEI™ to a large degree is able to
drive hard commercial metrics.
SEI validation across ~ 20 diverse brands, both US and international.
Validated more than any other social metric
52%
53%
56%
57%
59%
68%
73%
74%
77%
79%
79%
79%
79%
81%
81%
84%
86%
86%
88%
0% 10% 20% 30% 40% 50% 60% 70% 80% 90% 100%
Haircare Brand
Personal Care Brand 4
Personal Care Brand 3
Personal Care Brand 2
Personal Care Brand 1
DIY Retailer Brand 2
AVERAGE
Business Services
Hospitality Brand 2
Restaurant Brand 3
Cosmetic Brand
Hospitality Brand 1
Softdrink
Restaurant Brand 2
DIY Retailer Brand 1
Restaurant Brand 1
Telecom Brand
Movie 1
Movie 2
SEI/Sales Correlations
10
Recent Marketing-Mix Model cases
Customer experience (SEI™ earned media) as the largest sales driver
44.9%
9.1%4.0%2.2%1.8%2.3%
5.9%
29.8%
Brand Gamma Decomposition of Sales
Baseline
TV
Print
Radio
Owned Digital SEO
Paid Digital Mobile
Paid Digital Search
Customer Experience Earned
Digital Social SEI
54.1%
5.5%1.5%
4.4%
2.1%
2.8%
5.9%
23.7%
Brand Beta Decomposition of Sales
Baseline
TV
Print
Radio
Owned Digital SEO
Paid Digital Mobile
Paid Digital Search
Customer Experience Earned
Digital Social SEI
60.4%
4.5%
2.1%
3.3%
1.1%2.1%
5.3%
21.2%
Brand Alpha Decomposition of Sales
Baseline
TV
Print
Radio
Owned Digital SEO
Paid Digital Mobile
Paid Digital Search
Customer Experience Earned
Digital Social SEI
64.8%1.5%0.2%0.3%3.6%0.1%1.8%
27.8%
Brand Omega Decomposition of Sales
Baseline
TV
Print
Radio
Owned Digital SEO
Paid Digital Mobile
Paid Digital Search
Customer Experience Earned
Digital Social SEI
6Copyright 2015
Case 1: Defining the Coffee
Retailer Brand and Position
For a coffee retailer, we uncovered 26 “content drivers”, which are topical themes and
components of the SEI. We conducted CART regression analytics which arrays these
themes in order of importance for prediction of SEI. Of these 26 drivers, 18 were
beverage or food products, while 8 were topics related to the store experience. Our
findings reveal that the store experience were more important drivers than the products
and were a more important factor in defining the brand.
Insight & Outcomes
The key drivers to Positive SEI™ were:
1. A place to hang out
2. To meet people
3. Atmosphere
4. Beverage Products
The client developed a ‘2 for 1’
promotion to drive store level sales.
This was the most effective promotion
run on any product over the past 3
years, generating a lift in 3 weeks equal
to about 4% of total sales.
13
Case 2: Key Content Drivers of Retail Sales
Positive Social
Engagement
100
Place to Hang
Out
211
Place to Hang
Out
83
To Meet People
325
To Meet People
188
Atmosphere
466
Atmosphere
288
To Meet People
229
To Meet People
85
Beverage A
271
Beverage A
74
Note: Separate analysis - Classification & Regression Trees (CART)
Brand Positioning Using Socially Engaged Chatter
Meeting Friends
Hanging out
Case 2: Social Content Drivers
for Brand Positioning
Case 1: SEITM & Marketing Contributions for Zip
78.6%
2.1%
6.8%
3.3%
3.0%
2.5%
2.4%
1.9%
1.1%
0.4%
23.5%
Zip Modeled Incremental Contributions
Baseline
SEI/Mktg Synergy
SEI-Social Media
Radio
POS Signage
TV
Digital Display
Sampling
Pub.Reltns
OOH
• Zip Situation: Zip (masked name) is an “instant” beverage launched by this
beverage retailer in 2009; and was a deviation from its natural brewed products. Zip was
one of the most successful new product launches in the last dozen years. Prior modeling
had shown that Zip actually generated a +3% lift to total retail sales. The successful launch
strategy was aimed at getting maximum trial and exposure with an extensive sampling and
early price promotions. The challenge in year two is to understand how to position the
brand and sustain growth momentum.
• Zip Marketing Contributions :
By modeling Zip using SEITM, we found that
the “buzz and advocacy” stimulated by its
marketing efforts drove almost 7% of its
volume and marketing efforts also helped
boost a sizable “synergistic dividend”.
16
Case 2: Zip Brand Sales & SEITM Time Correlations
-
1.0
2.0
3.0
4.0
5.0
6.0
7.0
8.0
9.0
-
2,000,000
4,000,000
6,000,000
8,000,000
10,000,000
12,000,000
14,000,000
2/23/…
3/23/…
4/23/…
5/23/…
6/23/…
7/23/…
8/23/…
9/23/…
10/23…
11/23…
12/23…
1/23/…
2/23/…
3/23/…
4/23/…
5/23/…
6/23/…
7/23/…
8/23/…
9/23/…
10/23…
Zip Sales
Zip.SEI.Ratio
SEI Ratio Norm
17
Tracking the SEITM showed a high correlation to Zip’s first year sales. This was clear evidence of a
powerful and effective effort to generate strong buzz and advocacy toward the brand, with a
strong linkage to sales. SEITM also shows a “leading indicator” relationship to sales.
Note plotted metric is ratio of Positive to Negative SEITM
Case 2: Content Motivation Drivers of Sales Conversion for Zip Powder
18
188
3,516
103 128
300
301
350
491
724
930
-
500
1,000
1,500
2,000
2,500
3,000
3,500
4,000
BaselineNetPositiveSEI
GreatAroma
YummyFlavors
GreatGiftIdea
Convenient
TastesGreatColdorHot
TastesGreat
GreatforTakingtotheOffice
TastesLiketheRealThIng
TotalNetPositiveSEI
Zip Powder All Social Channels Engagement Content Drivers
Further analytics of the “content drivers” of SEITM consumer engagement revealed key
drivers to be “tasted like the real thing” and was great for “taking to the office” and enjoying
that original taste of the parent brand. By focusing communications towards these benefits in
year 2, Zip managed to continue a strong 11% growth.
Current
Positioning
Desired
Positioning
Case 3: Scoring and Evaluating
Sports Sponsorships
We scored SEI for the sponsorships. By investing more in NFL Football and less on NASCAR and
Basketball, this company managed to accelerate YOY growth from 3 to +8% the following year
Example: Assessing Sport Marketing ROI
(65% of marketing budget)
9
 Bottom-Line Analytics LLC is a consulting group focusing on a broad
portfolio of marketing analytics, including marketing optimization
modeling
 Our modeling experts have a total of over 100 years of direct experience
with marketing optimization modeling. This includes direct experience in over
35 countries and dozens of product categories.
 We are dedicated to the principles of innovation, excellence and
uncompromising customer service.
 Most important, however, we are dedicated to getting tangible and positive
business results for our clients.
ABOUT US
Full Service
Analytics
Capability
Social Media ROI
Marketing Mix Modelling
Pricing Optimization
Radial Landscape Mapping
Key Drivers Analysis
Demand Forecasting
Customer Satisfaction Modelling
Digital Performance Analytics Dashboards
Segmentation Analysis
22
BLA is a trusted advisor to a wide array of clients
We believe in the continuous innovative application
of analytics to advance customer centric decision
making for improved business performance.
23
BLA leadership bios
Michael Wolfeis CEO of Bottom-Line Analytics LLC in the USA. Michael has 30 years of direct
experience in marketing science and analytics both on the client and consulting side. On the former,
Michael has worked for Coca-Cola, Kraft Foods, Kellogg’s and Fisher-Price. He has also consulted
with such blue-chip firms as AT&T, McDonald’s, Coca-Cola, Hyatt Corp., L’Oreal, FedEx and Starbucks.
Michael has broad experience in marketing analytics covering marketing ROI modelling, social media
analytics, pricing research and brand strategy.
Masood Akhtar is the Bottom-Line Analytics partner in the UK and heads the company
efforts across EMEA. Masood is former Director of Analytics for McCann-Erickson and also has
worked for Mintel International Group, JWT, Costa Coffee, Coca Cola, Hyatt Corp. He is an
accomplished econometrician with extensive experience in marketing ROI analytics, marketing
research, market segmentation, social media analytics and marketing KPI dashboards.
David Weinbergeris CMO of Bottom-Line Analytics. David’s career has taken him to such
blue-chip firms as Coca-Cola, Kraft Foods, Georgia Pacific and the Home Depot. David’s consulting
experience has focused on such verticals as retailing, financial services, apparel, consumer products
and insurance. David’s has considerable expertise in the areas of customer analytics, life-time
value, shopper marketing, social media, brand strategy, segmentation and marketing ROI analytics.
23

Measuring customer experience with social media.jan15

  • 1.
    Measuring the Customer Experiencewith Social Media New Developments in Measurement and Analytics
  • 2.
    Measuring the CustomerExperience is Essential 1. It has been found the be the largest single business driver for many brands 2. Measurement of this experience is considered to be essential for firms who aspire to be “customer centric”.
  • 3.
    Millions of socialmedia comments, all reflecting real brand- customer experiences. As Jeff Bezos said: “Your brand is what people say about you when you’re not in the room.” United Airlines is never on-time and their service sucks I love drinking Coke with pizza! My iPhone is an essential part of my life! Progressive has the cheapest insurance but their claims service Is terrible! I bought a Maytag at Lowe’s and it cleans like no other My Honda CRV is great on gas economy! For health reasons I have cut back on Diet Coke The Porsche 911 Is the sexiest car on the planet! I keep getting dropped calls on the Sprint network! I love how my son plays with his Lego blocks
  • 4.
    A Unique Wayto Mine Social Conversations 4 Stance Shift Syntax & Structure Tonality & Sentiment Experiential Statement Custom Dictionary Context Personal Emotional Customer Experience • Leverages 30+ rules of language through a ‘scoring algorithm’ that turns textual data into a scaled metric called the Semantic Engagement Index (SEITM) • Is built upon a validated Linguistics approach known as ‘Stance Shift Analysis’ • Takes into account several critical components of conversations usually ignored • Captures and measures the value of the customer experience • Links closely to sales - represents brand health • Uncovers the Why’s and the underlying drivers both positive and negative
  • 5.
    I just gotmy cool new iPhone from BestBuy, however, I keep getting dropped calls on the Brand X 4G network Positive Negative Flag Brands & Relative Importance Custom coding Engagement 5 UNIQUE BLA VALUE 1. Evaluate the Entire Conversation 2. Account for Context 3. Adapt to Industry Language, Terms 4. Adjust to Channel Communication (Facebook, Twitter, specialist forums, blogs) Leveraging social media is about building a metric based on linguistics principles Teasing out the nuances of language Transitional word (Shift in Stance)
  • 6.
    From Millions ofCleaned social media Conversations Powerful social insights on Themes and topics that are most important to consumers. Small Pepermint Afternoon Snack 12Pack Great Deal Breakfast yum Large Miss it Get me one Orange on sale Morning Half Priced got coupon Drive Home Vanilla Mocha 8 Oz need a hit Small Pepermint Afternoon Snack 12Pack Great Deal Breakfast yum Large Miss it Get me one Orange on sale Morning Half Priced got coupon Drive Home Vanilla Mocha 8 Oz need a hit We Detect Thousands of interesting “nodes” of Consumer information Clear Themes and Topics of Importance Emerge Advanced Analytics to help drive content strategy and measure social ROI. Our Supervised Learning Pattern Detection organizes the nodes Adding Structure to Unstructured Data: The Solution Path For Consumer Chaos
  • 7.
    Fusing SEITM basedlanguage measurement with advanced analytics to understand competitive brand positioning, content drivers, reputation and essential elements and structure of the customer- brand experience. Using known tools to listen and monitor high level consumer brand-experience conversations. Measure language based on engagement and importance through the Semantic Engagement Index (SEITM). Listening, Monitoring and basic Sentiment Measuring Language for brand insights Social Media Advanced Analytics Social Monetization Applying a trended SEITM within Media Mix Modelling to monetise customer-brand experience (earned social media) alongside all other media and quantify any synergistic effects. Extend the Value of Social Media Insights BLA Social Insights, Analytics and ROI Framework We will focus on this specific application of SEI today
  • 8.
    Available Social Media“Sentiment Metrics” fall short as a tool for measuring ROI, but the SEITM shows great promise -20% 0% 20% 40% 60% 80% 100% Sentiment Metric 1 Sentiment Metric 2 Sentiment Metric 3 Sentiment Metric 4 Sentiment Metric 5 Sentiment Metric 6 SEI™ POS/NEG RATIO 11.2% 3.1% -2.3% 8.8% 21.2% 8.2% 83.1% Figure 1: Compares correlation to sales of $6B client with SEI and sentiment metrics for 6 leading social data vendors, there is a wide gap. Sentiment Metric 1 Sentiment Metric 2 Sentiment Metric 3 Sentiment Metric 4 Sentiment Metric 5 Sentiment Metric 6 SEI™ POS/NEG RATIO
  • 9.
    The correlation* tosales over time shows the SEI™ has Predictive Power 9 SEI validation: four categories Correlation = 86% Correlation = 84% Correlation = 81% Correlation = 83% Correlation = 83% *Lead lag analysis has confirmed that causation is only one way – the SEI™ to a large degree is able to drive hard commercial metrics.
  • 10.
    SEI validation across~ 20 diverse brands, both US and international. Validated more than any other social metric 52% 53% 56% 57% 59% 68% 73% 74% 77% 79% 79% 79% 79% 81% 81% 84% 86% 86% 88% 0% 10% 20% 30% 40% 50% 60% 70% 80% 90% 100% Haircare Brand Personal Care Brand 4 Personal Care Brand 3 Personal Care Brand 2 Personal Care Brand 1 DIY Retailer Brand 2 AVERAGE Business Services Hospitality Brand 2 Restaurant Brand 3 Cosmetic Brand Hospitality Brand 1 Softdrink Restaurant Brand 2 DIY Retailer Brand 1 Restaurant Brand 1 Telecom Brand Movie 1 Movie 2 SEI/Sales Correlations 10
  • 11.
    Recent Marketing-Mix Modelcases Customer experience (SEI™ earned media) as the largest sales driver 44.9% 9.1%4.0%2.2%1.8%2.3% 5.9% 29.8% Brand Gamma Decomposition of Sales Baseline TV Print Radio Owned Digital SEO Paid Digital Mobile Paid Digital Search Customer Experience Earned Digital Social SEI 54.1% 5.5%1.5% 4.4% 2.1% 2.8% 5.9% 23.7% Brand Beta Decomposition of Sales Baseline TV Print Radio Owned Digital SEO Paid Digital Mobile Paid Digital Search Customer Experience Earned Digital Social SEI 60.4% 4.5% 2.1% 3.3% 1.1%2.1% 5.3% 21.2% Brand Alpha Decomposition of Sales Baseline TV Print Radio Owned Digital SEO Paid Digital Mobile Paid Digital Search Customer Experience Earned Digital Social SEI 64.8%1.5%0.2%0.3%3.6%0.1%1.8% 27.8% Brand Omega Decomposition of Sales Baseline TV Print Radio Owned Digital SEO Paid Digital Mobile Paid Digital Search Customer Experience Earned Digital Social SEI 6Copyright 2015
  • 12.
    Case 1: Definingthe Coffee Retailer Brand and Position
  • 13.
    For a coffeeretailer, we uncovered 26 “content drivers”, which are topical themes and components of the SEI. We conducted CART regression analytics which arrays these themes in order of importance for prediction of SEI. Of these 26 drivers, 18 were beverage or food products, while 8 were topics related to the store experience. Our findings reveal that the store experience were more important drivers than the products and were a more important factor in defining the brand. Insight & Outcomes The key drivers to Positive SEI™ were: 1. A place to hang out 2. To meet people 3. Atmosphere 4. Beverage Products The client developed a ‘2 for 1’ promotion to drive store level sales. This was the most effective promotion run on any product over the past 3 years, generating a lift in 3 weeks equal to about 4% of total sales. 13 Case 2: Key Content Drivers of Retail Sales Positive Social Engagement 100 Place to Hang Out 211 Place to Hang Out 83 To Meet People 325 To Meet People 188 Atmosphere 466 Atmosphere 288 To Meet People 229 To Meet People 85 Beverage A 271 Beverage A 74 Note: Separate analysis - Classification & Regression Trees (CART)
  • 14.
    Brand Positioning UsingSocially Engaged Chatter Meeting Friends Hanging out
  • 15.
    Case 2: SocialContent Drivers for Brand Positioning
  • 16.
    Case 1: SEITM& Marketing Contributions for Zip 78.6% 2.1% 6.8% 3.3% 3.0% 2.5% 2.4% 1.9% 1.1% 0.4% 23.5% Zip Modeled Incremental Contributions Baseline SEI/Mktg Synergy SEI-Social Media Radio POS Signage TV Digital Display Sampling Pub.Reltns OOH • Zip Situation: Zip (masked name) is an “instant” beverage launched by this beverage retailer in 2009; and was a deviation from its natural brewed products. Zip was one of the most successful new product launches in the last dozen years. Prior modeling had shown that Zip actually generated a +3% lift to total retail sales. The successful launch strategy was aimed at getting maximum trial and exposure with an extensive sampling and early price promotions. The challenge in year two is to understand how to position the brand and sustain growth momentum. • Zip Marketing Contributions : By modeling Zip using SEITM, we found that the “buzz and advocacy” stimulated by its marketing efforts drove almost 7% of its volume and marketing efforts also helped boost a sizable “synergistic dividend”. 16
  • 17.
    Case 2: ZipBrand Sales & SEITM Time Correlations - 1.0 2.0 3.0 4.0 5.0 6.0 7.0 8.0 9.0 - 2,000,000 4,000,000 6,000,000 8,000,000 10,000,000 12,000,000 14,000,000 2/23/… 3/23/… 4/23/… 5/23/… 6/23/… 7/23/… 8/23/… 9/23/… 10/23… 11/23… 12/23… 1/23/… 2/23/… 3/23/… 4/23/… 5/23/… 6/23/… 7/23/… 8/23/… 9/23/… 10/23… Zip Sales Zip.SEI.Ratio SEI Ratio Norm 17 Tracking the SEITM showed a high correlation to Zip’s first year sales. This was clear evidence of a powerful and effective effort to generate strong buzz and advocacy toward the brand, with a strong linkage to sales. SEITM also shows a “leading indicator” relationship to sales. Note plotted metric is ratio of Positive to Negative SEITM
  • 18.
    Case 2: ContentMotivation Drivers of Sales Conversion for Zip Powder 18 188 3,516 103 128 300 301 350 491 724 930 - 500 1,000 1,500 2,000 2,500 3,000 3,500 4,000 BaselineNetPositiveSEI GreatAroma YummyFlavors GreatGiftIdea Convenient TastesGreatColdorHot TastesGreat GreatforTakingtotheOffice TastesLiketheRealThIng TotalNetPositiveSEI Zip Powder All Social Channels Engagement Content Drivers Further analytics of the “content drivers” of SEITM consumer engagement revealed key drivers to be “tasted like the real thing” and was great for “taking to the office” and enjoying that original taste of the parent brand. By focusing communications towards these benefits in year 2, Zip managed to continue a strong 11% growth. Current Positioning Desired Positioning
  • 19.
    Case 3: Scoringand Evaluating Sports Sponsorships
  • 20.
    We scored SEIfor the sponsorships. By investing more in NFL Football and less on NASCAR and Basketball, this company managed to accelerate YOY growth from 3 to +8% the following year Example: Assessing Sport Marketing ROI (65% of marketing budget) 9
  • 21.
     Bottom-Line AnalyticsLLC is a consulting group focusing on a broad portfolio of marketing analytics, including marketing optimization modeling  Our modeling experts have a total of over 100 years of direct experience with marketing optimization modeling. This includes direct experience in over 35 countries and dozens of product categories.  We are dedicated to the principles of innovation, excellence and uncompromising customer service.  Most important, however, we are dedicated to getting tangible and positive business results for our clients. ABOUT US
  • 22.
    Full Service Analytics Capability Social MediaROI Marketing Mix Modelling Pricing Optimization Radial Landscape Mapping Key Drivers Analysis Demand Forecasting Customer Satisfaction Modelling Digital Performance Analytics Dashboards Segmentation Analysis 22 BLA is a trusted advisor to a wide array of clients We believe in the continuous innovative application of analytics to advance customer centric decision making for improved business performance.
  • 23.
    23 BLA leadership bios MichaelWolfeis CEO of Bottom-Line Analytics LLC in the USA. Michael has 30 years of direct experience in marketing science and analytics both on the client and consulting side. On the former, Michael has worked for Coca-Cola, Kraft Foods, Kellogg’s and Fisher-Price. He has also consulted with such blue-chip firms as AT&T, McDonald’s, Coca-Cola, Hyatt Corp., L’Oreal, FedEx and Starbucks. Michael has broad experience in marketing analytics covering marketing ROI modelling, social media analytics, pricing research and brand strategy. Masood Akhtar is the Bottom-Line Analytics partner in the UK and heads the company efforts across EMEA. Masood is former Director of Analytics for McCann-Erickson and also has worked for Mintel International Group, JWT, Costa Coffee, Coca Cola, Hyatt Corp. He is an accomplished econometrician with extensive experience in marketing ROI analytics, marketing research, market segmentation, social media analytics and marketing KPI dashboards. David Weinbergeris CMO of Bottom-Line Analytics. David’s career has taken him to such blue-chip firms as Coca-Cola, Kraft Foods, Georgia Pacific and the Home Depot. David’s consulting experience has focused on such verticals as retailing, financial services, apparel, consumer products and insurance. David’s has considerable expertise in the areas of customer analytics, life-time value, shopper marketing, social media, brand strategy, segmentation and marketing ROI analytics. 23