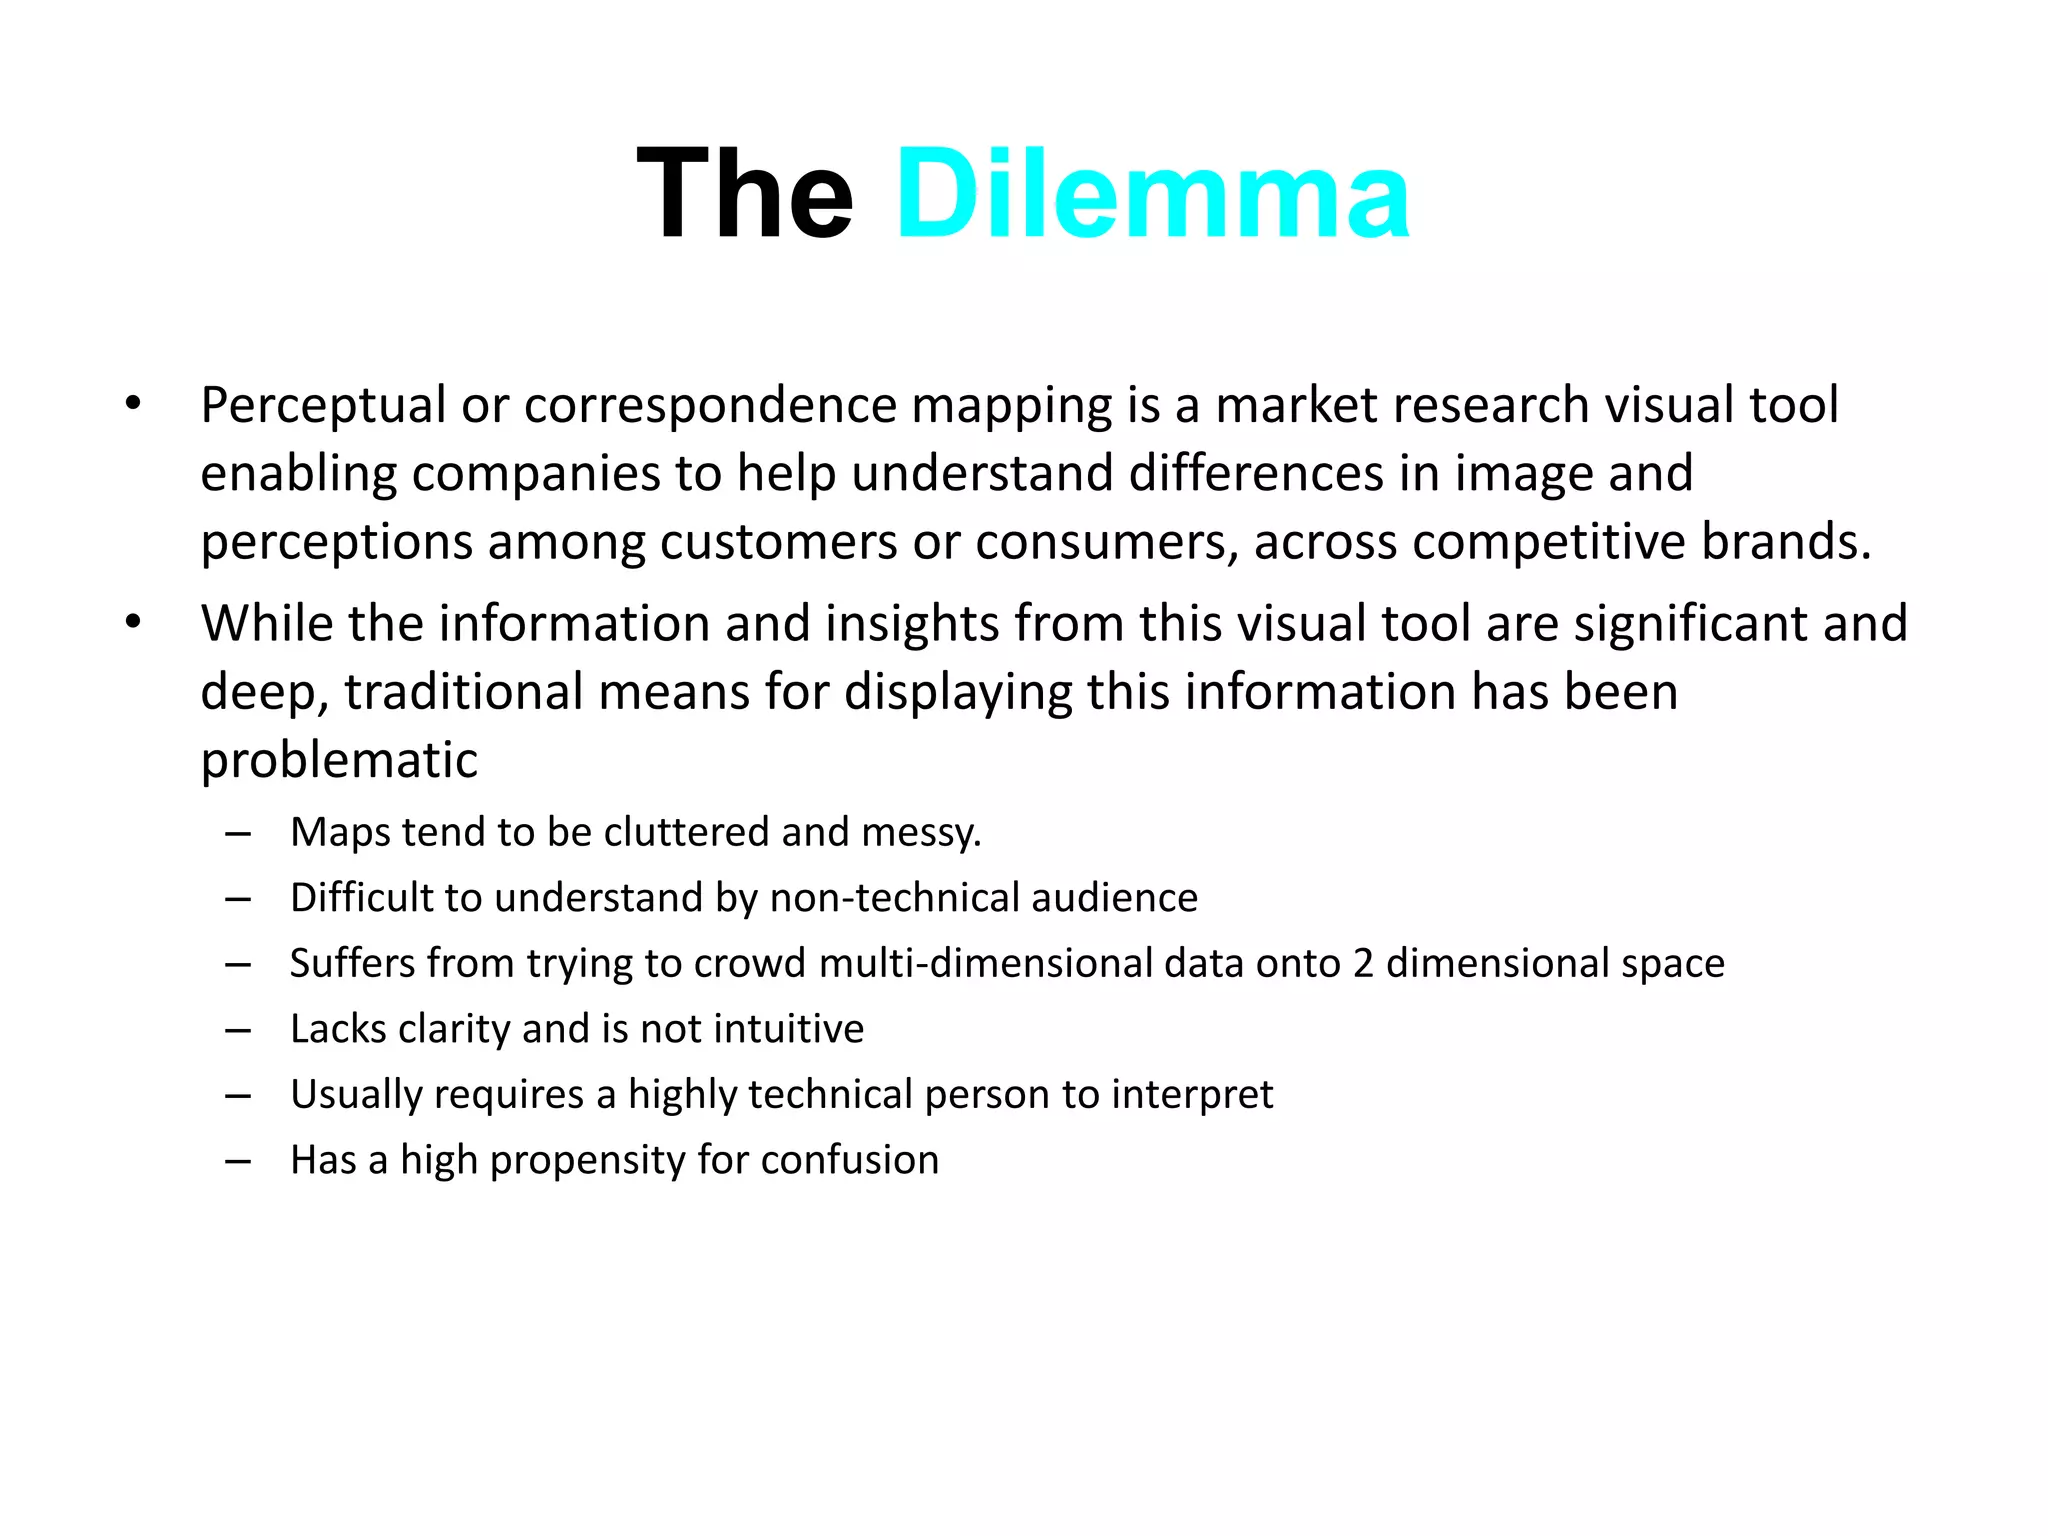
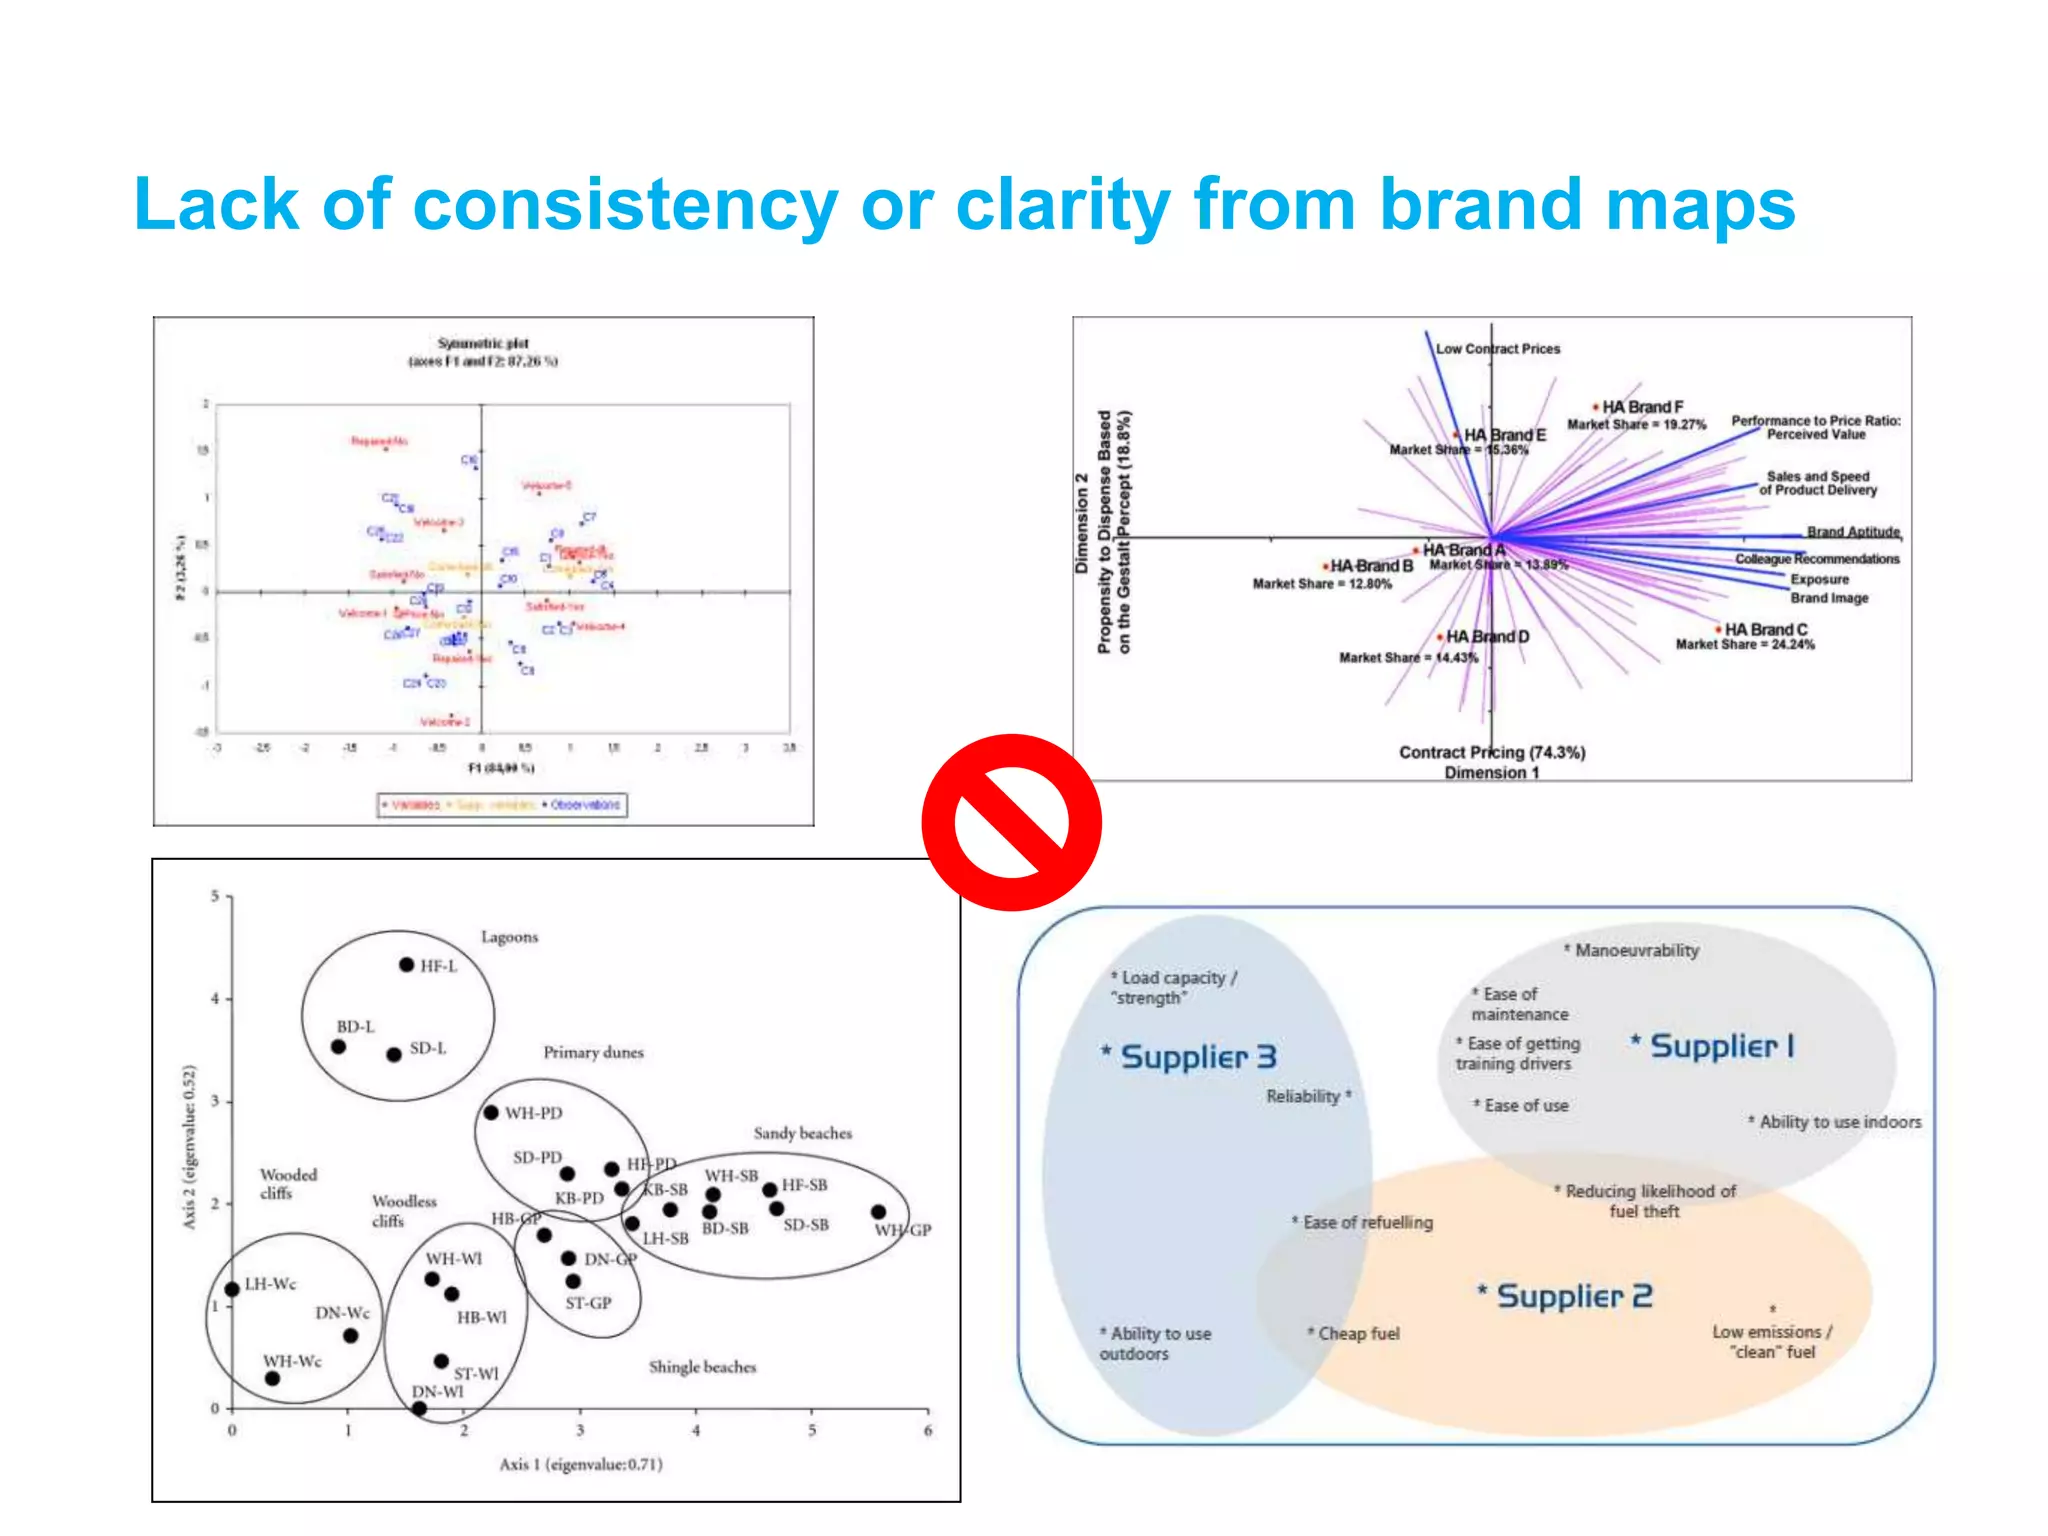
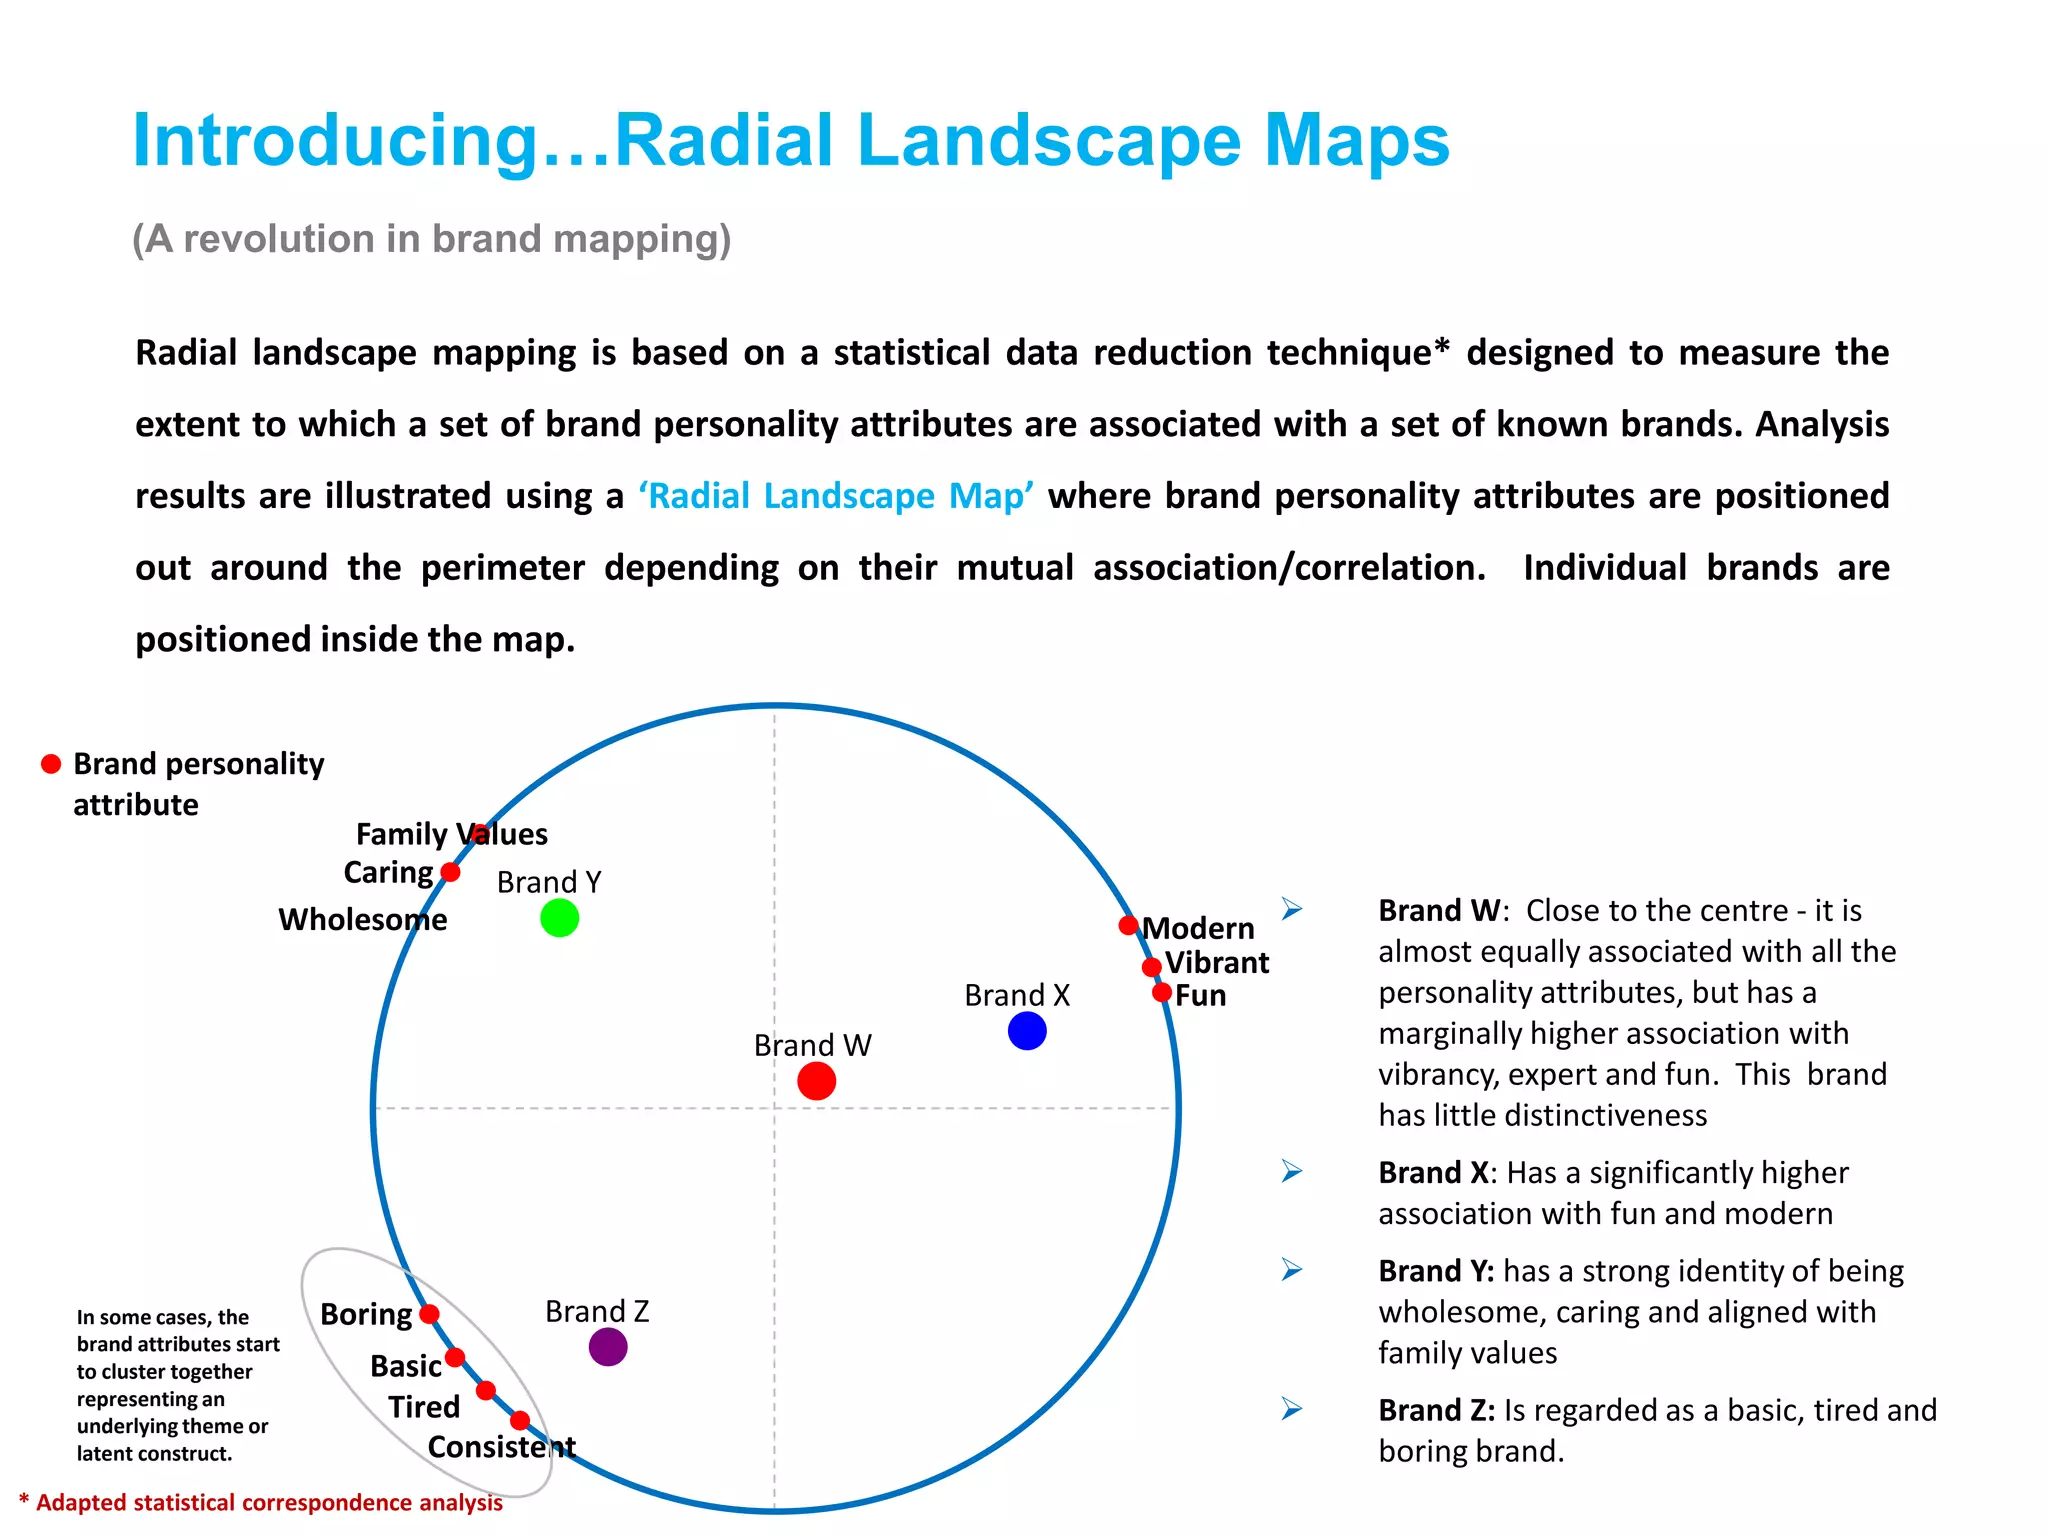
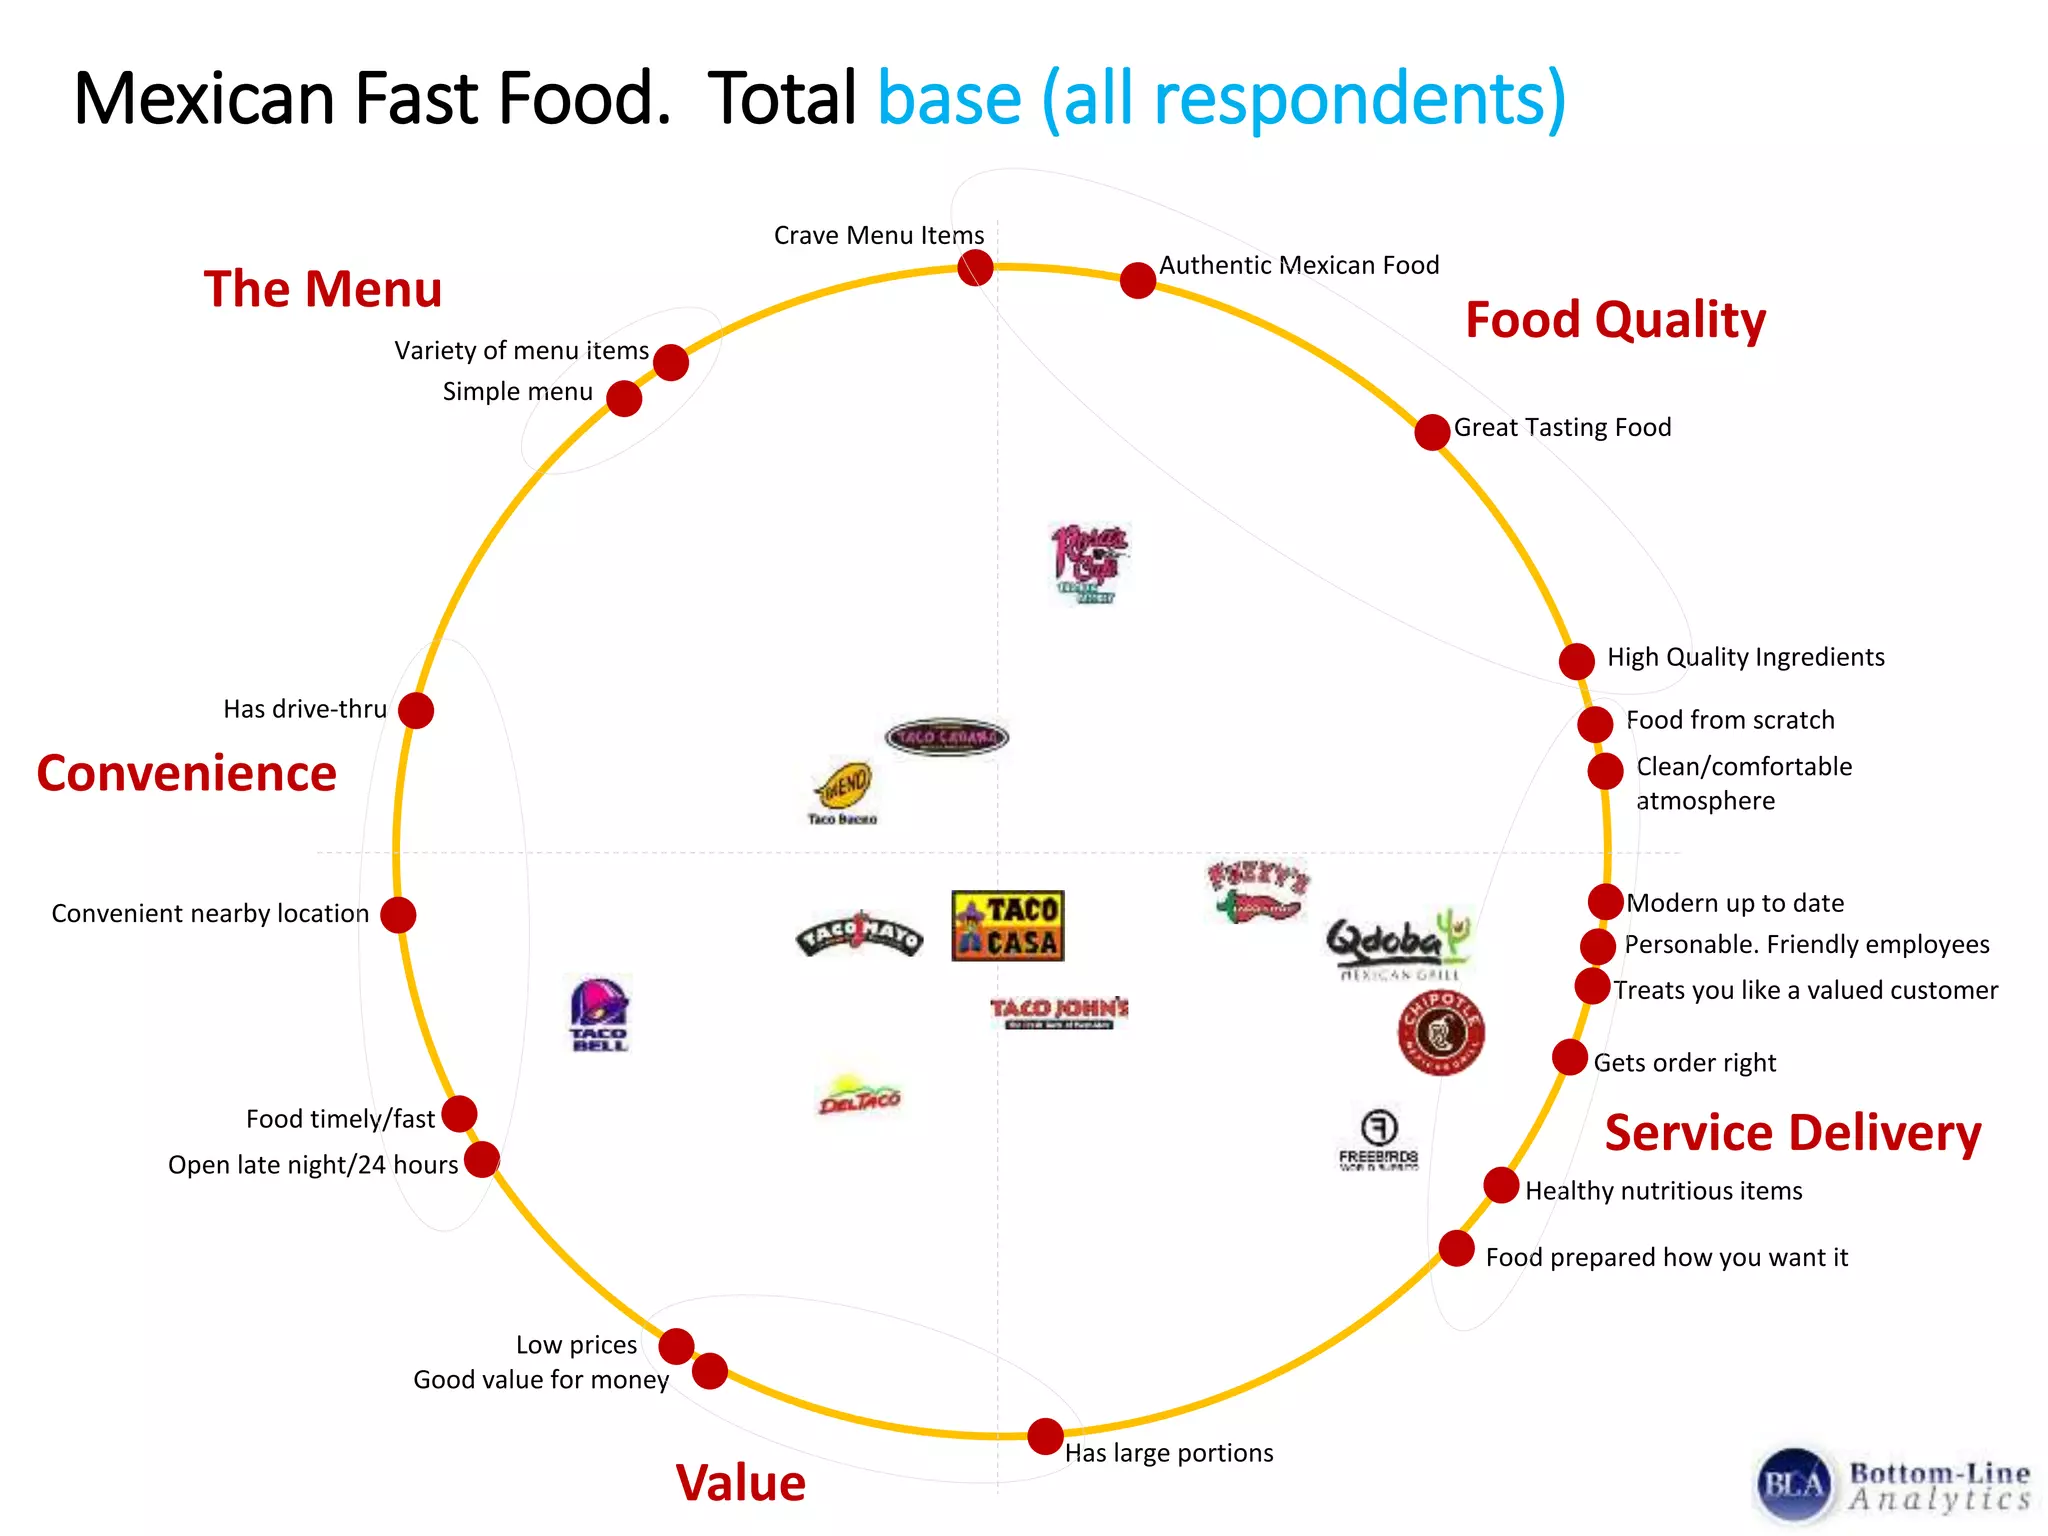
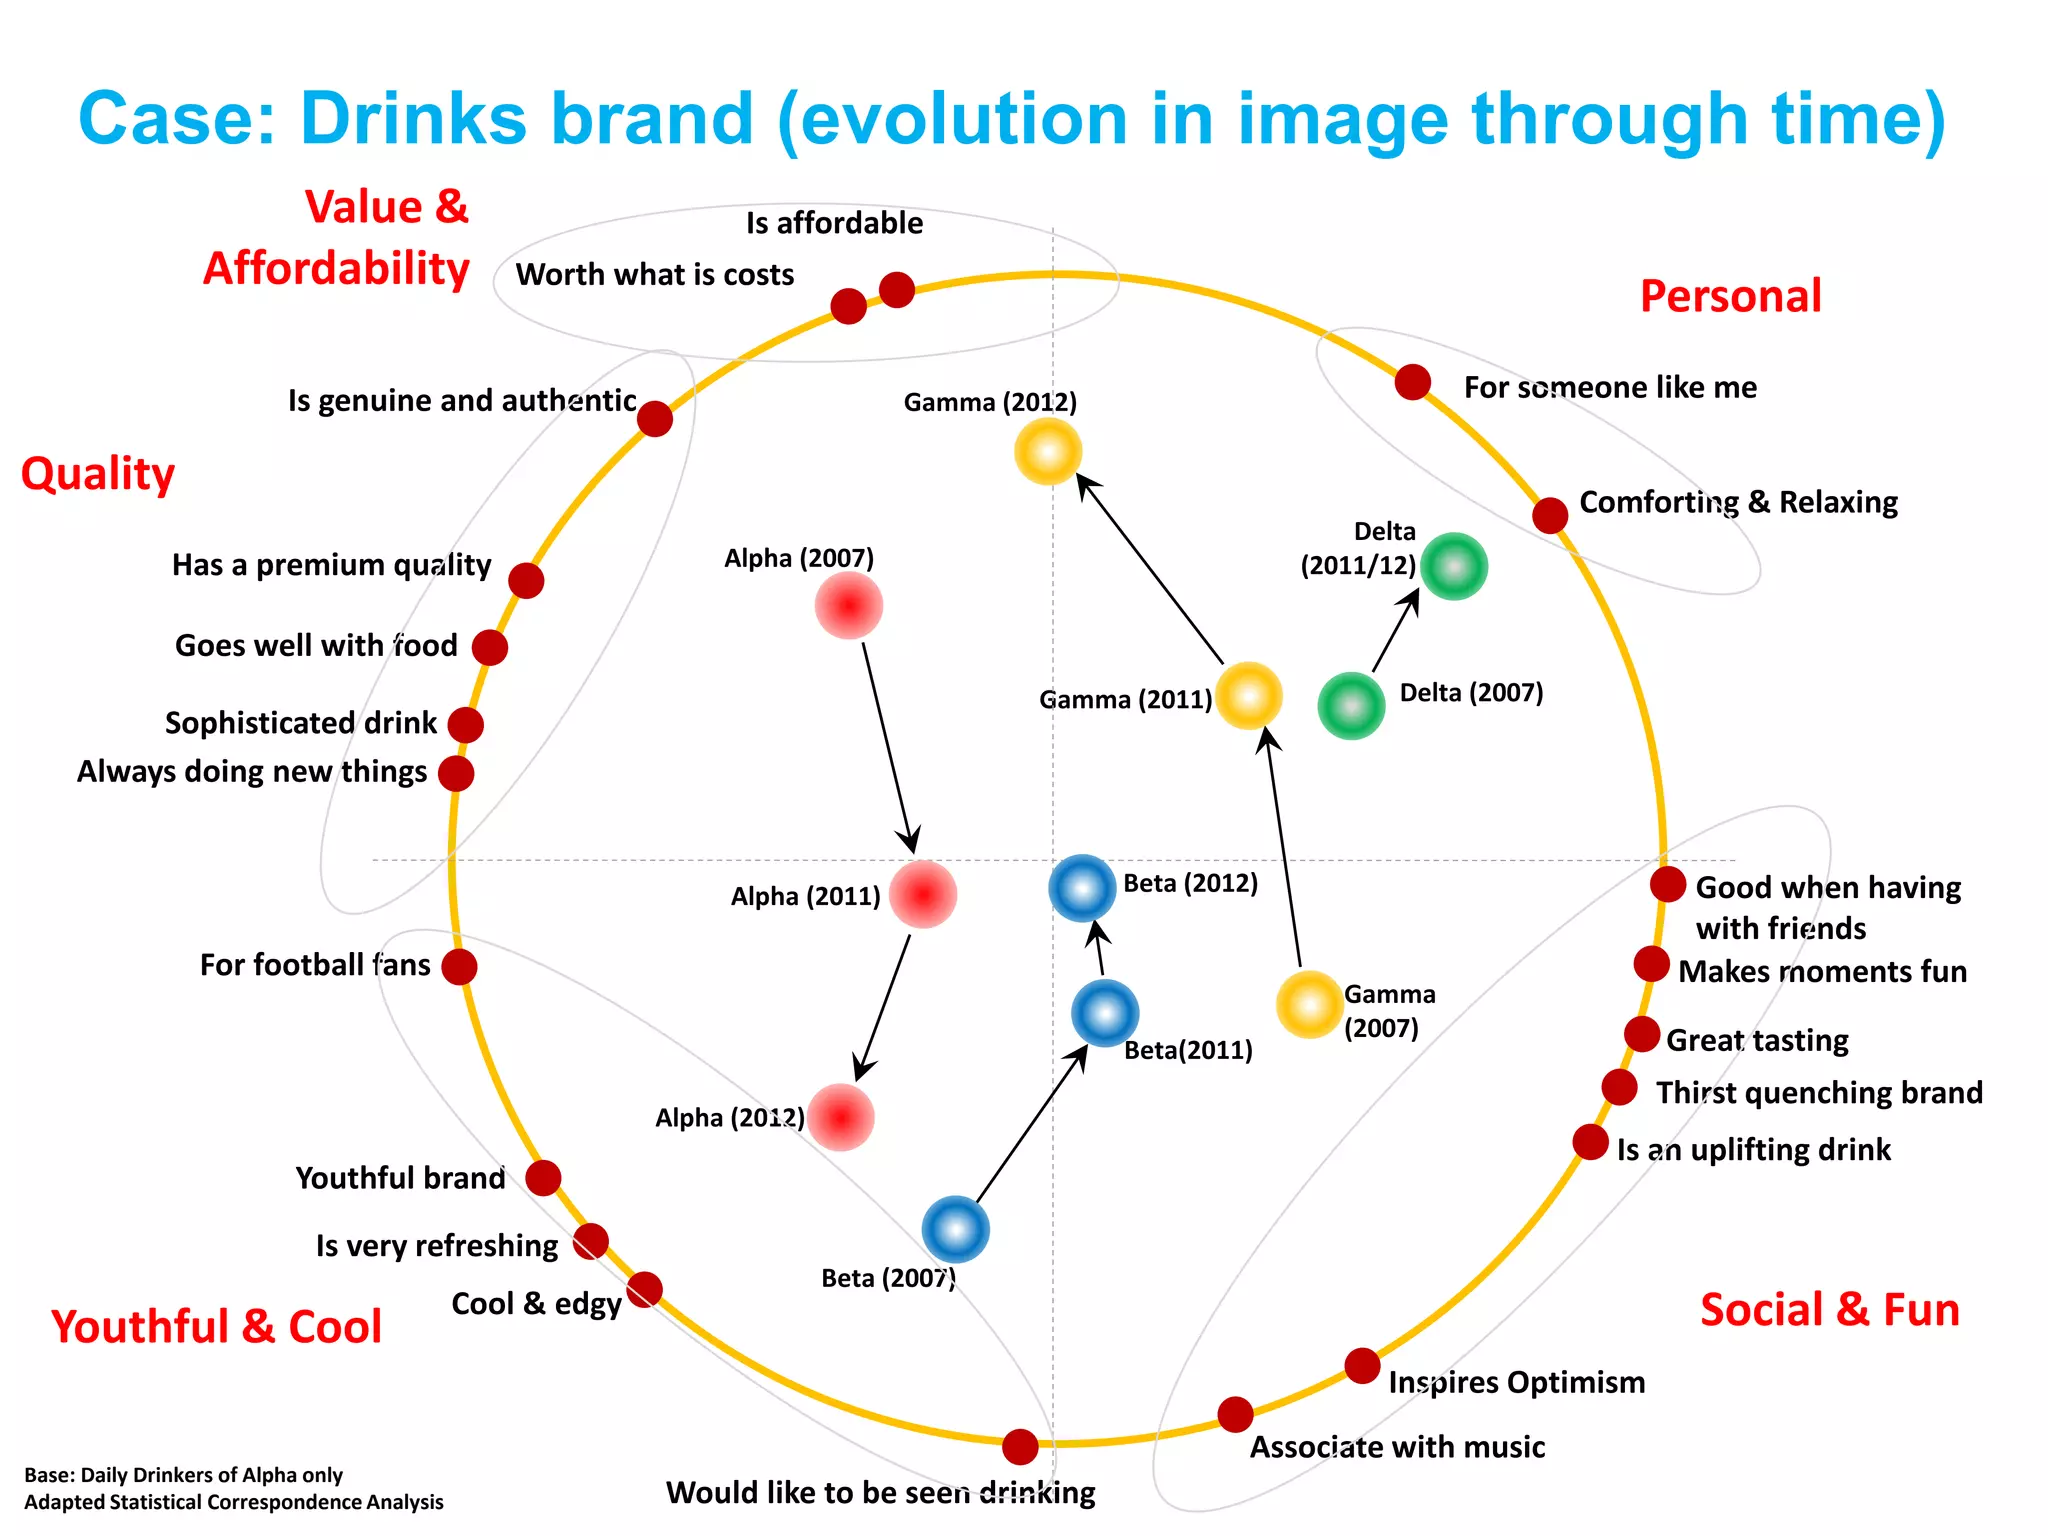
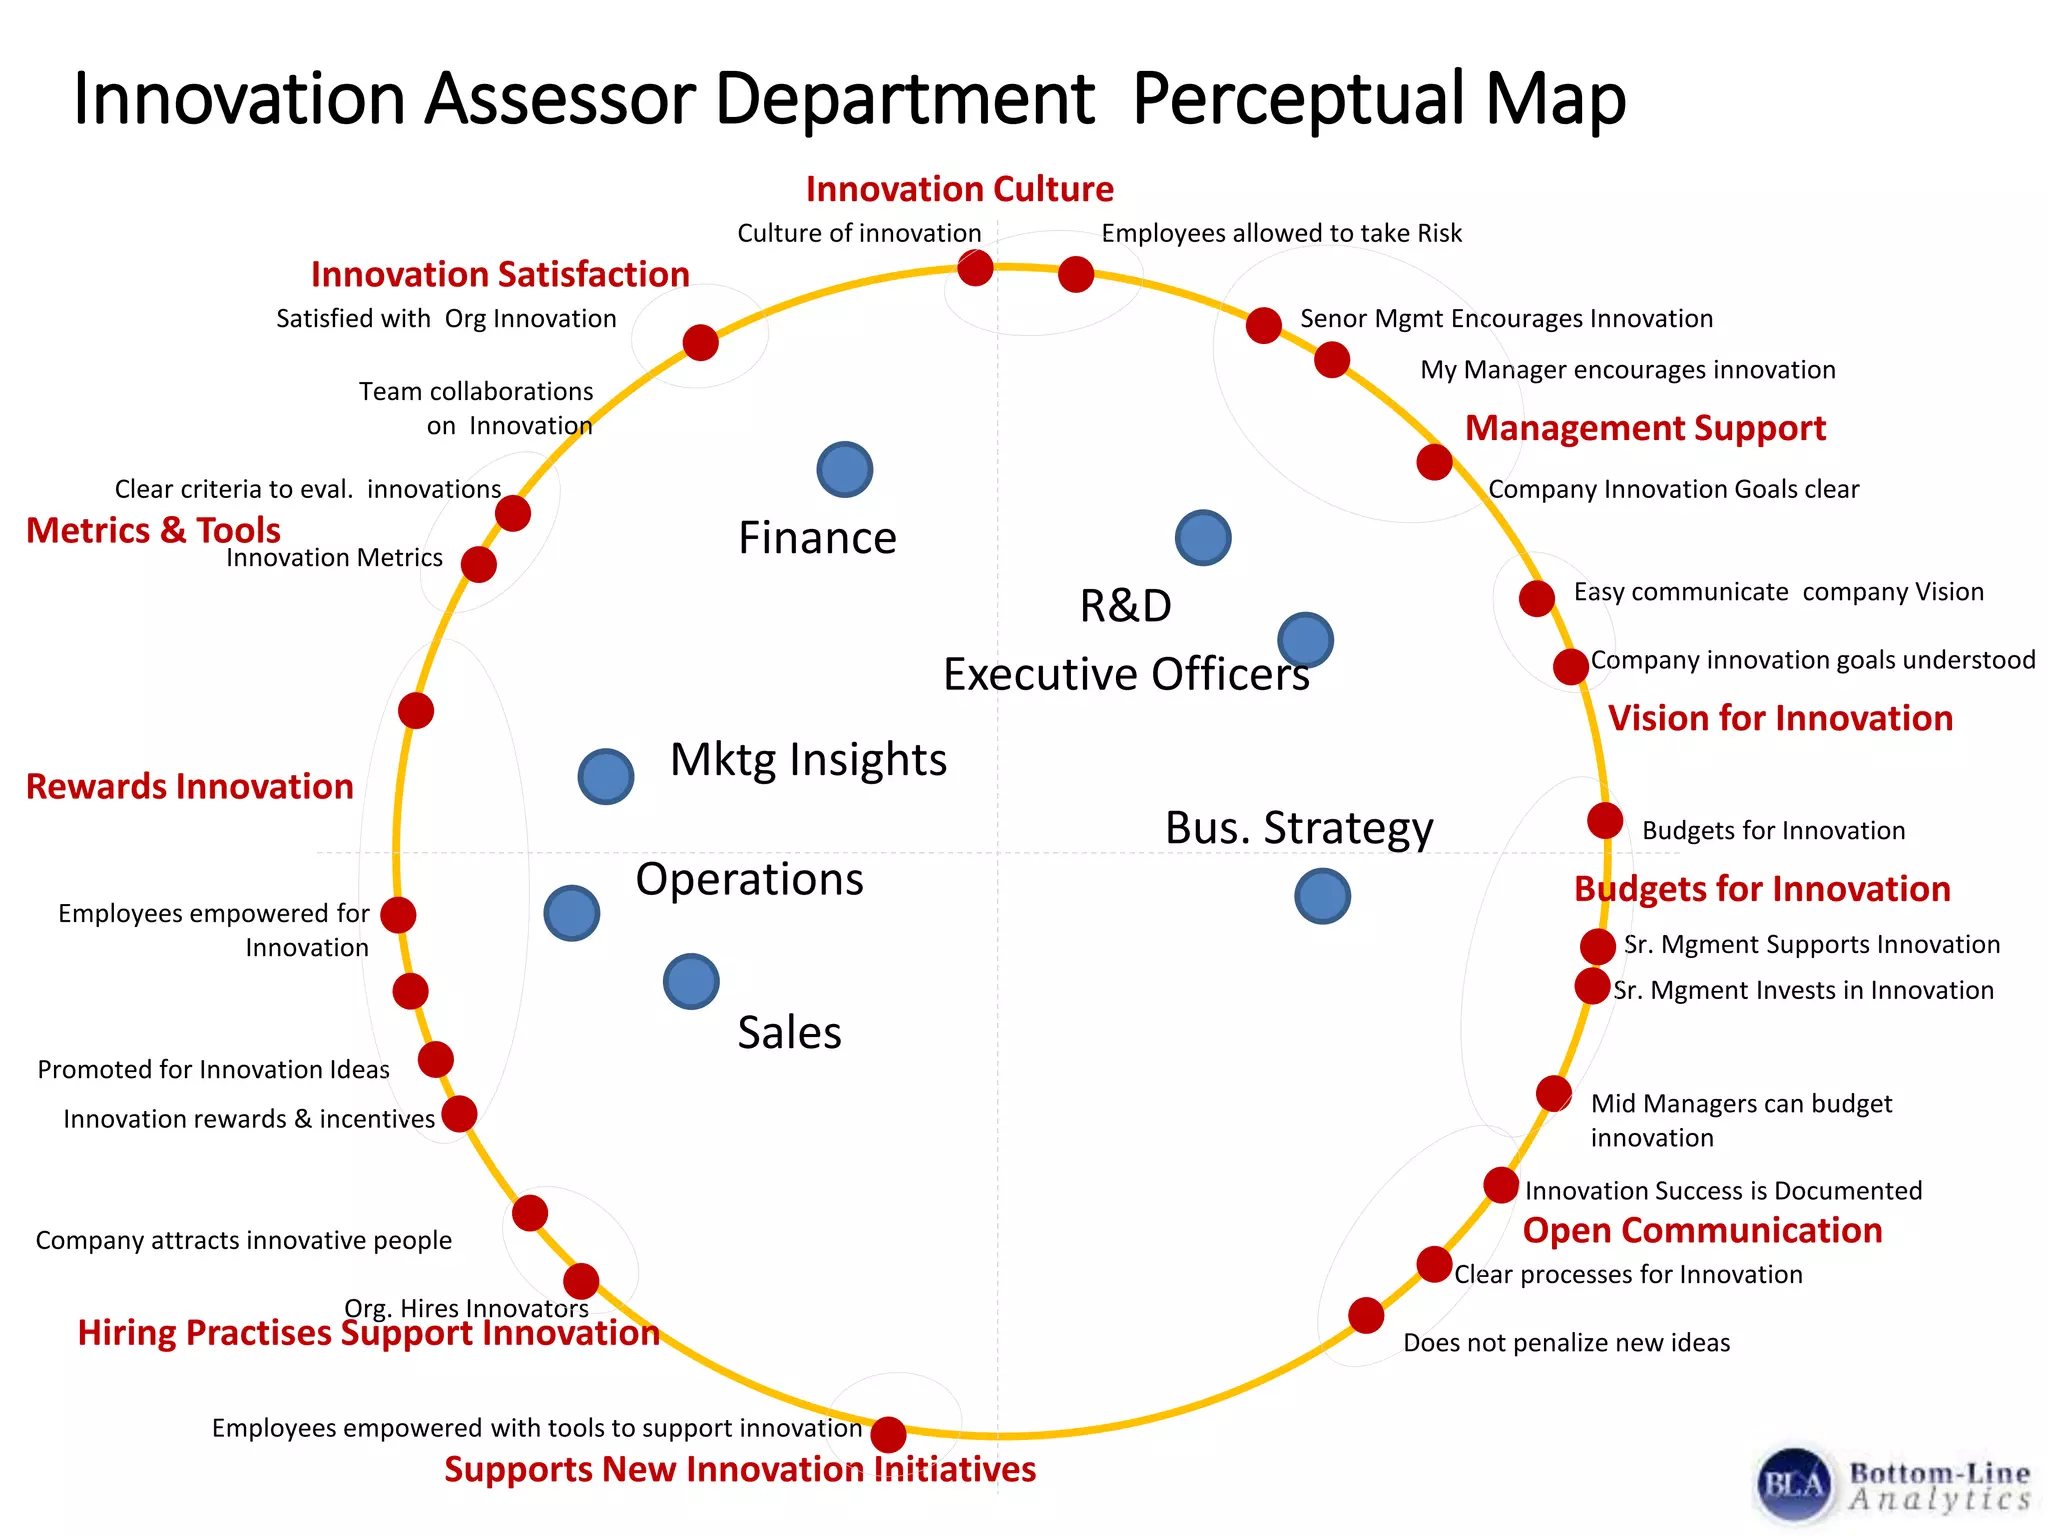
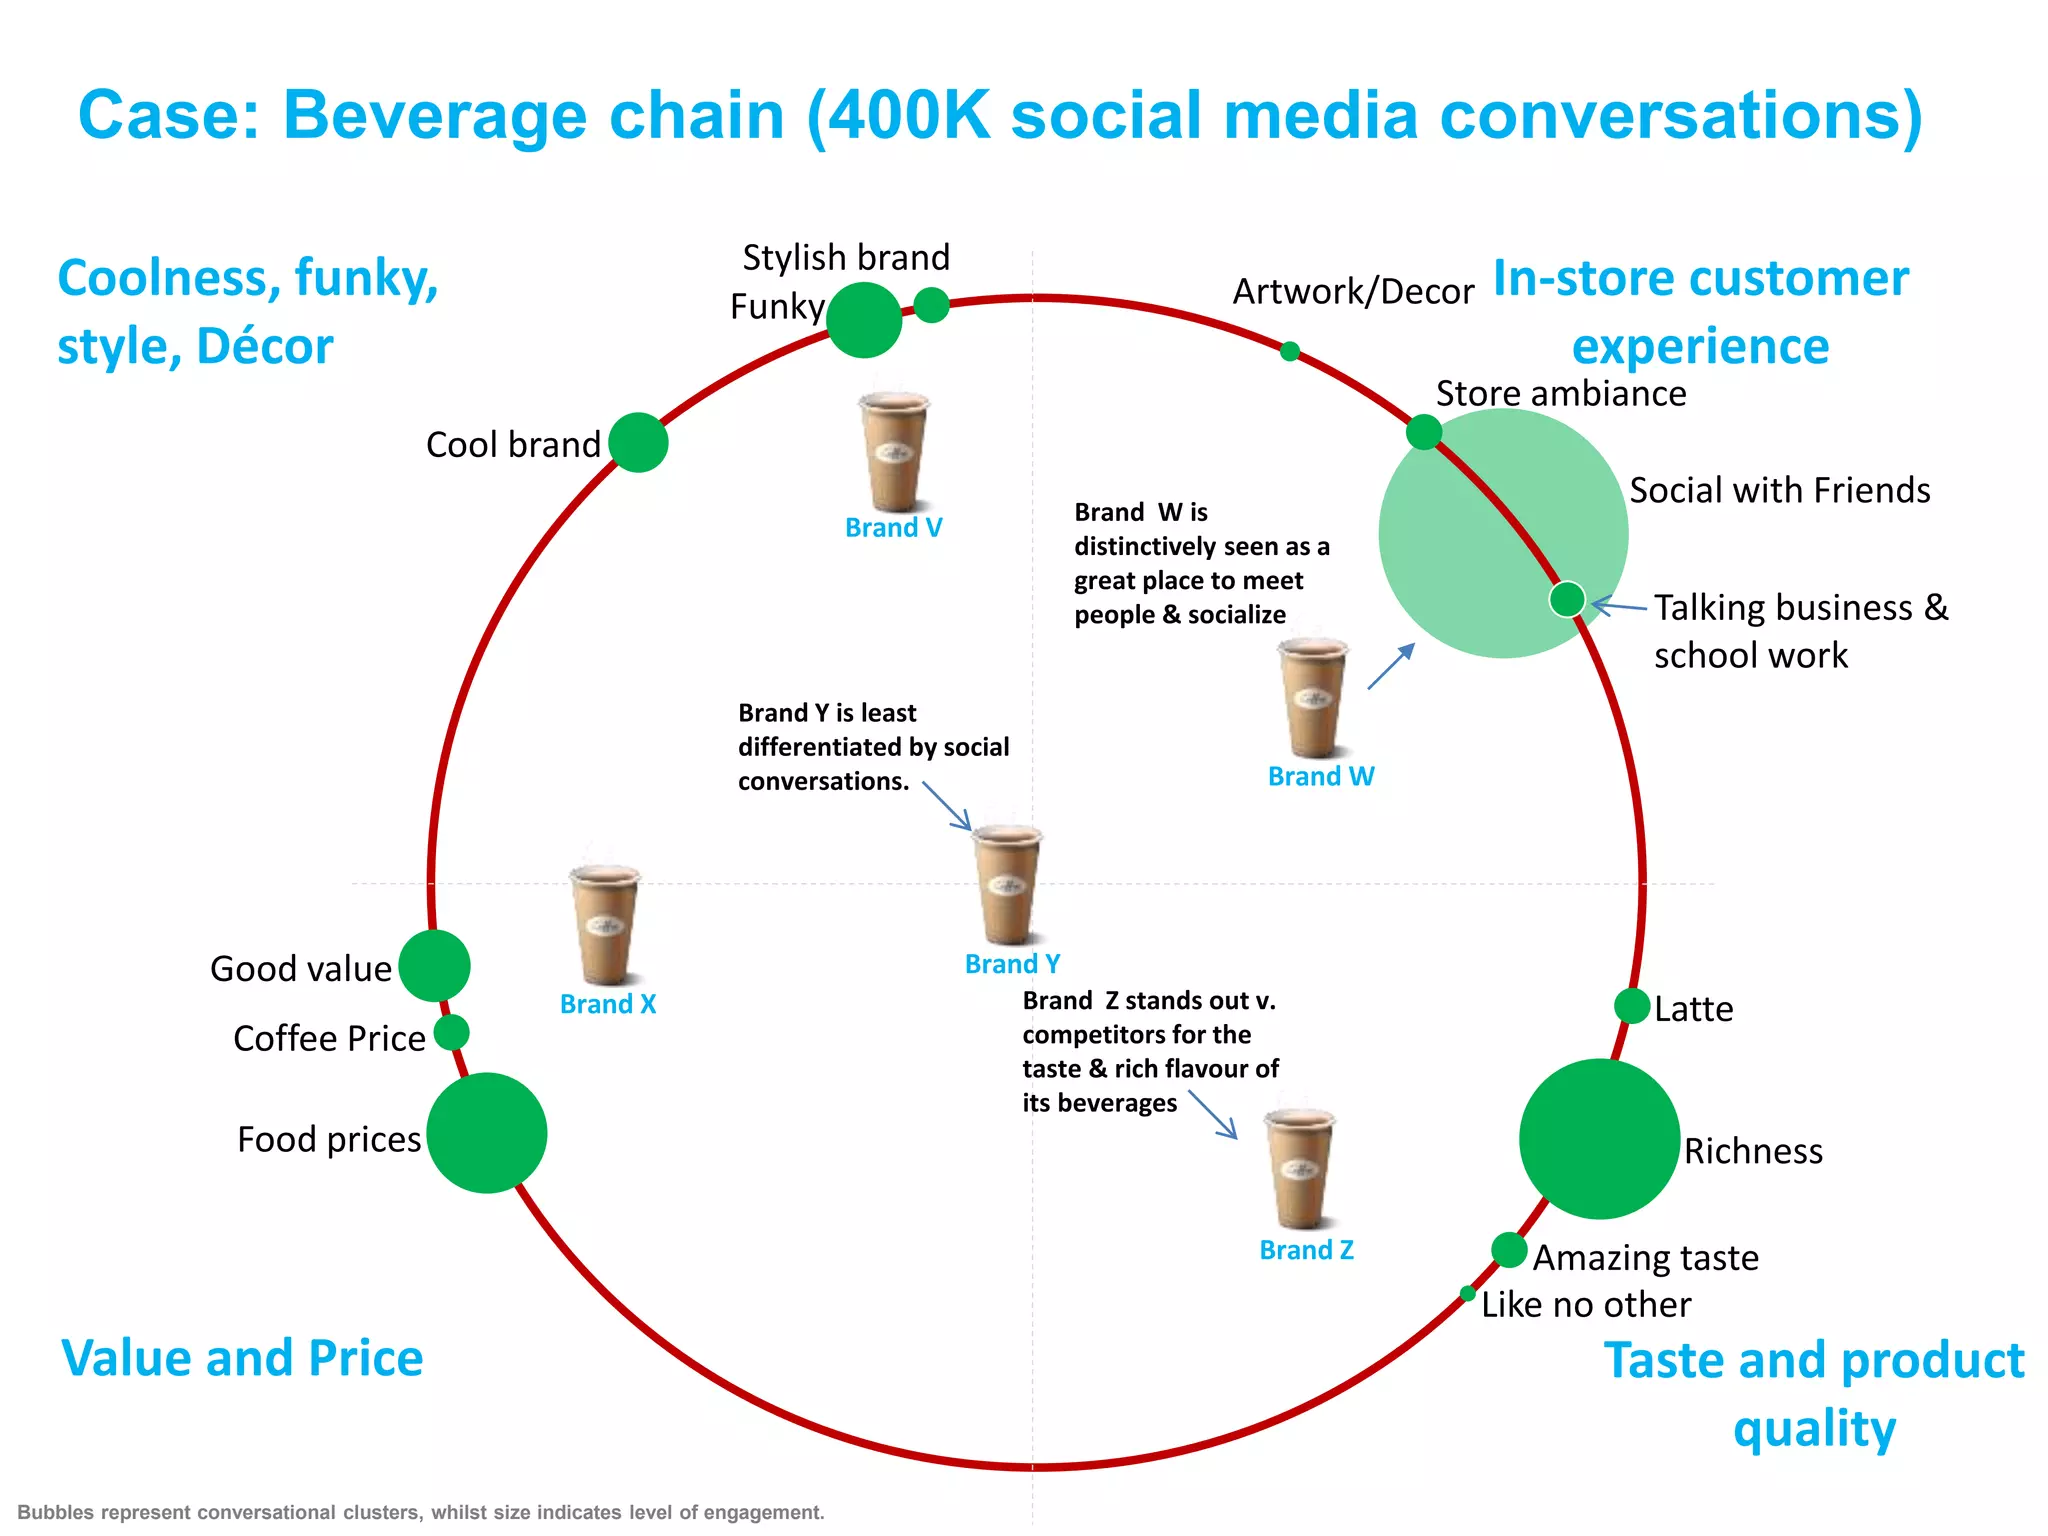
Radial Landscape
Mapping
An Innovation in brand perceptual
mapping & brand positioning
The Destination
The Dilemma
• Perceptual or correspondence mapping is a market research visual tool
enabling companies to help understand differences in image and
perceptions among customers or consumers, across competitive brands.
• While the information and insights from this visual tool are significant and
deep, traditional means for displaying this information has been
problematic
– Maps tend to be cluttered and messy.
– Difficult to understand by non-technical audience
– Suffers from trying to crowd multi-dimensional data onto 2 dimensional space
– Lacks clarity and is not intuitive
– Usually requires a highly technical person to interpret
– Has a high propensity for confusion
Lack of consistency or clarity from brand maps
Radial landscape mapping is based on a statistical data reduction technique* designed to measure the
extent to which a set of brand personality attributes are associated with a set of known brands. Analysis
results are illustrated using a ‘Radial Landscape Map’ where brand personality attributes are positioned
out around the perimeter depending on their mutual association/correlation. Individual brands are
positioned inside the map.
Introducing…Radial Landscape Maps
(A revolution in brand mapping)
* Adapted statistical correspondence analysis
Brand personality
attribute
Fun
Family Values
Modern
Brand X
Brand YCaring
Brand ZBoring
Basic
Consistent
Tired
Brand W
In some cases, the
brand attributes start
to cluster together
representing an
underlying theme or
latent construct.
 Brand W: Close to the centre - it is
almost equally associated with all the
personality attributes, but has a
marginally higher association with
vibrancy, expert and fun. This brand
has little distinctiveness
 Brand X: Has a significantly higher
association with fun and modern
 Brand Y: has a strong identity of being
wholesome, caring and aligned with
family values
 Brand Z: Is regarded as a basic, tired and
boring brand.
Vibrant
Wholesome
Conventional Cases using ATU survey trackers
• How Mexican restaurants are positioned relative to KPI’s Food
Quality, Menu, Service & Delivery, Value and Convenience
• How consumer perceptions of different detergent brands in
the UK differ from each other
• Shows how leading beverage brands have changes or evolved
in their core brand positions over time
• For a B to B firm, shows how different functional departments
perceived their own company along key dimensions or drivers
of innovation
Authentic Mexican Food
Great Tasting Food
High Quality Ingredients
Food from scratch
Clean/comfortable
atmosphere
Personable. Friendly employees
Treats you like a valued customer
Crave Menu Items
Variety of menu items
Has drive-thru
Healthy nutritious items
Has large portions
Food prepared how you want it
Modern up to date
Gets order right
Simple menu
Open late night/24 hours
Food timely/fast
Convenient nearby location
Good value for money
Low prices
Mexican Fast Food. Total base (all respondents)
The Menu
Convenience
Value
Service Delivery
Food Quality
Authentic and
trustworthy
Exciting and
lively
Dull and
tiresome
Eco-friendly
and caring
Brand Personality within a competitive
context - Detergents
Over-priced
Natural
Ethical
Caring
Disappointing
Over-promising
Boring
Basic
Tired
Irritatin
g
Fun
Vibrant
Efficient
Reliable
Genuine
Helpful
Expert
Family
Engaging
Client: Household cleaning
good manufacturer
Alpha (2007)
Alpha (2011)
Alpha (2012)
Beta (2007)
Beta(2011)
Beta (2012)
Gamma (2011)
Gamma
(2007)
Gamma (2012)
Is affordable
Is genuine and authentic
Worth what is costs
Goes well with food
Sophisticated drink
Always doing new things
Would like to be seen drinking
For football fans
Youthful brand
Is very refreshing
Cool & edgy
Associate with music
Inspires Optimism
Good when having
with friends
Is an uplifting drink
Makes moments fun
Thirst quenching brand
Great tasting
Comforting & Relaxing
For someone like me
Has a premium quality
Delta (2007)
Delta
(2011/12)
Value &
Affordability
Quality
Youthful & Cool Social & Fun
Personal
Base: Daily Drinkers of Alpha only
Adapted Statistical Correspondence Analysis
Case: Drinks brand (evolution in image through time)
Senor Mgmt Encourages Innovation
My Manager encourages innovation
Budgets for Innovation
Clear processes for Innovation
Sr. Mgment Supports Innovation
Sr. Mgment Invests in Innovation
Culture of innovation
Innovation Metrics
Employees allowed to take Risk
Innovation Success is Documented
Mid Managers can budget
innovation
Team collaborations
on Innovation
Promoted for Innovation Ideas
Innovation rewards & incentives
Employees empowered for
Innovation
Innovation Assessor Department Perceptual Map
Metrics & Tools
Rewards Innovation
Budgets for Innovation
Management Support
Easy communicate company Vision
Company Innovation Goals clear
Org. Hires Innovators
Company attracts innovative people
Mktg Insights
Bus. Strategy
R&D
Finance
Operations
Sales
Executive Officers
Clear criteria to eval. innovations
Innovation Culture
Open Communication
Satisfied with Org Innovation
Innovation Satisfaction
Supports New Innovation Initiatives
Employees empowered with tools to support innovation
Hiring Practises Support Innovation Does not penalize new ideas
Company innovation goals understood
Vision for Innovation
What data can we use
Structured survey
questions
Unstructured social
media data
Any two-way table will work to
produce a Radial Landscape Map
Our unique approach to measuring social “engagement”
Note: Off the shelf ‘sentiment’ metrics are based on automated word counting
and volume of conversation.
Our Approach:
• Is built upon a validated Linguistics based approach known as ‘Stance Shift
Analysis’
• Uncovers the meaning of conversations.
• Generates a metric called the Semantic Engagement Index (SEITM)
• Closely maps hard sales data.
Maps using Social Media Data
• How competitive beverage retailers are defined in terms of
customer perceptions
• How luxury-sports cars differ in terms of their customers’
association with attributes of safety, performance, prestige
and design
• How 4 leading facial cream brands differ and compare in
terms of how consumers describe their brand experiences.
Value and Price
Coolness, funky,
style, Décor
Taste and product
quality
In-store customer
experience
Good value
Coffee Price
Food prices
Talking business &
school work
Social with Friends
Store ambiance
Richness
Latte
Amazing taste
Like no other
Cool brand
Funky
Stylish brand
Artwork/Decor
Bubbles represent conversational clusters, whilst size indicates level of engagement.
Brand V
Brand X
Brand Y
Brand Y is least
differentiated by social
conversations.
Brand Z
Brand Z stands out v.
competitors for the
taste & rich flavour of
its beverages
Case: Beverage chain (400K social media conversations)
Brand W
Brand W is
distinctively seen as a
great place to meet
people & socialize
Luxury Sports Cars: Brand positioning using
socially engaged chatter
Classic
Speed
Gas Mileage
Reliable
Safety &
Reliability
To Be Seen Driving
Great Acceleration
Power
Safety
Interior Design
Styling
Curb Appeal
Performance
Emotional Style & Design
Elegant Feeling
Durable
Audi and Jaguar are
differentiated by social
conversations around style
and design.
BMW is uniquely positioned
on performance qualities.
Acura is least differentiated
by social chatter
Note: Separate analysis - Adapted Statistical Correspondence Analysis
Bubble size represents the buzz/volume of chatter (SEI Conversational Clusters)
Facial Creams Competitive brand positioning using SEITM
on topics
#Texture Hair
#Body Type
#Quantity
#Refreshing
#Sensory variety
#Diversity
#Texture Skin
#Skin Type
#Skin Irritation
#Baby Soft
#Promotion/Discount
#Affordability & Price
#Long Lasting
#Fragrance
• Adapted statistical correspondence analysis
• Rolled up Net SEI for last 52 weeks
• Bubbles sized by comment volume
• Central position implies least differentiation
For Neutrogena most of the engaged
positive comment is around #baby
soft, #texture skin and #texture hair.
Engaged conversations around Olay
are largely based around body type,
texture of hair and skin.
Garnier has the highest association
with baby soft, but also a direct
connection with affordability, quantity
and promo activity.
Engaged conversation for L’Oreal is
centred around long lasting, sensory
variety and even skin irritation.
Nivea is weakest in terms of
engaged chatter across topics,
although its’ score for texture hair
is relatively higher than other
brands.
Value
Texture
Diversity
Sensory

Radial Landscape Mapping: A new tool for brand positioning

  • 1.
    Radial Landscape Mapping An Innovationin brand perceptual mapping & brand positioning
  • 2.
  • 3.
    The Dilemma • Perceptualor correspondence mapping is a market research visual tool enabling companies to help understand differences in image and perceptions among customers or consumers, across competitive brands. • While the information and insights from this visual tool are significant and deep, traditional means for displaying this information has been problematic – Maps tend to be cluttered and messy. – Difficult to understand by non-technical audience – Suffers from trying to crowd multi-dimensional data onto 2 dimensional space – Lacks clarity and is not intuitive – Usually requires a highly technical person to interpret – Has a high propensity for confusion
  • 4.
    Lack of consistencyor clarity from brand maps
  • 5.
    Radial landscape mappingis based on a statistical data reduction technique* designed to measure the extent to which a set of brand personality attributes are associated with a set of known brands. Analysis results are illustrated using a ‘Radial Landscape Map’ where brand personality attributes are positioned out around the perimeter depending on their mutual association/correlation. Individual brands are positioned inside the map. Introducing…Radial Landscape Maps (A revolution in brand mapping) * Adapted statistical correspondence analysis Brand personality attribute Fun Family Values Modern Brand X Brand YCaring Brand ZBoring Basic Consistent Tired Brand W In some cases, the brand attributes start to cluster together representing an underlying theme or latent construct.  Brand W: Close to the centre - it is almost equally associated with all the personality attributes, but has a marginally higher association with vibrancy, expert and fun. This brand has little distinctiveness  Brand X: Has a significantly higher association with fun and modern  Brand Y: has a strong identity of being wholesome, caring and aligned with family values  Brand Z: Is regarded as a basic, tired and boring brand. Vibrant Wholesome
  • 6.
    Conventional Cases usingATU survey trackers • How Mexican restaurants are positioned relative to KPI’s Food Quality, Menu, Service & Delivery, Value and Convenience • How consumer perceptions of different detergent brands in the UK differ from each other • Shows how leading beverage brands have changes or evolved in their core brand positions over time • For a B to B firm, shows how different functional departments perceived their own company along key dimensions or drivers of innovation
  • 7.
    Authentic Mexican Food GreatTasting Food High Quality Ingredients Food from scratch Clean/comfortable atmosphere Personable. Friendly employees Treats you like a valued customer Crave Menu Items Variety of menu items Has drive-thru Healthy nutritious items Has large portions Food prepared how you want it Modern up to date Gets order right Simple menu Open late night/24 hours Food timely/fast Convenient nearby location Good value for money Low prices Mexican Fast Food. Total base (all respondents) The Menu Convenience Value Service Delivery Food Quality
  • 8.
    Authentic and trustworthy Exciting and lively Dulland tiresome Eco-friendly and caring Brand Personality within a competitive context - Detergents Over-priced Natural Ethical Caring Disappointing Over-promising Boring Basic Tired Irritatin g Fun Vibrant Efficient Reliable Genuine Helpful Expert Family Engaging Client: Household cleaning good manufacturer
  • 9.
    Alpha (2007) Alpha (2011) Alpha(2012) Beta (2007) Beta(2011) Beta (2012) Gamma (2011) Gamma (2007) Gamma (2012) Is affordable Is genuine and authentic Worth what is costs Goes well with food Sophisticated drink Always doing new things Would like to be seen drinking For football fans Youthful brand Is very refreshing Cool & edgy Associate with music Inspires Optimism Good when having with friends Is an uplifting drink Makes moments fun Thirst quenching brand Great tasting Comforting & Relaxing For someone like me Has a premium quality Delta (2007) Delta (2011/12) Value & Affordability Quality Youthful & Cool Social & Fun Personal Base: Daily Drinkers of Alpha only Adapted Statistical Correspondence Analysis Case: Drinks brand (evolution in image through time)
  • 10.
    Senor Mgmt EncouragesInnovation My Manager encourages innovation Budgets for Innovation Clear processes for Innovation Sr. Mgment Supports Innovation Sr. Mgment Invests in Innovation Culture of innovation Innovation Metrics Employees allowed to take Risk Innovation Success is Documented Mid Managers can budget innovation Team collaborations on Innovation Promoted for Innovation Ideas Innovation rewards & incentives Employees empowered for Innovation Innovation Assessor Department Perceptual Map Metrics & Tools Rewards Innovation Budgets for Innovation Management Support Easy communicate company Vision Company Innovation Goals clear Org. Hires Innovators Company attracts innovative people Mktg Insights Bus. Strategy R&D Finance Operations Sales Executive Officers Clear criteria to eval. innovations Innovation Culture Open Communication Satisfied with Org Innovation Innovation Satisfaction Supports New Innovation Initiatives Employees empowered with tools to support innovation Hiring Practises Support Innovation Does not penalize new ideas Company innovation goals understood Vision for Innovation
  • 11.
    What data canwe use Structured survey questions Unstructured social media data Any two-way table will work to produce a Radial Landscape Map
  • 12.
    Our unique approachto measuring social “engagement” Note: Off the shelf ‘sentiment’ metrics are based on automated word counting and volume of conversation. Our Approach: • Is built upon a validated Linguistics based approach known as ‘Stance Shift Analysis’ • Uncovers the meaning of conversations. • Generates a metric called the Semantic Engagement Index (SEITM) • Closely maps hard sales data.
  • 13.
    Maps using SocialMedia Data • How competitive beverage retailers are defined in terms of customer perceptions • How luxury-sports cars differ in terms of their customers’ association with attributes of safety, performance, prestige and design • How 4 leading facial cream brands differ and compare in terms of how consumers describe their brand experiences.
  • 14.
    Value and Price Coolness,funky, style, Décor Taste and product quality In-store customer experience Good value Coffee Price Food prices Talking business & school work Social with Friends Store ambiance Richness Latte Amazing taste Like no other Cool brand Funky Stylish brand Artwork/Decor Bubbles represent conversational clusters, whilst size indicates level of engagement. Brand V Brand X Brand Y Brand Y is least differentiated by social conversations. Brand Z Brand Z stands out v. competitors for the taste & rich flavour of its beverages Case: Beverage chain (400K social media conversations) Brand W Brand W is distinctively seen as a great place to meet people & socialize
  • 15.
    Luxury Sports Cars:Brand positioning using socially engaged chatter Classic Speed Gas Mileage Reliable Safety & Reliability To Be Seen Driving Great Acceleration Power Safety Interior Design Styling Curb Appeal Performance Emotional Style & Design Elegant Feeling Durable Audi and Jaguar are differentiated by social conversations around style and design. BMW is uniquely positioned on performance qualities. Acura is least differentiated by social chatter Note: Separate analysis - Adapted Statistical Correspondence Analysis Bubble size represents the buzz/volume of chatter (SEI Conversational Clusters)
  • 16.
    Facial Creams Competitivebrand positioning using SEITM on topics #Texture Hair #Body Type #Quantity #Refreshing #Sensory variety #Diversity #Texture Skin #Skin Type #Skin Irritation #Baby Soft #Promotion/Discount #Affordability & Price #Long Lasting #Fragrance • Adapted statistical correspondence analysis • Rolled up Net SEI for last 52 weeks • Bubbles sized by comment volume • Central position implies least differentiation For Neutrogena most of the engaged positive comment is around #baby soft, #texture skin and #texture hair. Engaged conversations around Olay are largely based around body type, texture of hair and skin. Garnier has the highest association with baby soft, but also a direct connection with affordability, quantity and promo activity. Engaged conversation for L’Oreal is centred around long lasting, sensory variety and even skin irritation. Nivea is weakest in terms of engaged chatter across topics, although its’ score for texture hair is relatively higher than other brands. Value Texture Diversity Sensory