marginal opportunity cost or marginal rate of transformation (moc or mrt)
Marginal opportunity cost (MOC) refers to the quantity of one commodity that must be sacrificed to produce one additional unit of another commodity. It is calculated as the change in output of one commodity divided by the change in output of the other. MOC shows the tradeoffs between commodities that must be made due to limited resources. The production possibilities curve (PPC) graphically represents the different combinations of two commodities an economy can produce with full employment of its resources. The slope of the PPC is equal to the MOC and can take different shapes depending on whether the MOC is increasing, decreasing, or constant.
Introduces Marginal Opportunity Cost (MOC) and defines it as the units of one commodity sacrificed to gain another. Mentions its calculation through output loss and gain.
Clarifies total opportunity cost as the complete sacrifice of production in terms of the next best alternative when utilizing resources.
Describes the Marginal Rate of Transformation (MRT) as the slope of the Production Possibility Curve (PPC), indicating trade-offs between two commodities.
Discusses PPC properties: downward slope and concave shape, highlighting fixed resources leading to increasing marginal opportunity cost.
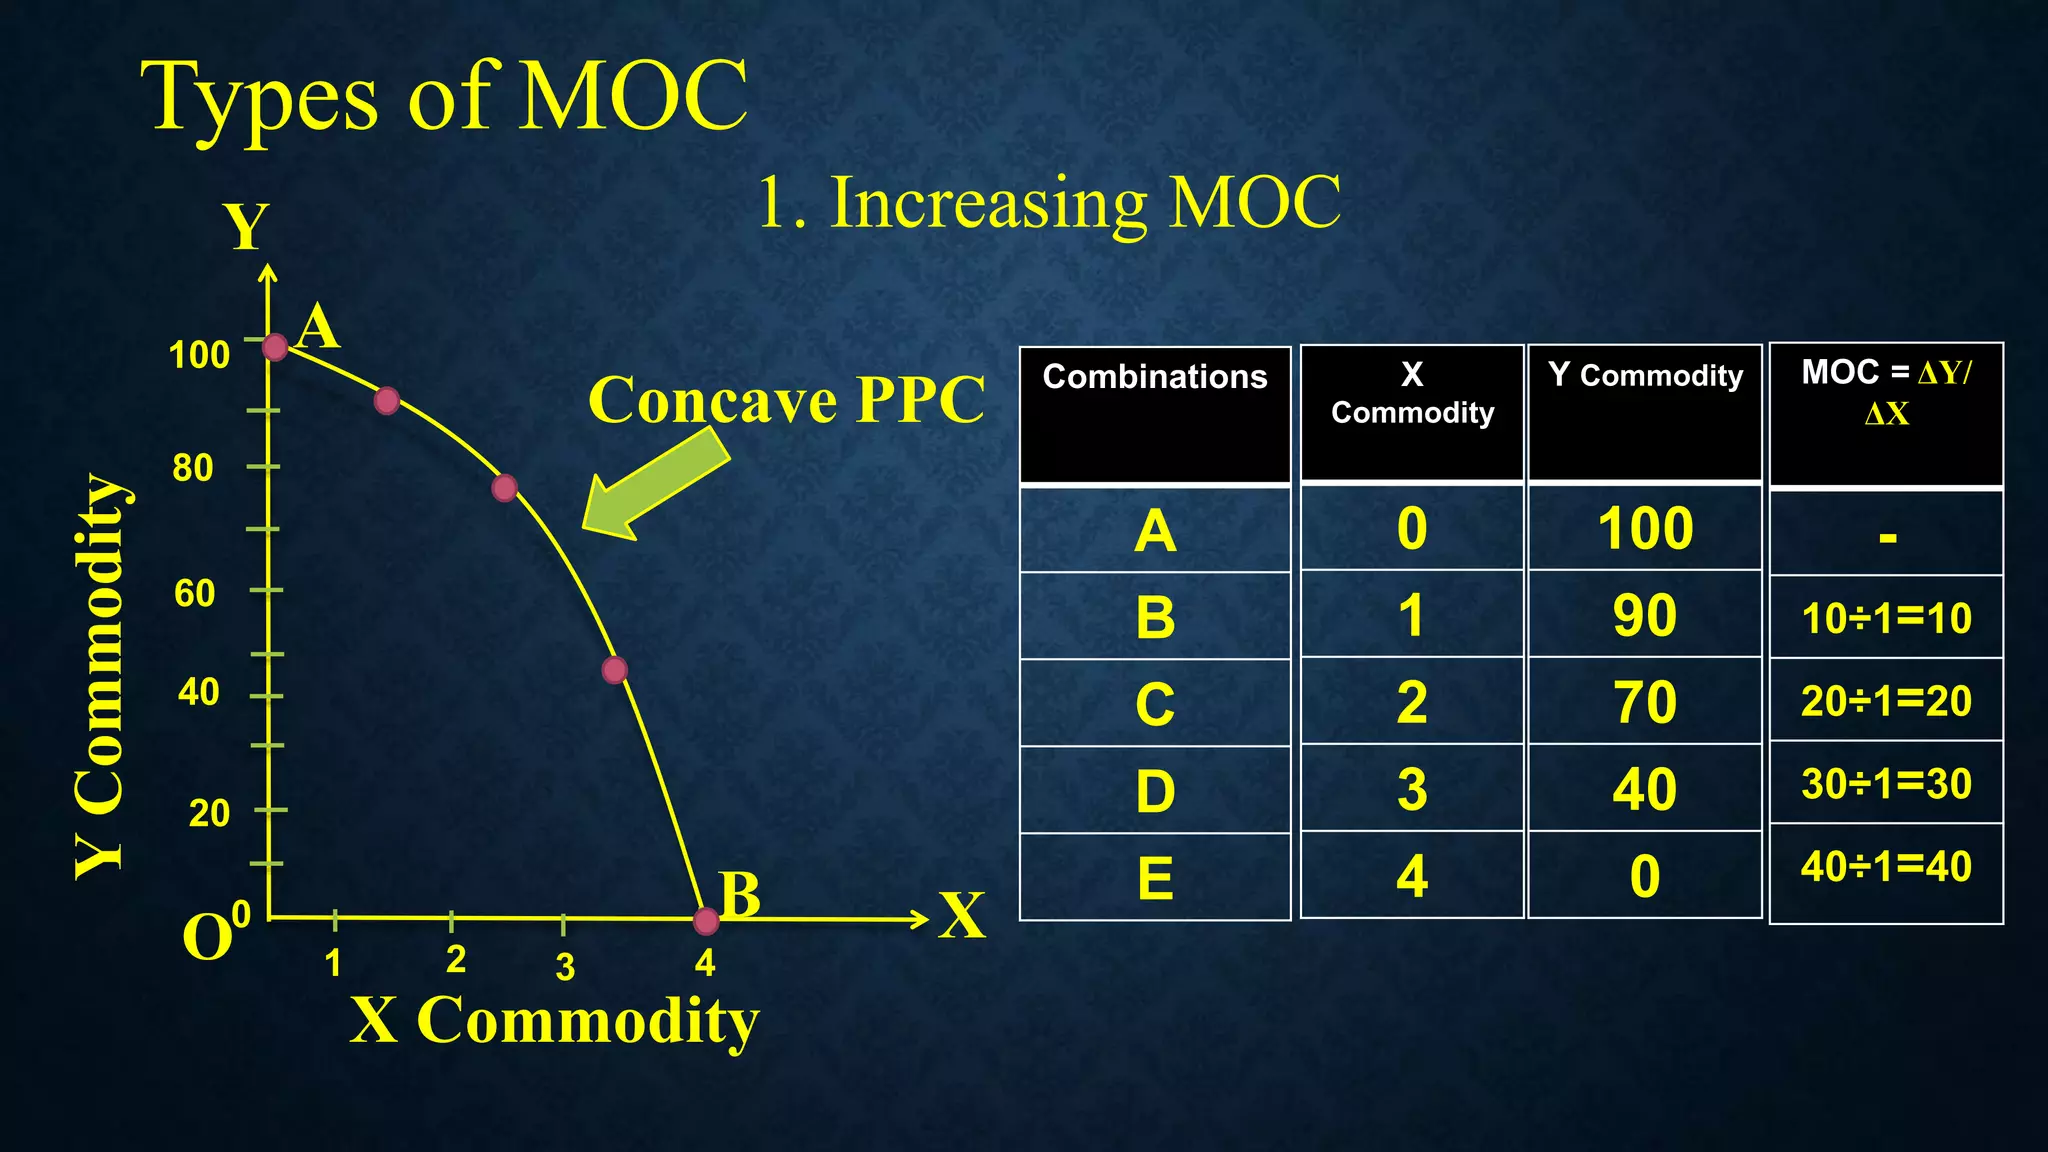
Illustrates increasing MOC with a concave PPC, where the trade-off of outputs escalates as one commodity is prioritized over another.
Explains decreasing MOC using a convex PPC, demonstrating how the sacrifice diminishes as output combinations change.
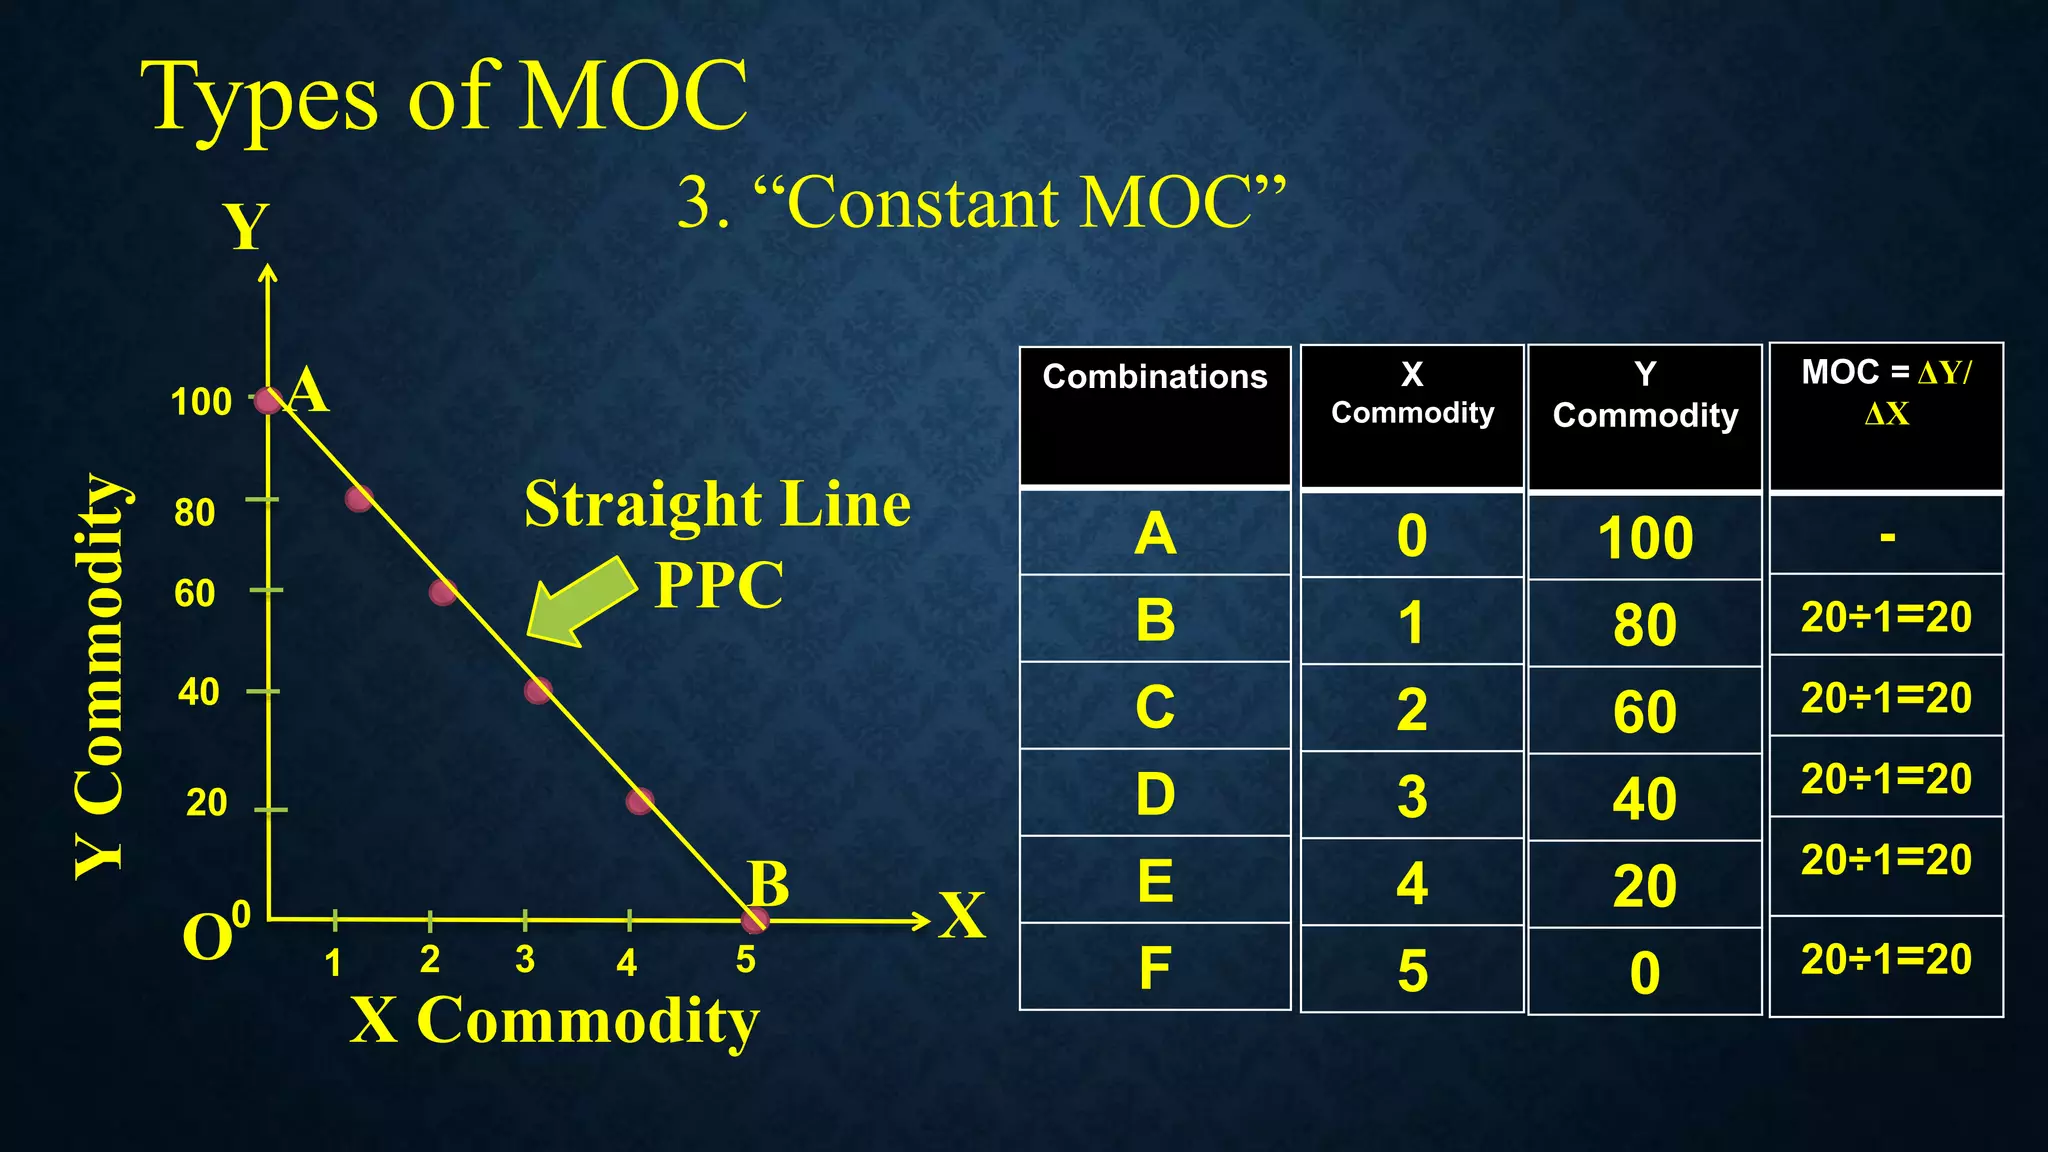
Defines constant MOC with a straight line PPC, where equal trade-offs exist, maintaining a consistent output relationship.
Summarizes the three types of PPC shapes: concave, convex, and straight line corresponding to Marginal Opportunity Costs.
Concludes the presentation with a thank you note, acknowledging the audience.
marginal opportunity cost or marginal rate of transformation (moc or mrt)
1.
By : DhirendraChauhan
Marginal
Opportunity Cost
“Marginal Rate of Transformation”
2.
“MOC refers tothe number of units of a commodity
sacrificed to gain one additional unit of another
commodity”
Marginal
Opportunity Cost
“it is the ration of additional loss of output(ΔY) to
additional gain of output(Δ X) when some resources are
shifted from the production of Y commodity to X
Commodity”
3.
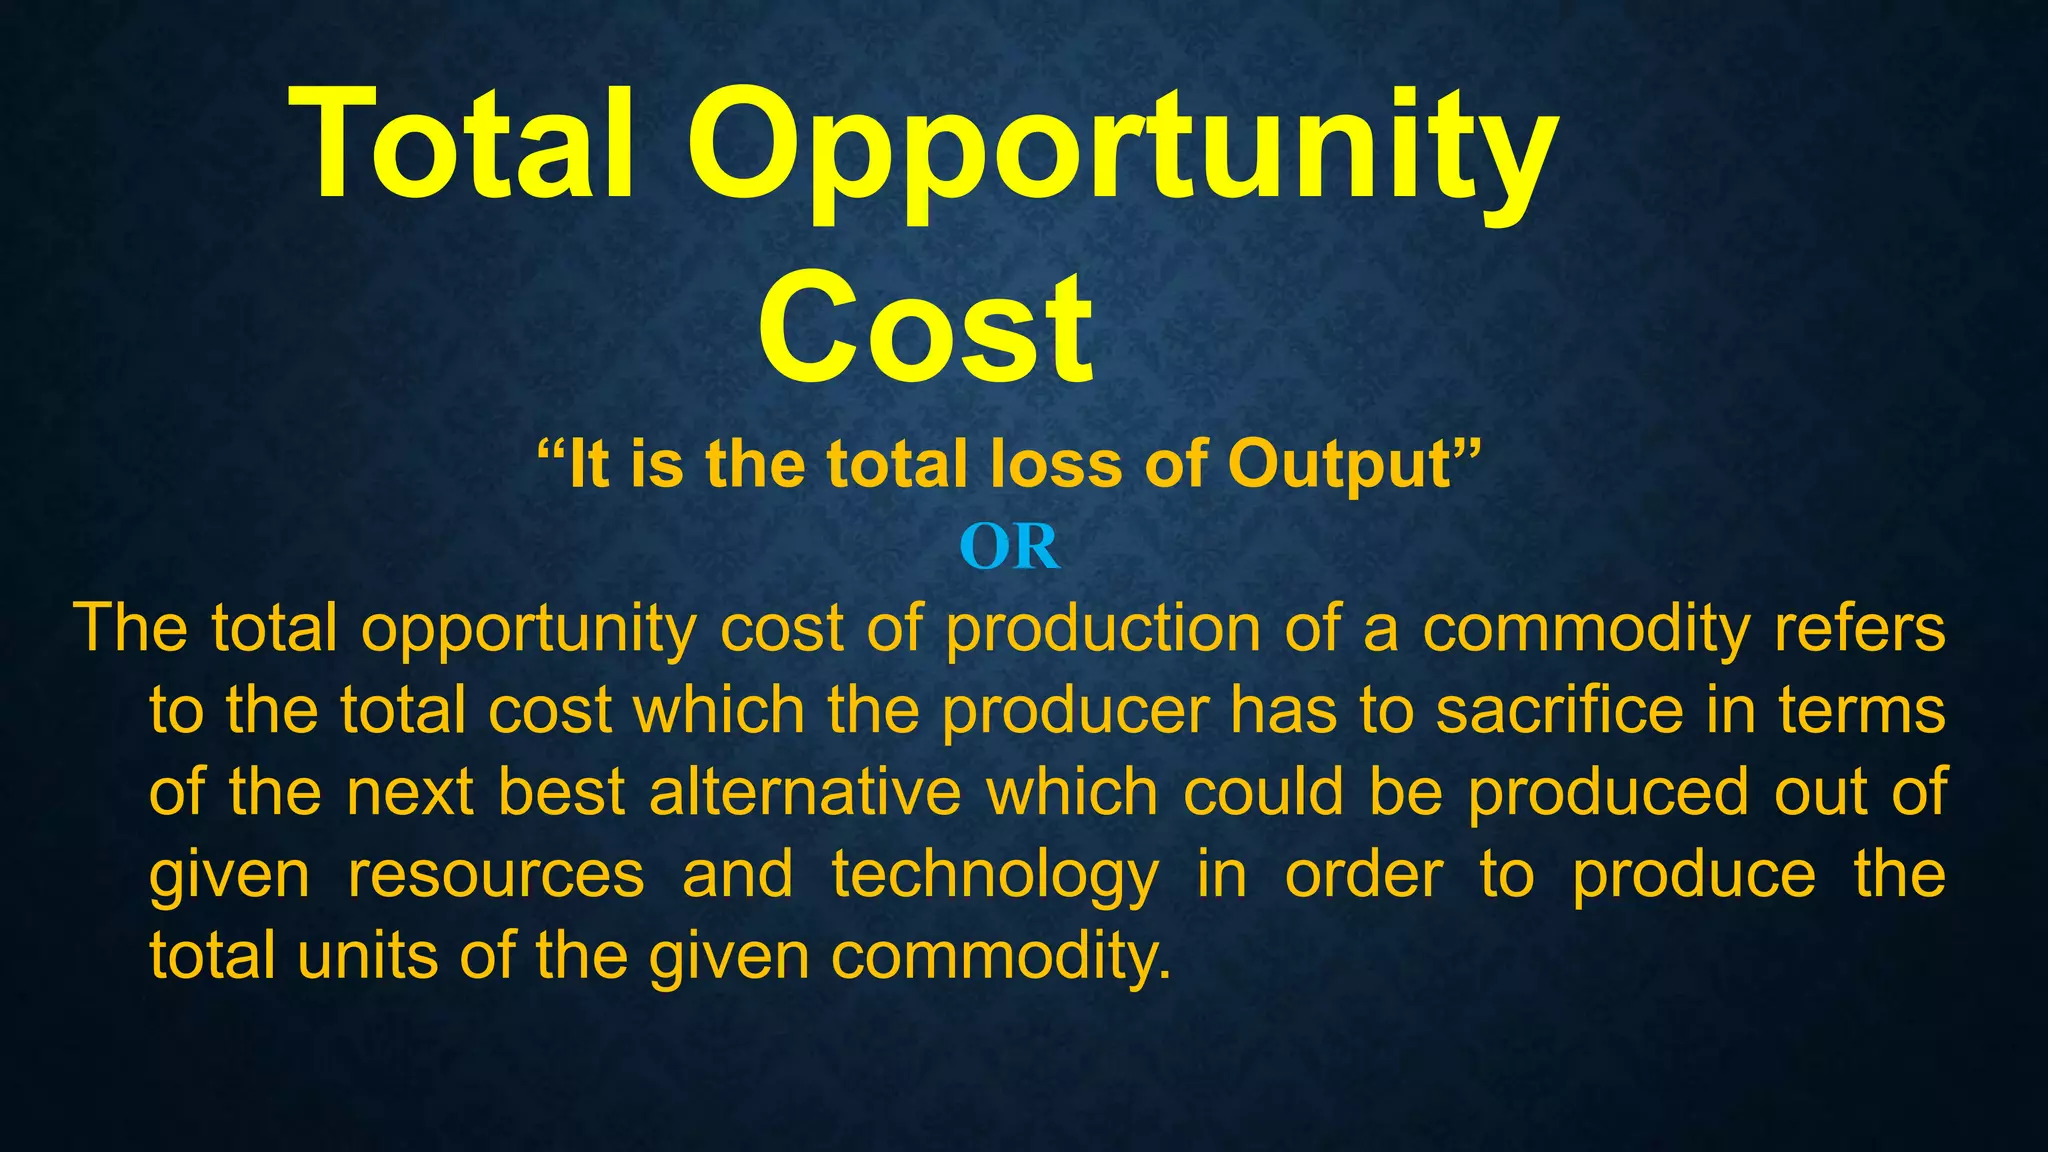
“It is thetotal loss of Output”
OR
The total opportunity cost of production of a commodity refers
to the total cost which the producer has to sacrifice in terms
of the next best alternative which could be produced out of
given resources and technology in order to produce the
total units of the given commodity.
Total Opportunity
Cost
4.
“MOC or MRTis also know as a
slope of PPC”
MRT =
ΔY
ΔX
Properties of PPCon MOC
1. PPC slopes downwards
PPC slopes downwards from left to right because from the given resources ,
production of both the goods cannot be increased. More of good X can be
produced only by producing less of good Y. it is because resounces are
fixed
2. PPC is concave to the point of origin
A concave downward sloping curve has an increasing slope. i.e.- increasing
marginal opportunity coast or increasing MRT
7.
Types of MOC
1.Increasing MOC
X Commodity
A
B X
Y
Y
Commodity
O
Combinations
A
B
C
D
E
X
Commodity
0
1
2
3
4
Y Commodity
100
90
70
40
0
MOC = ΔY/
ΔX
-
10÷1=10
20÷1=20
30÷1=30
40÷1=40
Concave PPC
1 2 4
3
100
80
60
40
20
0
8.
Types of MOC
2.Deceasing MOC
X Commodity
A
B
X
Y
Y
Commodity
O
Combinations
A
B
C
D
E
X
Commodity
0
1
2
3
4
Y
Commodity
100
60
30
10
0
MOC = ΔY/
ΔX
-
40÷1=40
30÷1=30
20÷1=20
10÷1=10
Convex PPC
1 2 4
3
100
80
60
40
20
0
9.
Types of MOC
3.“Constant MOC”
X Commodity
A
B X
Y
Y
Commodity
O
Combinations
A
B
C
D
E
F
X
Commodity
0
1
2
3
4
5
Y
Commodity
100
80
60
40
20
0
MOC = ΔY/
ΔX
-
20÷1=20
20÷1=20
20÷1=20
20÷1=20
20÷1=20
Straight Line
PPC
1 2 5
4
3
100
80
60
40
20
0