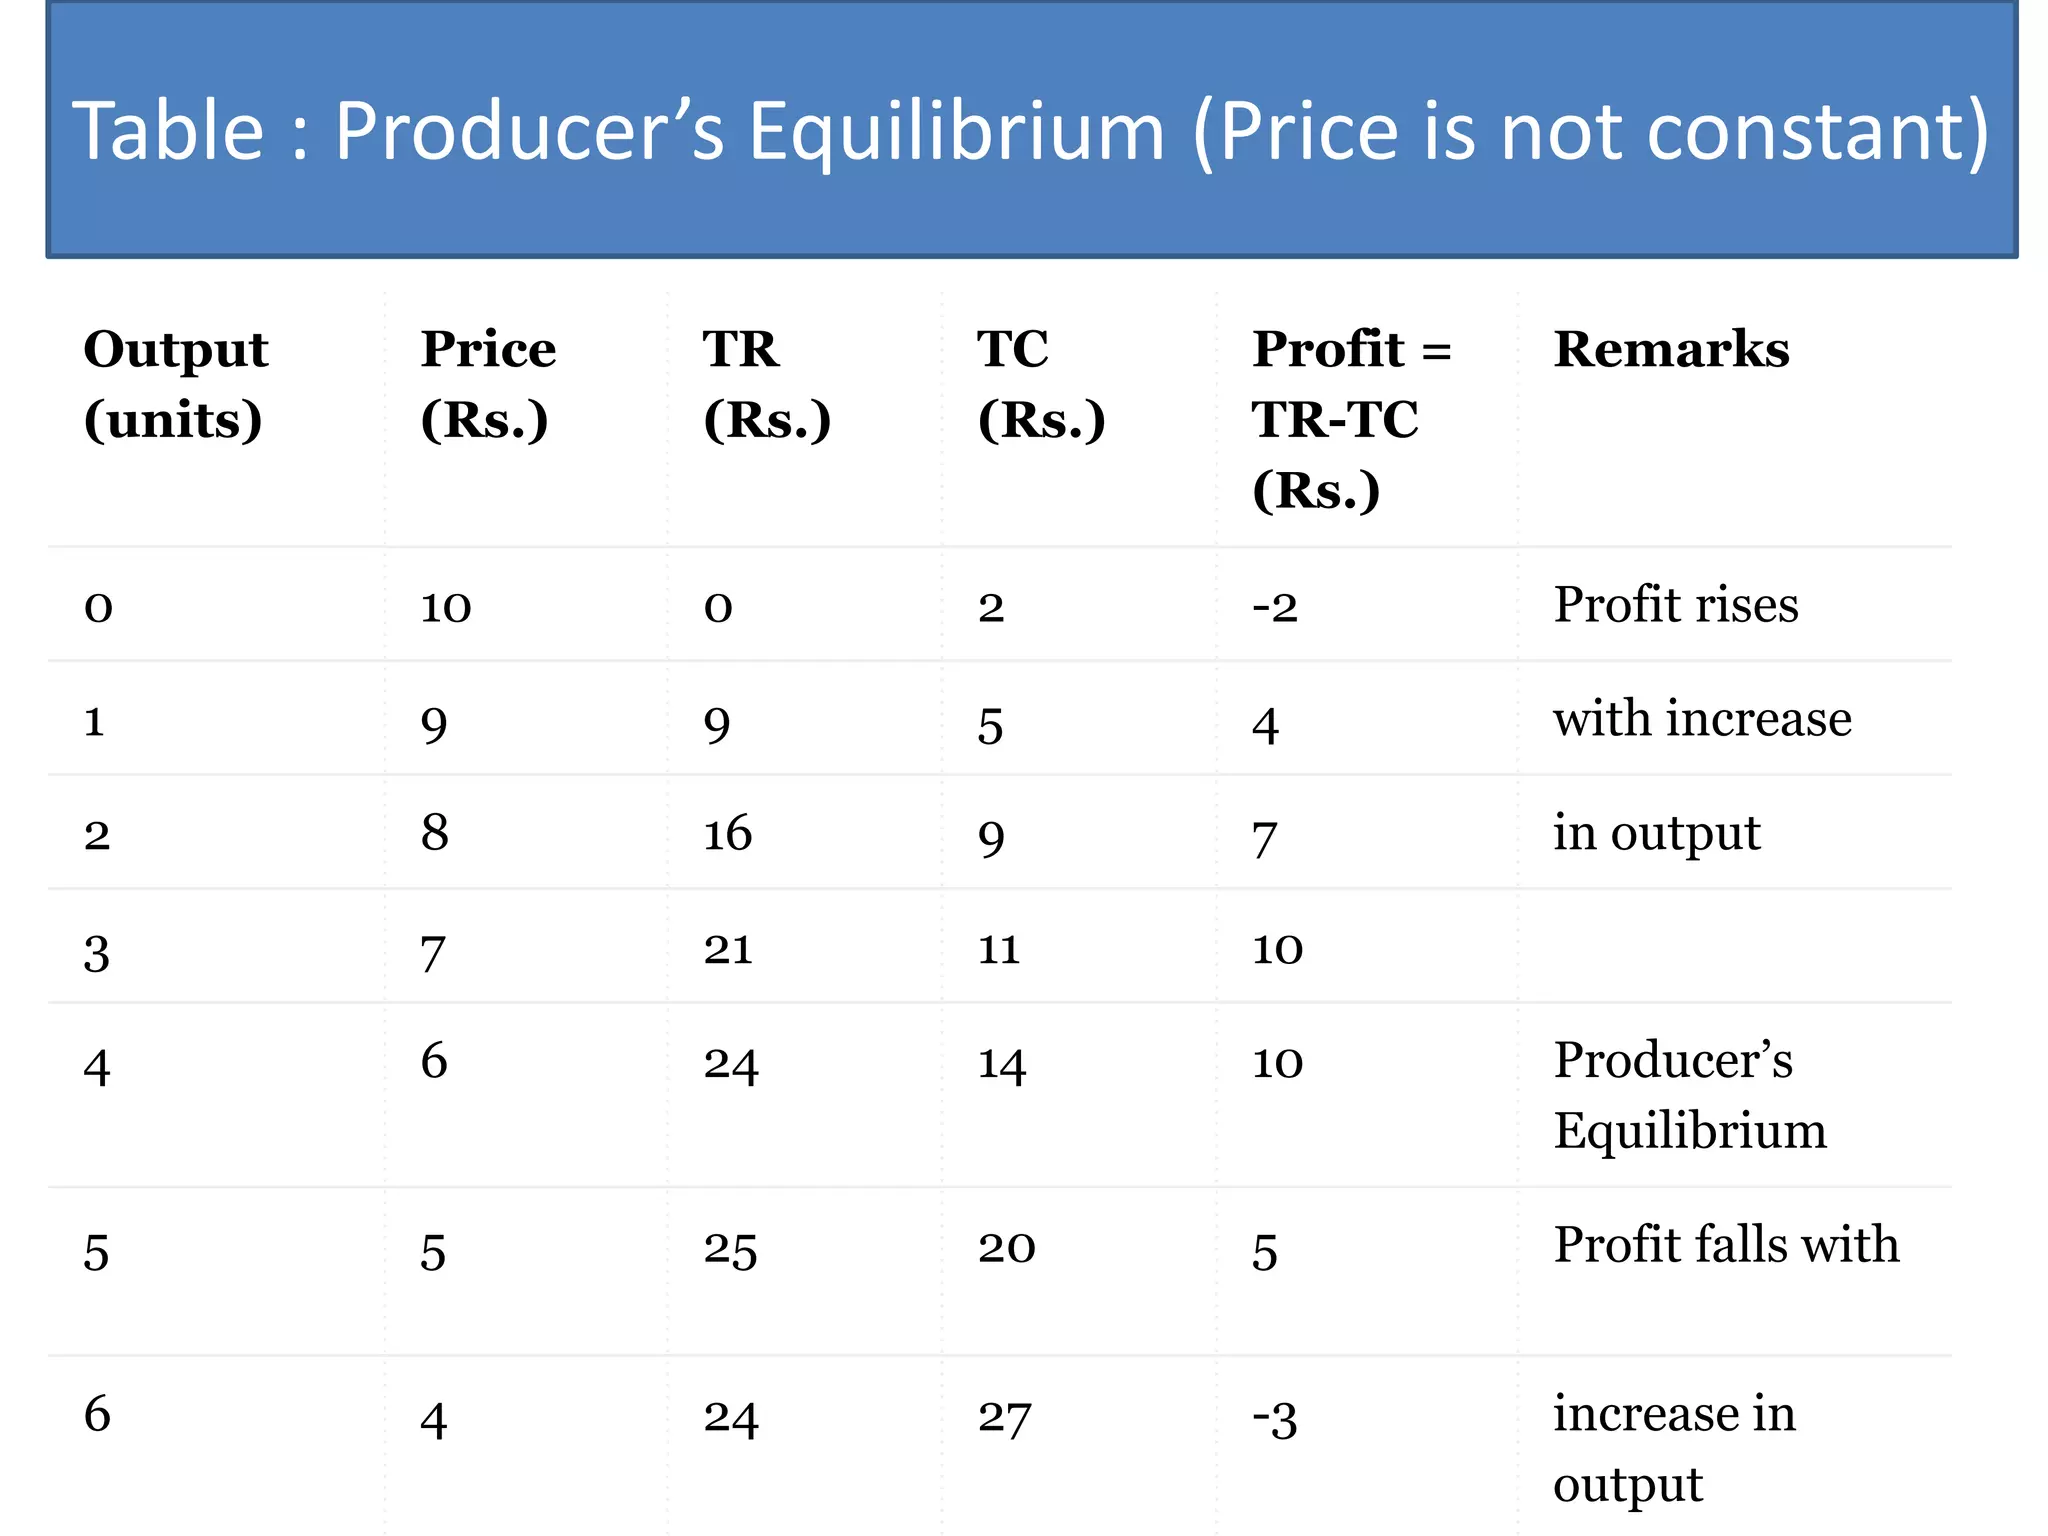
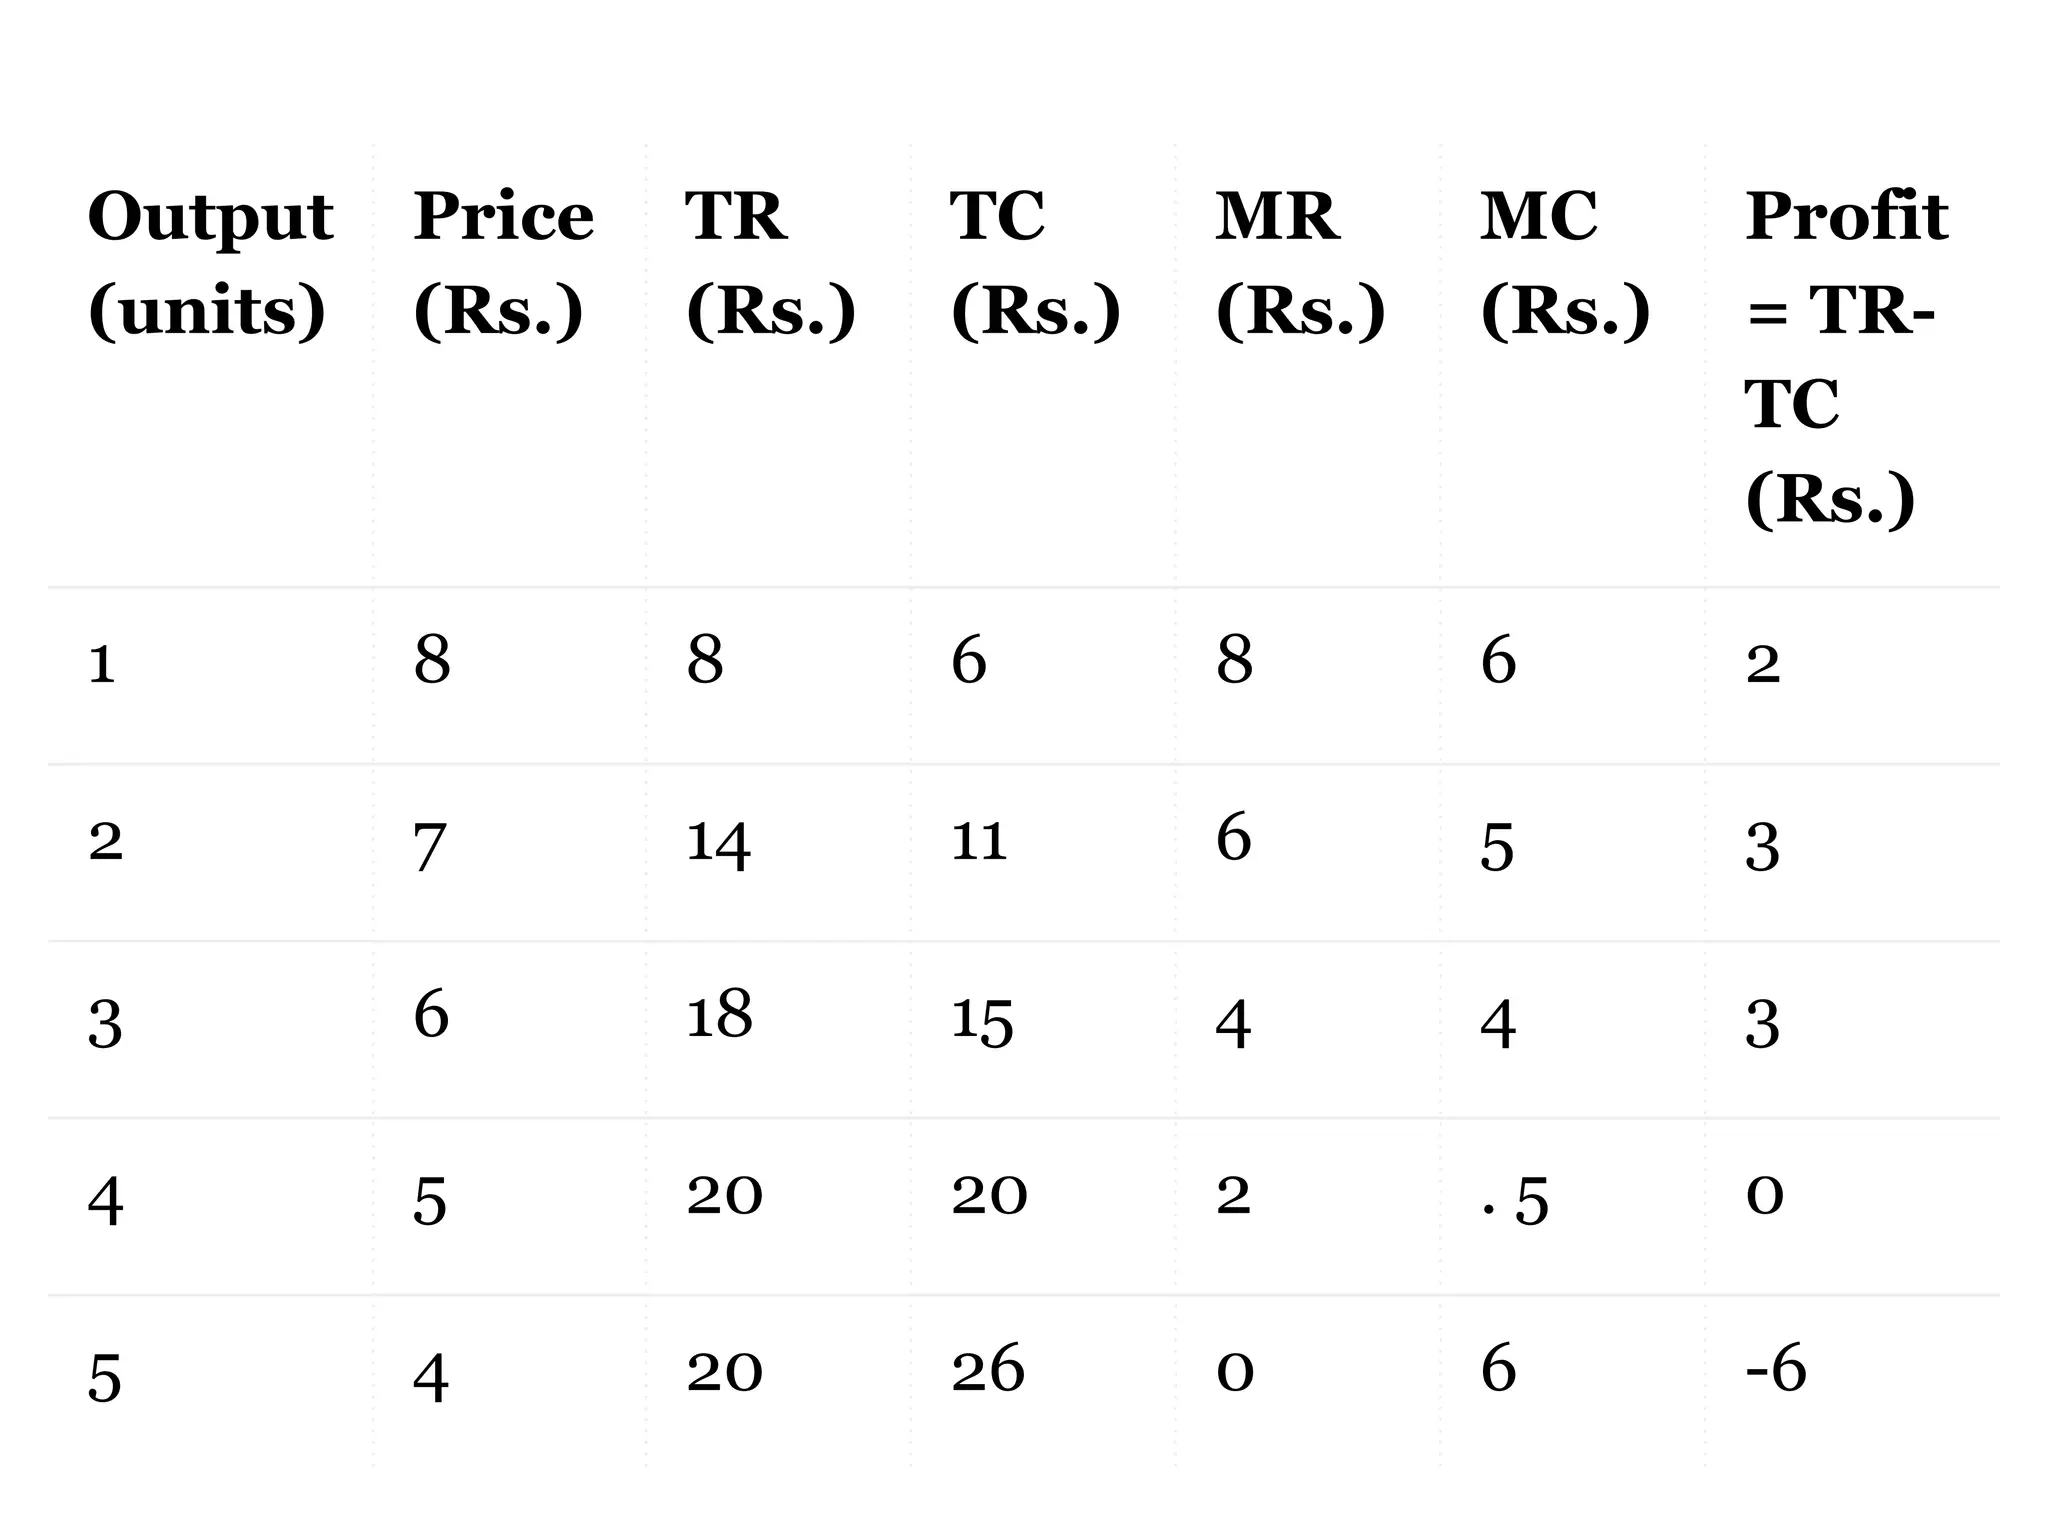
Dear all this presentation is all about the producer equilibrium which provides you the graphical and theory explanation.
If you like this PPT then please make me aware by messaging in linked in to make PPT on your other typical point.
XII - CBSE ECONOMICS 2017-18
PRODUCER EQUILIBRIUM
I AM CONFIDENT THAT STUDENTS WILL FIND THIS SLIDE USEFUL AND SUITABLE FOR CBSE EXAMINATION IN 2017-18. ANY FEEDBACK OR QUERIES YOU CAN POST IT TO MY E-MAIL ID.
Isoquant is also called as equal product curve or production indifference curve or constant product curve. Isoquant indicates various combinations of two factors of production which give the same level of output per unit of time.
Just as an indifference curve represents various combinations of two goods which give a consumer equal amount of satisfaction, an iso-product curve shows all possible combinations of two inputs physically capable of producing a given level of output. Since an iso-product curve represents those combinations which will result in the production of an equal quantity of output, the producer would be indifferent between them.
This law was given by Alfred Marshall in his book principle of economics.
It show particular pattern of change in output when some factor remain fixed.
Production depend upon factors of production , if factors of production are good, production may increase and vice-versa.
Production function show functional relationship between production and factors of production.
It refers to manner of change in output cost by the increase in all the input simultaneously and in the same proportion.
Returns refers to “change in physical output”
Scale refers to “quantity of input employed”
Change in scale means that all factors of production are increased or decreased in same proportion.
The cost advantage that arises with increased output of a product.
It arises because of the inverse relationship between the quantity produced and per-unit fixed cost.
Profit refers to the excess of receipts from the sale of goods over the expenditure incurred on producing them.
The amount received from the sale of goods is known as ‘revenue’ and the expenditure on production of such goods is termed as ‘cost’. The difference between revenue and cost is known as ‘profit’.
For example, if a firm sells goods for Rs. 10 crores after incurring an expenditure of Rs. 7 crores, then profit will be Rs. 3 crores.
Equilibrium of firm and Industry under Perfect CompetitionBikash Kumar
Macro Economics
For downloading this contact- bikashkumar.bk100@gmail.com
Prepared by Students of University of Rajshahi
Md. Sultan Mahmud
Md. Shaon Mollah
Md. Mamun Miah
Md. Abid Hasan
Shimul Kumar Mondal
Isoquant is also called as equal product curve or production indifference curve or constant product curve. Isoquant indicates various combinations of two factors of production which give the same level of output per unit of time.
Just as an indifference curve represents various combinations of two goods which give a consumer equal amount of satisfaction, an iso-product curve shows all possible combinations of two inputs physically capable of producing a given level of output. Since an iso-product curve represents those combinations which will result in the production of an equal quantity of output, the producer would be indifferent between them.
This law was given by Alfred Marshall in his book principle of economics.
It show particular pattern of change in output when some factor remain fixed.
Production depend upon factors of production , if factors of production are good, production may increase and vice-versa.
Production function show functional relationship between production and factors of production.
It refers to manner of change in output cost by the increase in all the input simultaneously and in the same proportion.
Returns refers to “change in physical output”
Scale refers to “quantity of input employed”
Change in scale means that all factors of production are increased or decreased in same proportion.
The cost advantage that arises with increased output of a product.
It arises because of the inverse relationship between the quantity produced and per-unit fixed cost.
Profit refers to the excess of receipts from the sale of goods over the expenditure incurred on producing them.
The amount received from the sale of goods is known as ‘revenue’ and the expenditure on production of such goods is termed as ‘cost’. The difference between revenue and cost is known as ‘profit’.
For example, if a firm sells goods for Rs. 10 crores after incurring an expenditure of Rs. 7 crores, then profit will be Rs. 3 crores.
Macro Economics
For downloading this contact- bikashkumar.bk100@gmail.com
Prepared by Students of University of Rajshahi
Pranto Karmoker (leader)
Ariful Islam
Monir Hossain
Sohag Miah
Shammira Parvin
The interconnected characteristics of a market, such as the number and relative strength of buyers and sellers and degree of collusion among them, level and forms of competition, extent of product differentiation, and ease of entry into and exit from the market.Four basic types of market structure are (1) Perfect competition: many buyers and sellers, none being able to influence prices. (2) Oligopoly: several large sellers who have some control over the prices. (3) Monopoly: single seller with considerable control over supply and prices. (4) Monopsony: single buyer with considerable control over demand and prices.
The selling environment in which a firm produces and sells its product is called a market structure.*
Defined by three characteristics:
The number of firms in the market
The ease of entry and exit of firms
The degree of product differentiation
perfect competition, monopoly, monopolistic and oligopolysandypkapoor
Price determination under different market structure and characterstics of all these market stractures along with graphical presentation of Perfect competition, Monopoly, Monopolistic and Oligopoly market structue
FellowBuddy.com is an innovative platform that brings students together to share notes, exam papers, study guides, project reports and presentation for upcoming exams.
We connect Students who have an understanding of course material with Students who need help.
Benefits:-
# Students can catch up on notes they missed because of an absence.
# Underachievers can find peer developed notes that break down lecture and study material in a way that they can understand
# Students can earn better grades, save time and study effectively
Our Vision & Mission – Simplifying Students Life
Our Belief – “The great breakthrough in your life comes when you realize it, that you can learn anything you need to learn; to accomplish any goal that you have set for yourself. This means there are no limits on what you can be, have or do.”
Like Us - https://www.facebook.com/FellowBuddycom
MBA 681 Economics for Strategic DecisionsPrepared by Yun Wan.docxalfredacavx97
MBA 681 Economics for Strategic Decisions
Prepared by Yun Wang
1. How does firm maximize profit.
2. Poduction decision in the perfect competitive market.
3. Production decision in monopolistic competitive market.
4. Production decision in oligopoly.
5. Production decision in monoply.
6. Two special models in oligopoly market.
1. How a Firm Maximizes Profit:
All firms try to maximize profits based on the following equation:
Profit = Total Revenue − Total Cost
The rules we have just developed for profit maximization are:
1. The profit-maximizing level of output is where the difference between total revenue and total
cost is greatest, and
2. The profit-maximizing level of output is also where MR = MC.
Notice: All of these rules do not require the assumption of market type; they are true for all
firms with different market structures (perfect competition, monopolistic competition,
oligopoly, monopoly)!
The Four Market Structures:Structures
Market Structure
Characteristic Perfect Competition
Monopolistic
Competition Oligopoly Monopoly
Type of product Identical Differentiated Identical or differentiated Unique
Ease of entry High High Low Entry blocked
Examples of
industries
Growing wheat
Poultry farming
Clothing stores
Restaurants
Manufacturing computers
Manufacturing automobiles
First-class mail delivery
Providing tap water
2. Profit Determination in Perfect Competitive Market:
A firm maximizes profit at
the level of output at which
marginal revenue equals
marginal cost.
The difference between
price and average total cost
equals profit per unit of
output.
Total profit equals profit per
unit of output, times the
amount of output: the area
of the green rectangle on the
graph.
In the graph on the left, price
never exceeds average cost,
so the firm could not possibly
make a profit.
The best this firm can do is to
break even, obtaining no
profit but incurring no loss.
The MC = MR rule leads us to
this optimal level of
production.
The situation is even worse
for this firm; not only can it
not make a profit, price is
always lower than average
total cost, so it must make
a loss.
It makes the smallest loss
possible by again following
the MC = MR rule.
No other level of output
allows the firm’s loss to be
so small.
Identifying Whether a Firm Can Make a Profit
Once we have determined the quantity where MC = MR, we can immediately know
whether the firm is making a profit, breaking even, or making a loss. At that quantity,
• If P > ATC, the firm is making a profit
• If P = ATC, the firm is breaking even
• If P < ATC, the firm is making a loss
Even better: these statements hold true at every level of output.
However, if the price is too low, i.e. below the minimum point of
AVC, the firm will produce nothing at all.
The quantity supplied is zero below this point.
3. Profit Determination in Monopolistic Competitive Market:
(1 of 3)
In the short run, a monopol.
Business Valuation Principles for EntrepreneursBen Wann
This insightful presentation is designed to equip entrepreneurs with the essential knowledge and tools needed to accurately value their businesses. Understanding business valuation is crucial for making informed decisions, whether you're seeking investment, planning to sell, or simply want to gauge your company's worth.
Company Valuation webinar series - Tuesday, 4 June 2024FelixPerez547899
This session provided an update as to the latest valuation data in the UK and then delved into a discussion on the upcoming election and the impacts on valuation. We finished, as always with a Q&A
Premium MEAN Stack Development Solutions for Modern BusinessesSynapseIndia
Stay ahead of the curve with our premium MEAN Stack Development Solutions. Our expert developers utilize MongoDB, Express.js, AngularJS, and Node.js to create modern and responsive web applications. Trust us for cutting-edge solutions that drive your business growth and success.
Know more: https://www.synapseindia.com/technology/mean-stack-development-company.html
An introduction to the cryptocurrency investment platform Binance Savings.Any kyc Account
Learn how to use Binance Savings to expand your bitcoin holdings. Discover how to maximize your earnings on one of the most reliable cryptocurrency exchange platforms, as well as how to earn interest on your cryptocurrency holdings and the various savings choices available.
Affordable Stationery Printing Services in Jaipur | Navpack n PrintNavpack & Print
Looking for professional printing services in Jaipur? Navpack n Print offers high-quality and affordable stationery printing for all your business needs. Stand out with custom stationery designs and fast turnaround times. Contact us today for a quote!
Enterprise Excellence is Inclusive Excellence.pdfKaiNexus
Enterprise excellence and inclusive excellence are closely linked, and real-world challenges have shown that both are essential to the success of any organization. To achieve enterprise excellence, organizations must focus on improving their operations and processes while creating an inclusive environment that engages everyone. In this interactive session, the facilitator will highlight commonly established business practices and how they limit our ability to engage everyone every day. More importantly, though, participants will likely gain increased awareness of what we can do differently to maximize enterprise excellence through deliberate inclusion.
What is Enterprise Excellence?
Enterprise Excellence is a holistic approach that's aimed at achieving world-class performance across all aspects of the organization.
What might I learn?
A way to engage all in creating Inclusive Excellence. Lessons from the US military and their parallels to the story of Harry Potter. How belt systems and CI teams can destroy inclusive practices. How leadership language invites people to the party. There are three things leaders can do to engage everyone every day: maximizing psychological safety to create environments where folks learn, contribute, and challenge the status quo.
Who might benefit? Anyone and everyone leading folks from the shop floor to top floor.
Dr. William Harvey is a seasoned Operations Leader with extensive experience in chemical processing, manufacturing, and operations management. At Michelman, he currently oversees multiple sites, leading teams in strategic planning and coaching/practicing continuous improvement. William is set to start his eighth year of teaching at the University of Cincinnati where he teaches marketing, finance, and management. William holds various certifications in change management, quality, leadership, operational excellence, team building, and DiSC, among others.
Buy Verified PayPal Account | Buy Google 5 Star Reviewsusawebmarket
Buy Verified PayPal Account
Looking to buy verified PayPal accounts? Discover 7 expert tips for safely purchasing a verified PayPal account in 2024. Ensure security and reliability for your transactions.
PayPal Services Features-
🟢 Email Access
🟢 Bank Added
🟢 Card Verified
🟢 Full SSN Provided
🟢 Phone Number Access
🟢 Driving License Copy
🟢 Fasted Delivery
Client Satisfaction is Our First priority. Our services is very appropriate to buy. We assume that the first-rate way to purchase our offerings is to order on the website. If you have any worry in our cooperation usually You can order us on Skype or Telegram.
24/7 Hours Reply/Please Contact
usawebmarketEmail: support@usawebmarket.com
Skype: usawebmarket
Telegram: @usawebmarket
WhatsApp: +1(218) 203-5951
USA WEB MARKET is the Best Verified PayPal, Payoneer, Cash App, Skrill, Neteller, Stripe Account and SEO, SMM Service provider.100%Satisfection granted.100% replacement Granted.
Putting the SPARK into Virtual Training.pptxCynthia Clay
This 60-minute webinar, sponsored by Adobe, was delivered for the Training Mag Network. It explored the five elements of SPARK: Storytelling, Purpose, Action, Relationships, and Kudos. Knowing how to tell a well-structured story is key to building long-term memory. Stating a clear purpose that doesn't take away from the discovery learning process is critical. Ensuring that people move from theory to practical application is imperative. Creating strong social learning is the key to commitment and engagement. Validating and affirming participants' comments is the way to create a positive learning environment.
VAT Registration Outlined In UAE: Benefits and Requirementsuae taxgpt
Vat Registration is a legal obligation for businesses meeting the threshold requirement, helping companies avoid fines and ramifications. Contact now!
https://viralsocialtrends.com/vat-registration-outlined-in-uae/
Event Report - SAP Sapphire 2024 Orlando - lots of innovation and old challengesHolger Mueller
Holger Mueller of Constellation Research shares his key takeaways from SAP's Sapphire confernece, held in Orlando, June 3rd till 5th 2024, in the Orange Convention Center.
Digital Transformation and IT Strategy Toolkit and TemplatesAurelien Domont, MBA
This Digital Transformation and IT Strategy Toolkit was created by ex-McKinsey, Deloitte and BCG Management Consultants, after more than 5,000 hours of work. It is considered the world's best & most comprehensive Digital Transformation and IT Strategy Toolkit. It includes all the Frameworks, Best Practices & Templates required to successfully undertake the Digital Transformation of your organization and define a robust IT Strategy.
Editable Toolkit to help you reuse our content: 700 Powerpoint slides | 35 Excel sheets | 84 minutes of Video training
This PowerPoint presentation is only a small preview of our Toolkits. For more details, visit www.domontconsulting.com
Digital Transformation and IT Strategy Toolkit and Templates
PRODUCERS EQUILIBRIUM
1. Producer’s Equilibrium
Group Presentation By :- iMBA Sem 1
Drashti Vaishnav Priya Ahir
Aditya Rajapara Saloni Kacha
Bhavik Rathod Meet Buddhdev
Jenil Raja Archer Vaghela
Kukreja Payal Riddhi Parekh
Twinkal Makvana Priyanka Memdavadi
Parth Laladiya
Brij Vasant
2. Producer’s Equilibrium
• Producer’s Equilibrium:
• Equilibrium refers to a state of rest when no
change is required. A firm (producer) is said to be
in equilibrium when it has no inclination to
expand or to contract its output. This state either
reflects maximum profits or minimum losses.
• There are two methods for determination of
Producer’s Equilibrium:
• 1. Total Revenue and Total Cost Approach (TR-TC
Approach)
• 2. Marginal Revenue and Marginal Cost Approach
(MR-MC Approach)
3. • Before we proceed further, we must be clear
about one more point. Producer can attain the
equilibrium level under two different situations:
• (1) When Price remains Constant. In this
situation, firm has to accept the same price as
determined by the industry. It means, any
quantity of a commodity can be sold at that
particular price.
• (2) When Price Falls with rise in output. In this
situation, firm follows its own pricing policy.
However, it can increase sales only by reducing
the price.
4. • A firm attains the stage of equilibrium when it
maximises its profits, i.e. when he maximises
the difference between TR and TC. After
reaching such a position, there will be no
incentive for the producer to increase or
decrease the output and the producer will be
said to be at equilibrium.
• Two essential conditions for producer’s
equilibrium are: (Assumption)
• 1)) The difference between TR and TC is
positively maximized
• 2)) Total profits fall after that level of output.
5. • Producer’s Equilibrium (When Price remains
Constant):
• When price remains same at all output levels ,
each producer aims to produce that level of
output at which he can earn maximum profits,
i.e. when difference between TR and TC is the
maximum. Let us understand this with the
help of Table 8.1, where market price is fixed
at Rs. 10 per unit:
10. • Marginal Revenue-Marginal Cost Approach (MR-MC
Approach):
• According to MR-MC approach, producer’s equilibrium
refers to stage of that output level at which:
• 1. MC = MR:
• As long as MC is less than MR, it is profitable for the
producer to go on producing more because it adds to its
profits. He stops producing more only when MC becomes
equal to MR.
• 2. MC is greater than MR after MC = MR output level:
• When MC is greater than MR after equilibrium, it means
producing more will lead to decline in profits.
11. • Producer’s Equilibrium (When Price remains
Constant):
• When price remains constant, firms can sell
any quantity of output at the price fixed by
the market. Price remains same at all levels of
output.
• Let us understand this with the help of Table
8.3, where market price is fixed at Rs. 12 per
unit:
13. Producer’s Equilibrium is determined at OQ
level of output corresponding to point K as at
this point: (i) MC = MR; and (ii) MC is greater
than MR after MC = MR output level. In Fig.
8.3, output is shown on the X-axis and
revenue and costs on the Y-axis. Both AR and
MR curves are straight line parallel to the X-
axis. MC curve is U-shaped. Producer’s
equilibrium will be determined at OQ level of
output corresponding to point K because only
at point K, the following two conditions are
met:
1. MC = MR; and
2. MC is greater than MR after MC = MR
output level
Although MC = MR is also satisfied at point R,
but it is not the point of equilibrium as it
satisfies only the first condition (i.e. MC =
MR). So, the producer will be at equilibrium at
point K when both the conditions are
satisfied.
14. • Producer’s Equilibrium (When Price Falls with
rise in output):
• When there is no fixed price and price falls
with rise in output, MR curve slope
downwards. Producer aims to produce that
level of output at which MC is equal to MR
and MC curve cuts the MR curve from below.
Let us understand this with the help of Table
8.4:
16. Producer’s Equilibrium is determined at
OM level of output corresponding to point E
as at this point: (i) MC = MR; and (ii) MC is
greater than MR after MC = MR output
level.
In Fig. 8.4, output is shown on the X-axis
and revenue and costs on the Y-axis.
Producer’s equilibrium will be determined
at OM level of output corresponding to
point E because at this, the following two
conditions are met:
1. MC = MR; and
2. MC is greater than MR after MC = MR
output level.
So, the producer is at equilibrium at OM
units of output.