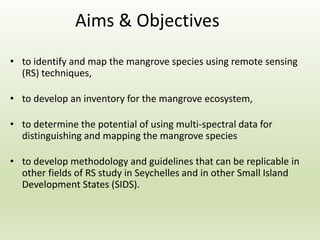
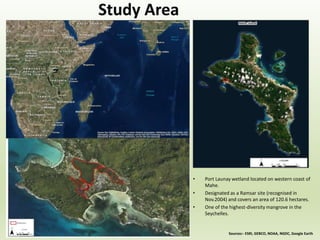
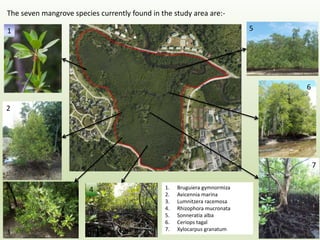
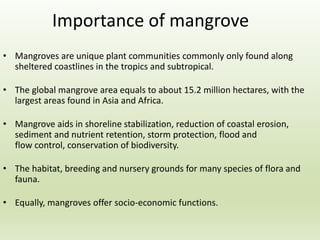
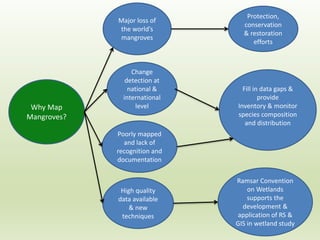
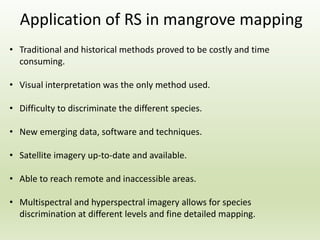
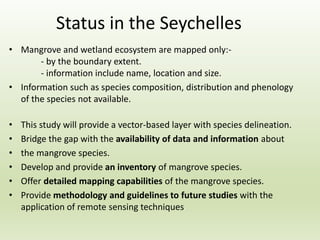
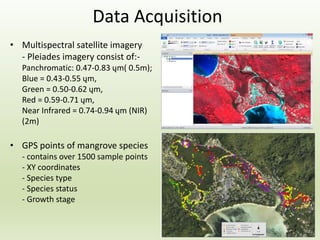
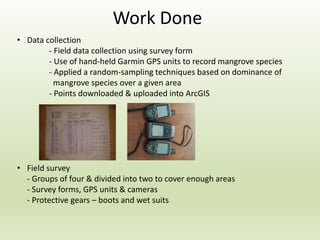
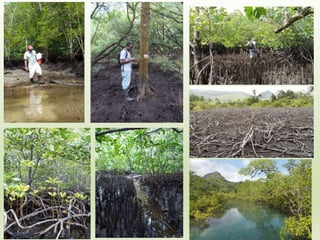
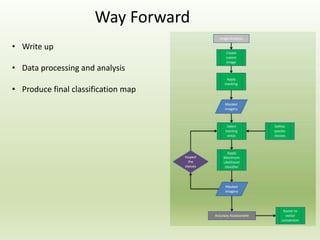
Mapping the mangrove species
using remote sensing
techniques:
A case study
in the Seychelles
Presented by Alvin Alcindor, Kingston University
November 2014
• Aims & Objectives
• Study area
• Literature review
• Importance of mangroves
• Why Map Mangroves?
• Application of remote sensing in mapping mangroves
• Status in Seychelles
• Data Acquisition & Work Done
• Analysis
• Way Forward
• Problems & Issues
• References
Overview
Aims & Objectives
• to identify and map the mangrove species using remote sensing
(RS) techniques,
• to develop an inventory for the mangrove ecosystem,
• to determine the potential of using multi-spectral data for
distinguishing and mapping the mangrove species
• to develop methodology and guidelines that can be replicable in
other fields of RS study in Seychelles and in other Small Island
Development States (SIDS).
Sources:- ESRI, GEBCO, NOAA, NGDC, Google Earth
• Port Launay wetland located on western coast of
Mahe.
• Designated as a Ramsar site (recognised in
Nov.2004) and covers an area of 120.6 hectares.
• One of the highest-diversity mangrove in the
Seychelles.
1
2
4
3
5
6
7
1. Bruguiera gymnormiza
2. Avicennia marina
3. Lumnitzera racemosa
4. Rhizophora mucronata
5. Sonneratia alba
6. Ceriops tagal
7. Xylocarpus granatum
The seven mangrove species currently found in the study area are:-
Literature Review
• Ozesmi et al (2002). Satellite remote sensing of wetlands.
• Rebelo et al (2009). Remote sensing and GIS for wetland inventory,
mapping and change analysis.
• Mwita et al (2013). Mapping small wetlands of Kenya and Tanzania
using remote sensing techniques.
• Jia et al (2014). Mapping the distribution of mangrove species in the
Core Zone of Mai Po Marshes Nature Reserve, Hong Kong, using
hyperspectral data and high-resolution data.
Importance of mangrove
• Mangroves are unique plant communities commonly only found along
sheltered coastlines in the tropics and subtropical.
• The global mangrove area equals to about 15.2 million hectares, with the
largest areas found in Asia and Africa.
• Mangrove aids in shoreline stabilization, reduction of coastal erosion,
sediment and nutrient retention, storm protection, flood and
flow control, conservation of biodiversity.
• The habitat, breeding and nursery grounds for many species of flora and
fauna.
• Equally, mangroves offer socio-economic functions.
Why Map
Mangroves?
Change
detection at
national &
international
level
Major loss of
the world’s
mangroves
Fill in data gaps &
provide
Inventory & monitor
species composition
and distribution
Protection,
conservation
& restoration
efforts
Poorly mapped
and lack of
recognition and
documentation
Ramsar Convention
on Wetlands
supports the
development &
application of RS &
GIS in wetland study
High quality
data available
& new
techniques
Application of RS in mangrove mapping
• Traditional and historical methods proved to be costly and time
consuming.
• Visual interpretation was the only method used.
• Difficulty to discriminate the different species.
• New emerging data, software and techniques.
• Satellite imagery up-to-date and available.
• Able to reach remote and inaccessible areas.
• Multispectral and hyperspectral imagery allows for species
discrimination at different levels and fine detailed mapping.
Status in the Seychelles
• Mangrove and wetland ecosystem are mapped only:-
- by the boundary extent.
- information include name, location and size.
• Information such as species composition, distribution and phenology
of the species not available.
• This study will provide a vector-based layer with species delineation.
• Bridge the gap with the availability of data and information about
• the mangrove species.
• Develop and provide an inventory of mangrove species.
• Offer detailed mapping capabilities of the mangrove species.
• Provide methodology and guidelines to future studies with the
application of remote sensing techniques
Data Acquisition
• Multispectral satellite imagery
- Pleiades imagery consist of:-
Panchromatic: 0.47-0.83 ųm( 0.5m);
Blue = 0.43-0.55 ųm,
Green = 0.50-0.62 ųm,
Red = 0.59-0.71 ųm,
Near Infrared = 0.74-0.94 ųm (NIR)
(2m)
• GPS points of mangrove species
- contains over 1500 sample points
- XY coordinates
- Species type
- Species status
- Growth stage
Work Done
• Data collection
- Field data collection using survey form
- Use of hand-held Garmin GPS units to record mangrove species
- Applied a random-sampling techniques based on dominance of
mangrove species over a given area
- Points downloaded & uploaded into ArcGIS
• Field survey
- Groups of four & divided into two to cover enough areas
- Survey forms, GPS units & cameras
- Protective gears – boots and wet suits
Analysis
• To analyse and compare species - by area and by zones
• Spatial statistical analyses
- Calculate areas
- Density analysis
- Mapping clusters
-Standard distance
• Accuracy assessment
- the standard way to represent map accuracy
- a confusion matrix contains overall accuracy, user’s accuracy,
producer’s accuracy, and the Kappa coefficient of the
classification results of each mangrove species
Way Forward
• Write up
• Data processing and analysis
• Produce final classification map
• Logistical issues – staffs and transportation availability
• Bad weather; rainy periods forced the survey to be
postponed/cancelled
• Tidal movements – high tide periods rendered some areas
inaccessible and difficult to reach
• As sampling based on dominance, single strands were omitted
• Top canopy of a particular mangrove species covering a ‘large’ area
but under canopy dominated by another species
Problems & Issues so far….
References
• FAO, (2007). The World's Mangroves 1980-2005.
• Heumann W. B, (2011). Satellite remote sensing of mangrove forests: Recent advances and future
opportunities. Progress in Physical Geography. Vol.35, pp.87 - 108
• Jia M, Zhang Y, Wang Z, Song K, Ren C, (2014). Mapping the distribution of mangrove species in the
Core Zone of Mai Po Marshes Nature Reserve, Hong Kong, using hyperspectral data and high-
resolution data. International Journal of Applied Earth Observation & Geoinformation. 33, pp.226-231
• Klemas, V., 2011. Remote Sensing of Wetlands: Case Studies Comparing Practical Techniques. Journal
of Coastal Research, 27(3), pp. 418-427
• Lillesand M. T, Kiefer W. R, Chipman W. J, (2008). Remote Sensing & Image Interpretation. 6th ed.
USA: John Wiley & Sons.
Mwita E, Menz G, Misana S, Becker M, Kisanga D, Boehme B, (2013).
Mapping small wetlands of Kenya and Tanzania using remote sensing techniques.
International Journal of Applied Earth Observation and Geoinformation. 21, pp.173-183
• Ozesmi L. S, Bauer E. M, (2002). Satellite remote sensing of wetlands. Wetlands Ecology and
Management. 10, pp.381-402
• Ramsar Convention on Wetlands (2012). Wetland Tourism Case Study: Seychelles - Port Launay.
[ONLINE] Available at:
http://www.ramsar.org/cda/en/ramsarwetlandtourismcasestudiestoc/main/ramsar/1%5E25751_400
0_0__. [Last Accessed 22 April 2014].
• Rebelo L.M, Finlayson C.M, Nagabhatla, (2009). Remote sensing and GIS for wetland inventory,
mapping and change analysis. Journal of Environmental Management. 90 (7), pp.2147-2153
THANK YOU FOR LISTENING.
You Are Most Welcome To Join Me For The Continuation of
the Project…  

MappingMangroves

  • 1.
    Mapping the mangrovespecies using remote sensing techniques: A case study in the Seychelles Presented by Alvin Alcindor, Kingston University November 2014
  • 2.
    • Aims &Objectives • Study area • Literature review • Importance of mangroves • Why Map Mangroves? • Application of remote sensing in mapping mangroves • Status in Seychelles • Data Acquisition & Work Done • Analysis • Way Forward • Problems & Issues • References Overview
  • 3.
    Aims & Objectives •to identify and map the mangrove species using remote sensing (RS) techniques, • to develop an inventory for the mangrove ecosystem, • to determine the potential of using multi-spectral data for distinguishing and mapping the mangrove species • to develop methodology and guidelines that can be replicable in other fields of RS study in Seychelles and in other Small Island Development States (SIDS).
  • 4.
    Sources:- ESRI, GEBCO,NOAA, NGDC, Google Earth • Port Launay wetland located on western coast of Mahe. • Designated as a Ramsar site (recognised in Nov.2004) and covers an area of 120.6 hectares. • One of the highest-diversity mangrove in the Seychelles.
  • 5.
    1 2 4 3 5 6 7 1. Bruguiera gymnormiza 2.Avicennia marina 3. Lumnitzera racemosa 4. Rhizophora mucronata 5. Sonneratia alba 6. Ceriops tagal 7. Xylocarpus granatum The seven mangrove species currently found in the study area are:-
  • 6.
    Literature Review • Ozesmiet al (2002). Satellite remote sensing of wetlands. • Rebelo et al (2009). Remote sensing and GIS for wetland inventory, mapping and change analysis. • Mwita et al (2013). Mapping small wetlands of Kenya and Tanzania using remote sensing techniques. • Jia et al (2014). Mapping the distribution of mangrove species in the Core Zone of Mai Po Marshes Nature Reserve, Hong Kong, using hyperspectral data and high-resolution data.
  • 7.
    Importance of mangrove •Mangroves are unique plant communities commonly only found along sheltered coastlines in the tropics and subtropical. • The global mangrove area equals to about 15.2 million hectares, with the largest areas found in Asia and Africa. • Mangrove aids in shoreline stabilization, reduction of coastal erosion, sediment and nutrient retention, storm protection, flood and flow control, conservation of biodiversity. • The habitat, breeding and nursery grounds for many species of flora and fauna. • Equally, mangroves offer socio-economic functions.
  • 8.
    Why Map Mangroves? Change detection at national& international level Major loss of the world’s mangroves Fill in data gaps & provide Inventory & monitor species composition and distribution Protection, conservation & restoration efforts Poorly mapped and lack of recognition and documentation Ramsar Convention on Wetlands supports the development & application of RS & GIS in wetland study High quality data available & new techniques
  • 9.
    Application of RSin mangrove mapping • Traditional and historical methods proved to be costly and time consuming. • Visual interpretation was the only method used. • Difficulty to discriminate the different species. • New emerging data, software and techniques. • Satellite imagery up-to-date and available. • Able to reach remote and inaccessible areas. • Multispectral and hyperspectral imagery allows for species discrimination at different levels and fine detailed mapping.
  • 10.
    Status in theSeychelles • Mangrove and wetland ecosystem are mapped only:- - by the boundary extent. - information include name, location and size. • Information such as species composition, distribution and phenology of the species not available. • This study will provide a vector-based layer with species delineation. • Bridge the gap with the availability of data and information about • the mangrove species. • Develop and provide an inventory of mangrove species. • Offer detailed mapping capabilities of the mangrove species. • Provide methodology and guidelines to future studies with the application of remote sensing techniques
  • 11.
    Data Acquisition • Multispectralsatellite imagery - Pleiades imagery consist of:- Panchromatic: 0.47-0.83 ųm( 0.5m); Blue = 0.43-0.55 ųm, Green = 0.50-0.62 ųm, Red = 0.59-0.71 ųm, Near Infrared = 0.74-0.94 ųm (NIR) (2m) • GPS points of mangrove species - contains over 1500 sample points - XY coordinates - Species type - Species status - Growth stage
  • 12.
    Work Done • Datacollection - Field data collection using survey form - Use of hand-held Garmin GPS units to record mangrove species - Applied a random-sampling techniques based on dominance of mangrove species over a given area - Points downloaded & uploaded into ArcGIS • Field survey - Groups of four & divided into two to cover enough areas - Survey forms, GPS units & cameras - Protective gears – boots and wet suits
  • 14.
    Analysis • To analyseand compare species - by area and by zones • Spatial statistical analyses - Calculate areas - Density analysis - Mapping clusters -Standard distance • Accuracy assessment - the standard way to represent map accuracy - a confusion matrix contains overall accuracy, user’s accuracy, producer’s accuracy, and the Kappa coefficient of the classification results of each mangrove species
  • 15.
    Way Forward • Writeup • Data processing and analysis • Produce final classification map
  • 16.
    • Logistical issues– staffs and transportation availability • Bad weather; rainy periods forced the survey to be postponed/cancelled • Tidal movements – high tide periods rendered some areas inaccessible and difficult to reach • As sampling based on dominance, single strands were omitted • Top canopy of a particular mangrove species covering a ‘large’ area but under canopy dominated by another species Problems & Issues so far….
  • 17.
    References • FAO, (2007).The World's Mangroves 1980-2005. • Heumann W. B, (2011). Satellite remote sensing of mangrove forests: Recent advances and future opportunities. Progress in Physical Geography. Vol.35, pp.87 - 108 • Jia M, Zhang Y, Wang Z, Song K, Ren C, (2014). Mapping the distribution of mangrove species in the Core Zone of Mai Po Marshes Nature Reserve, Hong Kong, using hyperspectral data and high- resolution data. International Journal of Applied Earth Observation & Geoinformation. 33, pp.226-231 • Klemas, V., 2011. Remote Sensing of Wetlands: Case Studies Comparing Practical Techniques. Journal of Coastal Research, 27(3), pp. 418-427 • Lillesand M. T, Kiefer W. R, Chipman W. J, (2008). Remote Sensing & Image Interpretation. 6th ed. USA: John Wiley & Sons. Mwita E, Menz G, Misana S, Becker M, Kisanga D, Boehme B, (2013). Mapping small wetlands of Kenya and Tanzania using remote sensing techniques. International Journal of Applied Earth Observation and Geoinformation. 21, pp.173-183 • Ozesmi L. S, Bauer E. M, (2002). Satellite remote sensing of wetlands. Wetlands Ecology and Management. 10, pp.381-402 • Ramsar Convention on Wetlands (2012). Wetland Tourism Case Study: Seychelles - Port Launay. [ONLINE] Available at: http://www.ramsar.org/cda/en/ramsarwetlandtourismcasestudiestoc/main/ramsar/1%5E25751_400 0_0__. [Last Accessed 22 April 2014]. • Rebelo L.M, Finlayson C.M, Nagabhatla, (2009). Remote sensing and GIS for wetland inventory, mapping and change analysis. Journal of Environmental Management. 90 (7), pp.2147-2153
  • 18.
    THANK YOU FORLISTENING. You Are Most Welcome To Join Me For The Continuation of the Project…  