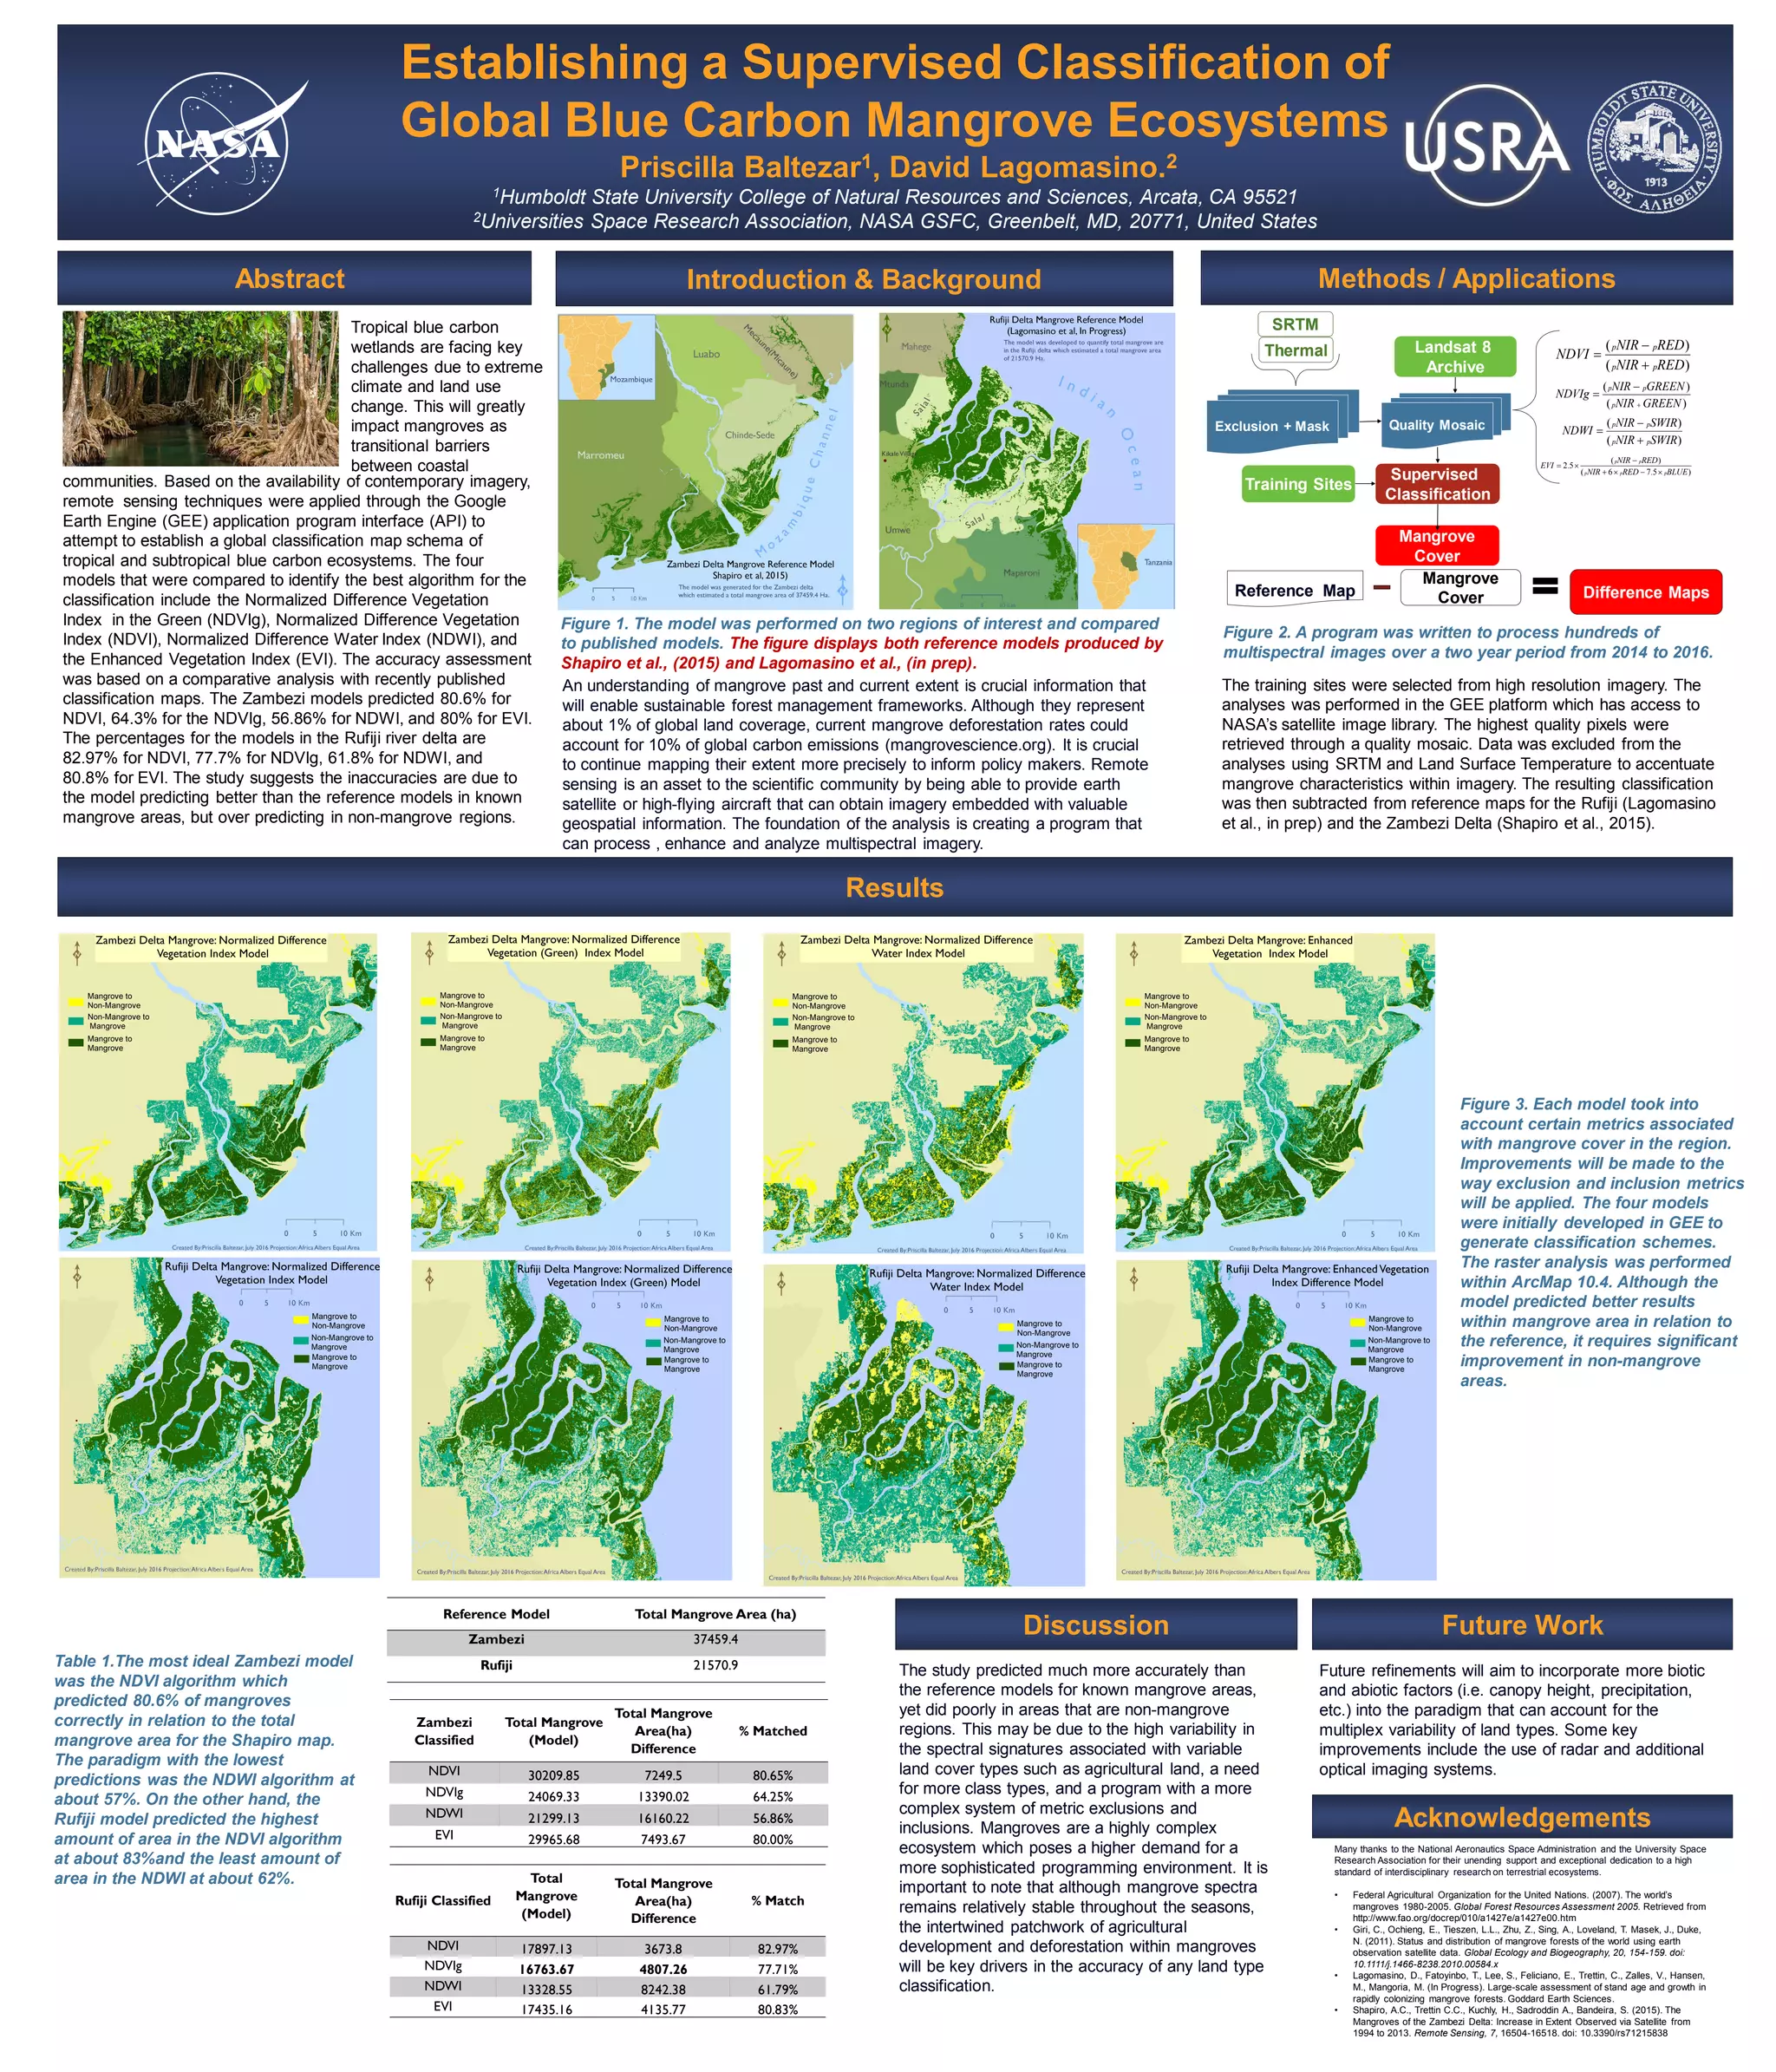
Establishing a Supervised Classification of
Global Blue Carbon Mangrove Ecosystems
Priscilla Baltezar1, David Lagomasino.2
1Humboldt State University College of Natural Resources and Sciences, Arcata, CA 95521
2Universities Space Research Association, NASA GSFC, Greenbelt, MD, 20771, United States
communities. Based on the availability of contemporary imagery,
remote sensing techniques were applied through the Google
Earth Engine (GEE) application program interface (API) to
attempt to establish a global classification map schema of
tropical and subtropical blue carbon ecosystems. The four
models that were compared to identify the best algorithm for the
classification include the Normalized Difference Vegetation
Index in the Green (NDVIg), Normalized Difference Vegetation
Index (NDVI), Normalized Difference Water Index (NDWI), and
the Enhanced Vegetation Index (EVI). The accuracy assessment
was based on a comparative analysis with recently published
classification maps. The Zambezi models predicted 80.6% for
NDVI, 64.3% for the NDVIg, 56.86% for NDWI, and 80% for EVI.
The percentages for the models in the Rufiji river delta are
82.97% for NDVI, 77.7% for NDVIg, 61.8% for NDWI, and
80.8% for EVI. The study suggests the inaccuracies are due to
the model predicting better than the reference models in known
mangrove areas, but over predicting in non-mangrove regions.
Introduction & BackgroundAbstract
Rufiji Classified
Total
Mangrove
(Model)
Total Mangrove
Area(ha)
Difference
% Match
NDVI 17897.13 3673.8 82.97%
NDVIg 16763.67 4807.26 77.71%
NDWI 13328.55 8242.38 61.79%
EVI 17435.16 4135.77 80.83%
Methods / Applications
An understanding of mangrove past and current extent is crucial information that
will enable sustainable forest management frameworks. Although they represent
about 1% of global land coverage, current mangrove deforestation rates could
account for 10% of global carbon emissions (mangrovescience.org). It is crucial
to continue mapping their extent more precisely to inform policy makers. Remote
sensing is an asset to the scientific community by being able to provide earth
satellite or high-flying aircraft that can obtain imagery embedded with valuable
geospatial information. The foundation of the analysis is creating a program that
can process , enhance and analyze multispectral imagery.
Figure 1. The model was performed on two regions of interest and compared
to published models. The figure displays both reference models produced by
Shapiro et al., (2015) and Lagomasino et al., (in prep).
Thermal
SRTM
)(
)(
SWIRNIR
SWIRNIR
NDWI
pp
pp



)(
)(
REDNIR
REDNIR
NDVI
pp
pp



)5.76(
)(
5.2
BLUEREDNIR
REDNIR
EVI
ppp
pp



)(
)(
GREENNIR
GREENNIR
NDVIg
p
pp



Mangrove
Cover
Landsat 8
Archive
Training Sites
Quality Mosaic
Supervised
Classification
Exclusion + Mask
Mangrove
CoverReference Map Difference Maps
Figure 2. A program was written to process hundreds of
multispectral images over a two year period from 2014 to 2016.
Reference Model Total Mangrove Area (ha)
Zambezi 37459.4
Rufiji 21570.9
Zambezi
Classified
Total Mangrove
(Model)
Total Mangrove
Area(ha)
Difference
% Matched
NDVI 30209.85 7249.5 80.65%
NDVIg 24069.33 13390.02 64.25%
NDWI 21299.13 16160.22 56.86%
EVI 29965.68 7493.67 80.00%
The training sites were selected from high resolution imagery. The
analyses was performed in the GEE platform which has access to
NASA’s satellite image library. The highest quality pixels were
retrieved through a quality mosaic. Data was excluded from the
analyses using SRTM and Land Surface Temperature to accentuate
mangrove characteristics within imagery. The resulting classification
was then subtracted from reference maps for the Rufiji (Lagomasino
et al., in prep) and the Zambezi Delta (Shapiro et al., 2015).
Results
The study predicted much more accurately than
the reference models for known mangrove areas,
yet did poorly in areas that are non-mangrove
regions. This may be due to the high variability in
the spectral signatures associated with variable
land cover types such as agricultural land, a need
for more class types, and a program with a more
complex system of metric exclusions and
inclusions. Mangroves are a highly complex
ecosystem which poses a higher demand for a
more sophisticated programming environment. It is
important to note that although mangrove spectra
remains relatively stable throughout the seasons,
the intertwined patchwork of agricultural
development and deforestation within mangroves
will be key drivers in the accuracy of any land type
classification.
Acknowledgements
Many thanks to the National Aeronautics Space Administration and the University Space
Research Association for their unending support and exceptional dedication to a high
standard of interdisciplinary research on terrestrial ecosystems.
• Federal Agricultural Organization for the United Nations. (2007). The world’s
mangroves 1980-2005. Global Forest Resources Assessment 2005. Retrieved from
http://www.fao.org/docrep/010/a1427e/a1427e00.htm
• Giri, C., Ochieng, E., Tieszen, L.L., Zhu, Z., Sing, A., Loveland, T. Masek, J., Duke,
N. (2011). Status and distribution of mangrove forests of the world using earth
observation satellite data. Global Ecology and Biogeography, 20, 154-159. doi:
10.1111/j.1466-8238.2010.00584.x
• Lagomasino, D., Fatoyinbo, T., Lee, S., Feliciano, E., Trettin, C., Zalles, V., Hansen,
M., Mangoria, M. (In Progress). Large-scale assessment of stand age and growth in
rapidly colonizing mangrove forests. Goddard Earth Sciences.
• Shapiro, A.C., Trettin C.C., Kuchly, H., Sadroddin A., Bandeira, S. (2015). The
Mangroves of the Zambezi Delta: Increase in Extent Observed via Satellite from
1994 to 2013. Remote Sensing, 7, 16504-16518. doi: 10.3390/rs71215838
Figure 3. Each model took into
account certain metrics associated
with mangrove cover in the region.
Improvements will be made to the
way exclusion and inclusion metrics
will be applied. The four models
were initially developed in GEE to
generate classification schemes.
The raster analysis was performed
within ArcMap 10.4. Although the
model predicted better results
within mangrove area in relation to
the reference, it requires significant
improvement in non-mangrove
areas.
Table 1.The most ideal Zambezi model
was the NDVI algorithm which
predicted 80.6% of mangroves
correctly in relation to the total
mangrove area for the Shapiro map.
The paradigm with the lowest
predictions was the NDWI algorithm at
about 57%. On the other hand, the
Rufiji model predicted the highest
amount of area in the NDVI algorithm
at about 83%and the least amount of
area in the NDWI at about 62%.
Tropical blue carbon
wetlands are facing key
challenges due to extreme
climate and land use
change. This will greatly
impact mangroves as
transitional barriers
between coastal
Future refinements will aim to incorporate more biotic
and abiotic factors (i.e. canopy height, precipitation,
etc.) into the paradigm that can account for the
multiplex variability of land types. Some key
improvements include the use of radar and additional
optical imaging systems.
Future WorkDiscussion

BaltezarMangroves2016Final

  • 1.
    Establishing a SupervisedClassification of Global Blue Carbon Mangrove Ecosystems Priscilla Baltezar1, David Lagomasino.2 1Humboldt State University College of Natural Resources and Sciences, Arcata, CA 95521 2Universities Space Research Association, NASA GSFC, Greenbelt, MD, 20771, United States communities. Based on the availability of contemporary imagery, remote sensing techniques were applied through the Google Earth Engine (GEE) application program interface (API) to attempt to establish a global classification map schema of tropical and subtropical blue carbon ecosystems. The four models that were compared to identify the best algorithm for the classification include the Normalized Difference Vegetation Index in the Green (NDVIg), Normalized Difference Vegetation Index (NDVI), Normalized Difference Water Index (NDWI), and the Enhanced Vegetation Index (EVI). The accuracy assessment was based on a comparative analysis with recently published classification maps. The Zambezi models predicted 80.6% for NDVI, 64.3% for the NDVIg, 56.86% for NDWI, and 80% for EVI. The percentages for the models in the Rufiji river delta are 82.97% for NDVI, 77.7% for NDVIg, 61.8% for NDWI, and 80.8% for EVI. The study suggests the inaccuracies are due to the model predicting better than the reference models in known mangrove areas, but over predicting in non-mangrove regions. Introduction & BackgroundAbstract Rufiji Classified Total Mangrove (Model) Total Mangrove Area(ha) Difference % Match NDVI 17897.13 3673.8 82.97% NDVIg 16763.67 4807.26 77.71% NDWI 13328.55 8242.38 61.79% EVI 17435.16 4135.77 80.83% Methods / Applications An understanding of mangrove past and current extent is crucial information that will enable sustainable forest management frameworks. Although they represent about 1% of global land coverage, current mangrove deforestation rates could account for 10% of global carbon emissions (mangrovescience.org). It is crucial to continue mapping their extent more precisely to inform policy makers. Remote sensing is an asset to the scientific community by being able to provide earth satellite or high-flying aircraft that can obtain imagery embedded with valuable geospatial information. The foundation of the analysis is creating a program that can process , enhance and analyze multispectral imagery. Figure 1. The model was performed on two regions of interest and compared to published models. The figure displays both reference models produced by Shapiro et al., (2015) and Lagomasino et al., (in prep). Thermal SRTM )( )( SWIRNIR SWIRNIR NDWI pp pp    )( )( REDNIR REDNIR NDVI pp pp    )5.76( )( 5.2 BLUEREDNIR REDNIR EVI ppp pp    )( )( GREENNIR GREENNIR NDVIg p pp    Mangrove Cover Landsat 8 Archive Training Sites Quality Mosaic Supervised Classification Exclusion + Mask Mangrove CoverReference Map Difference Maps Figure 2. A program was written to process hundreds of multispectral images over a two year period from 2014 to 2016. Reference Model Total Mangrove Area (ha) Zambezi 37459.4 Rufiji 21570.9 Zambezi Classified Total Mangrove (Model) Total Mangrove Area(ha) Difference % Matched NDVI 30209.85 7249.5 80.65% NDVIg 24069.33 13390.02 64.25% NDWI 21299.13 16160.22 56.86% EVI 29965.68 7493.67 80.00% The training sites were selected from high resolution imagery. The analyses was performed in the GEE platform which has access to NASA’s satellite image library. The highest quality pixels were retrieved through a quality mosaic. Data was excluded from the analyses using SRTM and Land Surface Temperature to accentuate mangrove characteristics within imagery. The resulting classification was then subtracted from reference maps for the Rufiji (Lagomasino et al., in prep) and the Zambezi Delta (Shapiro et al., 2015). Results The study predicted much more accurately than the reference models for known mangrove areas, yet did poorly in areas that are non-mangrove regions. This may be due to the high variability in the spectral signatures associated with variable land cover types such as agricultural land, a need for more class types, and a program with a more complex system of metric exclusions and inclusions. Mangroves are a highly complex ecosystem which poses a higher demand for a more sophisticated programming environment. It is important to note that although mangrove spectra remains relatively stable throughout the seasons, the intertwined patchwork of agricultural development and deforestation within mangroves will be key drivers in the accuracy of any land type classification. Acknowledgements Many thanks to the National Aeronautics Space Administration and the University Space Research Association for their unending support and exceptional dedication to a high standard of interdisciplinary research on terrestrial ecosystems. • Federal Agricultural Organization for the United Nations. (2007). The world’s mangroves 1980-2005. Global Forest Resources Assessment 2005. Retrieved from http://www.fao.org/docrep/010/a1427e/a1427e00.htm • Giri, C., Ochieng, E., Tieszen, L.L., Zhu, Z., Sing, A., Loveland, T. Masek, J., Duke, N. (2011). Status and distribution of mangrove forests of the world using earth observation satellite data. Global Ecology and Biogeography, 20, 154-159. doi: 10.1111/j.1466-8238.2010.00584.x • Lagomasino, D., Fatoyinbo, T., Lee, S., Feliciano, E., Trettin, C., Zalles, V., Hansen, M., Mangoria, M. (In Progress). Large-scale assessment of stand age and growth in rapidly colonizing mangrove forests. Goddard Earth Sciences. • Shapiro, A.C., Trettin C.C., Kuchly, H., Sadroddin A., Bandeira, S. (2015). The Mangroves of the Zambezi Delta: Increase in Extent Observed via Satellite from 1994 to 2013. Remote Sensing, 7, 16504-16518. doi: 10.3390/rs71215838 Figure 3. Each model took into account certain metrics associated with mangrove cover in the region. Improvements will be made to the way exclusion and inclusion metrics will be applied. The four models were initially developed in GEE to generate classification schemes. The raster analysis was performed within ArcMap 10.4. Although the model predicted better results within mangrove area in relation to the reference, it requires significant improvement in non-mangrove areas. Table 1.The most ideal Zambezi model was the NDVI algorithm which predicted 80.6% of mangroves correctly in relation to the total mangrove area for the Shapiro map. The paradigm with the lowest predictions was the NDWI algorithm at about 57%. On the other hand, the Rufiji model predicted the highest amount of area in the NDVI algorithm at about 83%and the least amount of area in the NDWI at about 62%. Tropical blue carbon wetlands are facing key challenges due to extreme climate and land use change. This will greatly impact mangroves as transitional barriers between coastal Future refinements will aim to incorporate more biotic and abiotic factors (i.e. canopy height, precipitation, etc.) into the paradigm that can account for the multiplex variability of land types. Some key improvements include the use of radar and additional optical imaging systems. Future WorkDiscussion