
Recommended
More Related Content
What's hot
What's hot (20)
Similar to Topographic Map Presentation
Similar to Topographic Map Presentation (20)
More from dwinter1
More from dwinter1 (20)
Recently uploaded
Recently uploaded (20)
Topographic Map Presentation
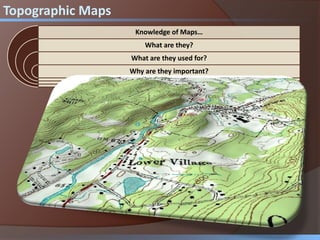
- 1. Knowledge of Maps… What are they? What are they used for? Why are they important? Topographic Maps
- 4. Maps that show the change in elevation of land. Elevation is the height of land above the level of the sea. Elevation is shown by contour lines. Topographic Maps
- 5. Mr. Fetch’s Earth Science Classroom
- 6. Lines on a map that connect points of equal elevation Every point on a contour line has the same elevation. Contour lines NEVER touch. Contour Lines
- 7. Imagine it this way…. Rising water and Spray Paint ! Every time the water rose, we painted the level of the water. We also plotted the elevation of the water. When the water receded, we were left with the paint rings. We just created contour lines. Everywhere on the line is equal in elevation. Look down from above to visualize a topographic map.
- 8. Topographic Map (as seen from above) Actual Land Where the lines Come From
- 9. The darker, thicker contour lines are called: INDEX CONTOURS 0 50 100 100 Typically every 5th line on a Topo map is an index contour. Index Contours
- 10. •Helps us to see the actual shape of land. •Follow these simple steps to draw a profile: 252015105 5 10 15 20 25 Topographic Profile
- 11. •Helps us to see the actual shape of land. •Follow these simple steps to draw a profile: 252015105 5 10 15 20 25 Topographic Profile
- 14. Find an index contour. Find the index contour line right BELOW the one you just found. Subtract the two index contours. Divide that number by 5 (or the number of contour lines between the two index contours). Contour Intervals •The word interval means THE DIFFERENCE BETWEEN. •When you go from contour line to another the elevation changes. •The difference in elevation from one line to another is called the CONTOUR INTERVAL.
- 15. 0 50 100 100 50 50 50 5 = 10 Contour Intervals
- 16. •Shown by V-shaped contour lines. •V’s point in the direction water is COMING FROM. Water always moves from up high…to down low (higher contours to lower contours). NORTH SOUTH Rivers and Streams
- 17. North South
- 18. What do we notice about the shape of the land and the arrangement of contours? 252015105 Shape of the Land
- 19. 252015105 5 5 25 GENTLE SLOPES: Contour lines are far apart. STEEP SLOPES: Contour lines are close together. Steep and Gentle Slopes
- 20. Shown by closed-circles o A hill: land that raises up-hill. o A Basin: a depression in the ground shown by hachure lines. When you see “hachure marks” you’re looking at a depression. Example: A VOLCANO !!! Hills and Basins Hachure Lines: • Hachure lines are regular contour lines with small segments sticking out from it. • The first hachure line is at the same elevation as the contour line before it. 120 120 140
- 24. Reading in-between the lines … • What is the elevation at point A? = 20’ • What is the elevation at point B? = 90’ 0 50 100 Topographic Maps
- 25. Reading in-between the lines … • What would the terrain look like if you were to walk from point A to point B? Down hill, then up hill. 100 50 100 Topographic Maps
- 26. Reading in-between the lines … • What would the terrain look like if you were to walk from point A to point B? Up hill. 0 50 100 Topographic Maps
- 27. Map Scales o Maps are not LIFE-SIZE. o A scale converts the size of something on a map to its actual size in real life. A ratio, such as 1:80,000 (spoken as 1 to 80,000) means: That for 1 unit on a map = 80,000 units in real life. Map Scale: 1: 80,000 = 1 inch Example: Look at the map below. o The scale is 1:80,000 o I measure a distance of 1 inch between both rivers. o But in real life, the rivers are: ___________________ ? 0 50 100 100 Map Scale: 1: 80,000 So, If a map scale is, for example, 1:45,000…. Then: 1 cm = __________________ cm 1 paper clip = _________________ paper clips 1 ft = _________________________ ft. Map Scales
- 28. •Helps us to see the actual shape of land. •Follow these simple steps to draw a profile: 252015105 5 10 15 20 25 Topographic Profile
- 29. SLOPE • The slope of a line indicates the topography’s steepness. Distance km E l e v a t i o n “The steeper the slant, the greater the slope” ft.
- 30. SLOPE = RISE (Y) / RUN (X) Rise (Elevation) Run (Distance) Distance km E l e v a t i o n 0 1 2 3 4 5 6 7 8 9 0 1 2 4 3 5 6 7 10 8 252015105 ft.
- 31. What is the slope of A – B? 0 50 100 Map Scale: = 1 km
- 32. Calculate slope of all the lines Slope = Rise (Contour Lines) Run (Map Scale) Slope = 90 ft – 20 ft = 70 ft 1 km 1 km Slope = 70ft/km