![T. Craig Lunsford Associate Director, Sales Analysis Quintiles Global Sales [email_address]](https://image.slidesharecdn.com/information-peer-pressure-26998/85/Information-Peer-Pressure-7-320.jpg)
![Michael A. Senske President & CEO [email_address]](https://image.slidesharecdn.com/information-peer-pressure-26998/85/Information-Peer-Pressure-15-320.jpg)
![Tom Thomas Sales Operations Lead Management [email_address]](https://image.slidesharecdn.com/information-peer-pressure-26998/85/Information-Peer-Pressure-23-320.jpg)
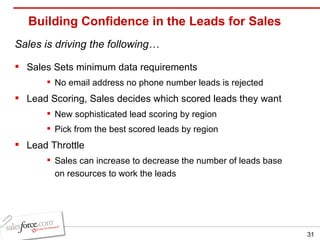

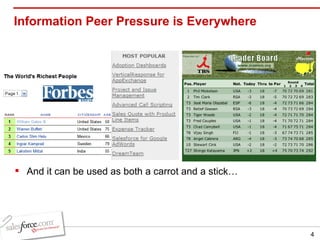
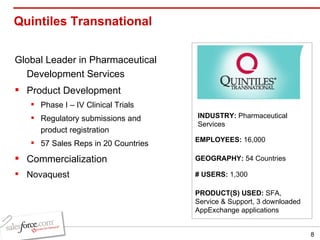
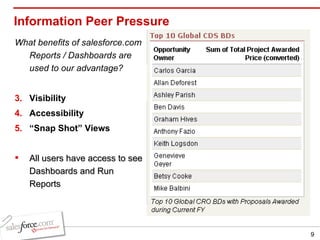
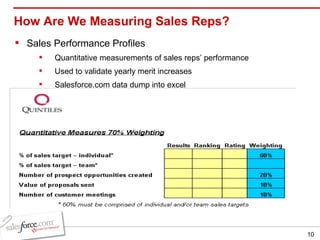
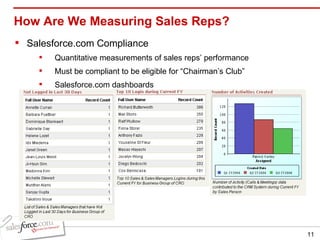
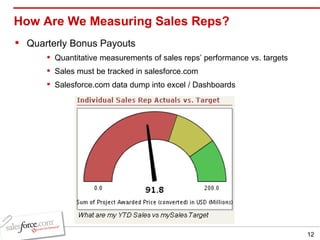
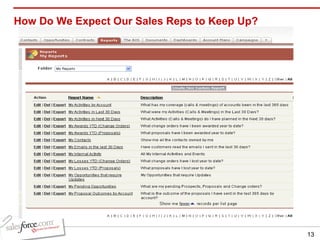
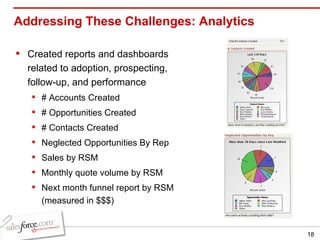
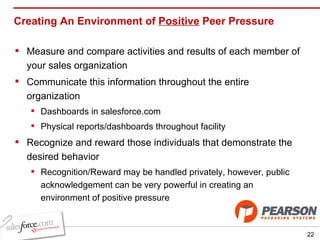
The document discusses using information peer pressure to drive sales performance. It provides examples from two companies - Quintiles and Pearson Packaging. Both companies created reports and dashboards in Salesforce to increase visibility into reps' activities and performance. This transparency created positive peer pressure and competition, driving behaviors like increased prospecting, follow up and use of Salesforce.