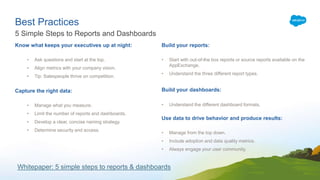
This document provides best practices for creating and using sales reports and dashboards. It discusses starting with out-of-the-box reports, understanding the different report and dashboard types, using data to drive behavior and results, knowing what metrics are important to executives, and capturing the right data. It emphasizes limiting the number of reports and dashboards, having a clear naming strategy, and determining appropriate security and access. The document recommends engaging users and including adoption and data quality metrics.
Dreamforce 2013 Salesforce Fundamentals: Strategy for Opportunity ManagementDeepa Patel
Dreamforce 2013 Presentation for Salesforce Fundamentals: Strategy for Opportunity Management. Presented by Deepa Patel, Halak Consulting, LLC, Shell Black, Shell Black LLC, Maria Beli, Case Partners, Bryan Boroughf, Monday Call
Get a smarter CRM for small businesses - Leadforce is the smarter, modern-day CRM. If you’re tired of spending time navigating a big and complex system and getting bogged down on complicated pricing structures, Leadforce might be right for you.
DF13 Salesforce Fundamentals: Strategy for Campaign and Lead ManagementDeepa Patel
Dreamforce 2013 Salesforce Fundamentals: Strategy for Campaign and Lead Management presentation slide deck Presented by Deepa Patel, Halak Consulting, LLC, Shell Black, Shell Black, LLC, Maria Beli, CASE Partners, Bryan Boroughf, Monday Call
Expert Blog PPT: Salesforce High-Velocity Sales for OpportunitiesCloud Analogy
Salesforce High-Velocity Sales is a simplified solution meant to accelerate the sales process for inside sales teams (including sales development and business development people).
SalesLoft + Captora: Solving the $5.4 Million ProblemSalesLoft
Captora is helping marketers scale and optimize their digital campaigns through competitive and real-time buyer intelligence. This marketing platform makes it easy to interpret buying signals from conversion-ready buyers who may have otherwise have been overlooked.
In September 2014 the sales development team at Captora — frustrated by inefficiencies — started using SalesLoft to maximize their efficiency in setting qualified appointments and demos.
See how Captora generated $5.4 million in their pipeline after implementing the SalesLoft solution: Sal.es/Captora
Salesforce’s integrated solutions allow employees to work with greater productivity and at decreased expenses. Collaborative forecasting to make an estimate chain of command in which the sales managers view the forecasts of their subordinates and create collective reports. Win rates (or close rates) characterize your sales group's productivity in bringing greatest number of deals out of the aggregate number of proposals made. Know about salesforce Solution visit here http://bit.ly/1QlNodY.
SANeForce provides SFE, SFA, CRM, CLM services for pharmaceutical, FMCG and healthcare organizations, our services provides data to access the salesforce performance with regard to attendance complete analyses, sample, input, expenses, sales, and period. Field force can now submit their daily activity, monthly activity, and market feedback to the corporate office through our various tools available on desktop,
mobile, and tablets.
Benefits of Connecting Ecommerce with Microsoft Dynamics CRM and Dyncmics 365APPSeCONNECT
Benefits of connecting eCommerce with Dynamics CRM / Dynamics 365 [WEBINAR SLIDES]
Points covered in the webinar:
- What is Micrososft Dynamics CRM and Microsoft Dynamics 365 and how it can help shop owners
- Benefits of connecting Microsoft Dynamics CRM (Online and On Premise) or Dynamics 365 with eCommerce
- Introduction about Dynamics Connectors with WooCommerce and BigCommerce and Shopify
- What APPSeCONNECT can offer (example Deploy the connector, Customize Sales Cycle for dynamics CRM , Training)
- Live Demo showing Shopify integration with Dynamics CRM
- Live Demo Showing Shopify Sending Customers to Dynamics 365
- Next Connector in roadmap – Magento Integration with Dynamics CRM and SAP Business One ERP integration with Dynamics CRM & Dynamics 365
For more webinars, visit:
http://www.appseconnect.com/webinars
APPSeCONNECT is a smart integration solution that can connect all your Ecommerce stores, CRM, POS, Marketplace accounts and back office ERP under one single platform.
Get a 30 Day Free Trial at:
http://www.appseconnect.com/free-trial
Meet Pardot, your new sales and marketing secret weapon. Learn how adding marketing automation to your CRM can help optimize your lead generation and get the right leads to the right people at the right time. Move leads through the funnel and close the ROI loop faster and more efficiently.
iSEEit Opportunity Manager on salesforce.comRizan Flenner
iSEEit is the #1 Opportunity Management app for complex B2B sales. It will allow sales teams to better qualify and drive your deals to closure and give sales manager the visibility and insight to deliver on an accurate forecast. iSEEit is available as native salesforce app.
Whether you’re presenting internally to your company or if you are thinking about speaking at the next community group meeting, community conference or even Dreamforce, use these resources to learn best practices for developing an awesome presentation and demo that keeps your audience engaged, focused, and inspired.
Become a leader and trailblazer when you lead your organization into the future by migrating to Lightning! Join VP of Product Management, Shawna Wolverton, as we discuss the evolution and future of Lightning, what the Lightning Experience means for Salesforce Admins, and how to get started with it at your organization.
Metrics Worth Measuring: Align Business Goals to Salesforce AdoptionSalesforce Admins
Adoption can mean different things to different people. Aligning on the right measures is critical to success and will drive not only acceptance of Salesforce but the achievement of key business goals. By ensuring that adoption is defined by key business metrics, Admins become the keystone to a successful software rollout and a bridge to greater success for the company.
Salesforce Data Tips, Tricks & Strategy (Dreamforce 15 Session)NetStronghold
Arm yourself with both a strategy & App Cloud tips and tricks to show to your organization the importance of avoiding bad data quality. Learn Platform features and handy tricks that will equip your org to enforce data quality. This presentation provides data quality strategy as well as implementation guidelines
Similar to Best practices in creating & using sales reports & dashboards (20)
GDG Cloud Southlake #33: Boule & Rebala: Effective AppSec in SDLC using Deplo...James Anderson
Effective Application Security in Software Delivery lifecycle using Deployment Firewall and DBOM
The modern software delivery process (or the CI/CD process) includes many tools, distributed teams, open-source code, and cloud platforms. Constant focus on speed to release software to market, along with the traditional slow and manual security checks has caused gaps in continuous security as an important piece in the software supply chain. Today organizations feel more susceptible to external and internal cyber threats due to the vast attack surface in their applications supply chain and the lack of end-to-end governance and risk management.
The software team must secure its software delivery process to avoid vulnerability and security breaches. This needs to be achieved with existing tool chains and without extensive rework of the delivery processes. This talk will present strategies and techniques for providing visibility into the true risk of the existing vulnerabilities, preventing the introduction of security issues in the software, resolving vulnerabilities in production environments quickly, and capturing the deployment bill of materials (DBOM).
Speakers:
Bob Boule
Robert Boule is a technology enthusiast with PASSION for technology and making things work along with a knack for helping others understand how things work. He comes with around 20 years of solution engineering experience in application security, software continuous delivery, and SaaS platforms. He is known for his dynamic presentations in CI/CD and application security integrated in software delivery lifecycle.
Gopinath Rebala
Gopinath Rebala is the CTO of OpsMx, where he has overall responsibility for the machine learning and data processing architectures for Secure Software Delivery. Gopi also has a strong connection with our customers, leading design and architecture for strategic implementations. Gopi is a frequent speaker and well-known leader in continuous delivery and integrating security into software delivery.
Neuro-symbolic is not enough, we need neuro-*semantic*Frank van Harmelen
Neuro-symbolic (NeSy) AI is on the rise. However, simply machine learning on just any symbolic structure is not sufficient to really harvest the gains of NeSy. These will only be gained when the symbolic structures have an actual semantics. I give an operational definition of semantics as “predictable inference”.
All of this illustrated with link prediction over knowledge graphs, but the argument is general.
Kubernetes & AI - Beauty and the Beast !?! @KCD Istanbul 2024Tobias Schneck
As AI technology is pushing into IT I was wondering myself, as an “infrastructure container kubernetes guy”, how get this fancy AI technology get managed from an infrastructure operational view? Is it possible to apply our lovely cloud native principals as well? What benefit’s both technologies could bring to each other?
Let me take this questions and provide you a short journey through existing deployment models and use cases for AI software. On practical examples, we discuss what cloud/on-premise strategy we may need for applying it to our own infrastructure to get it to work from an enterprise perspective. I want to give an overview about infrastructure requirements and technologies, what could be beneficial or limiting your AI use cases in an enterprise environment. An interactive Demo will give you some insides, what approaches I got already working for real.
JMeter webinar - integration with InfluxDB and GrafanaRTTS
Watch this recorded webinar about real-time monitoring of application performance. See how to integrate Apache JMeter, the open-source leader in performance testing, with InfluxDB, the open-source time-series database, and Grafana, the open-source analytics and visualization application.
In this webinar, we will review the benefits of leveraging InfluxDB and Grafana when executing load tests and demonstrate how these tools are used to visualize performance metrics.
Length: 30 minutes
Session Overview
-------------------------------------------
During this webinar, we will cover the following topics while demonstrating the integrations of JMeter, InfluxDB and Grafana:
- What out-of-the-box solutions are available for real-time monitoring JMeter tests?
- What are the benefits of integrating InfluxDB and Grafana into the load testing stack?
- Which features are provided by Grafana?
- Demonstration of InfluxDB and Grafana using a practice web application
To view the webinar recording, go to:
https://www.rttsweb.com/jmeter-integration-webinar
Epistemic Interaction - tuning interfaces to provide information for AI supportAlan Dix
Paper presented at SYNERGY workshop at AVI 2024, Genoa, Italy. 3rd June 2024
https://alandix.com/academic/papers/synergy2024-epistemic/
As machine learning integrates deeper into human-computer interactions, the concept of epistemic interaction emerges, aiming to refine these interactions to enhance system adaptability. This approach encourages minor, intentional adjustments in user behaviour to enrich the data available for system learning. This paper introduces epistemic interaction within the context of human-system communication, illustrating how deliberate interaction design can improve system understanding and adaptation. Through concrete examples, we demonstrate the potential of epistemic interaction to significantly advance human-computer interaction by leveraging intuitive human communication strategies to inform system design and functionality, offering a novel pathway for enriching user-system engagements.
Slack (or Teams) Automation for Bonterra Impact Management (fka Social Soluti...Jeffrey Haguewood
Sidekick Solutions uses Bonterra Impact Management (fka Social Solutions Apricot) and automation solutions to integrate data for business workflows.
We believe integration and automation are essential to user experience and the promise of efficient work through technology. Automation is the critical ingredient to realizing that full vision. We develop integration products and services for Bonterra Case Management software to support the deployment of automations for a variety of use cases.
This video focuses on the notifications, alerts, and approval requests using Slack for Bonterra Impact Management. The solutions covered in this webinar can also be deployed for Microsoft Teams.
Interested in deploying notification automations for Bonterra Impact Management? Contact us at sales@sidekicksolutionsllc.com to discuss next steps.
When stars align: studies in data quality, knowledge graphs, and machine lear...
Best practices in creating & using sales reports & dashboards
1. Best Practices in Creating & Using
Sales Reports & Dashboards
Circles of Success Program
Dreamforce 2018
2. Forward-Looking Statements
Statement under the Private Securities Litigation Reform Act of 1995:
This presentation may contain forward-looking statements that involve risks, uncertainties, and assumptions. If any such uncertainties materialize
or if any of the assumptions proves incorrect, the results of salesforce.com, inc. could differ materially from the results expressed or implied by
the forward-looking statements we make. All statements other than statements of historical fact could be deemed forward-looking, including any projections of
product or service availability, subscriber growth, earnings, revenues, or other financial items and any statements regarding strategies or plans of management for
future operations, statements of belief, any statements concerning new, planned, or upgraded services or technology developments and customer contracts or use
of our services.
The risks and uncertainties referred to above include – but are not limited to – risks associated with developing and delivering new functionality for our service, new
products and services, our new business model, our past operating losses, possible fluctuations in our operating results and rate of growth, interruptions or delays
in our Web hosting, breach of our security measures, the outcome of any litigation, risks associated with completed and any possible mergers and acquisitions, the
immature market in which we operate, our relatively limited operating history, our ability to expand, retain, and motivate our employees and manage our growth,
new releases of our service and successful customer deployment, our limited history reselling non-salesforce.com products, and utilization and selling to larger
enterprise customers. Further information on potential factors that could affect the financial results of salesforce.com, inc. is included in our annual report on Form
10-K for the most recent fiscal year and in our quarterly report on Form 10-Q for the most recent fiscal quarter. These documents and others containing important
disclosures are available on the SEC Filings section of the Investor Information section of our Web site.
Any unreleased services or features referenced in this or other presentations, press releases or public statements are not currently available and may not be
delivered on time or at all. Customers who purchase our services should make the purchase decisions based upon features that are currently available.
Salesforce.com, inc. assumes no obligation and does not intend to update these forward-looking statements.
3. Customer Success Keynote:
Learn How to Get More Value from Salesforce
Thursday, September 27th, 3:00 - 4:00 pm | Moscone West, 3rd Floor
Christine Robertson
Partner, Marketing & Sales
PwC
Brian Millham
President, Customer Success at
Salesforce
Robert Newnes-Smith
VP, Enterprise Business Services
Thomson Reuters
Amber Boaz
CRM Platform Owner
Rapid7
sfdc.co/RegisterToday
4. Tweet to Win a Blaze
Pin!
Share what you learned today using
#CirclesofSuccess AND #SuccessForAll
Show your tweet to redeem* at
City View @ Metreon Level 4, Blaze’s Prize Pickup
* Quantities limited.
Limit one per person.
While supplies last.
5.
6. Welcome to the Success Community
• Engage directly with Salesforce experts
• Hear from MVPs and other customers
• Access all you need to achieve success
• Content and resources
• Circles of Success and webinars
Join the conversation
Access the Trailblazer
Community today!
salesforce.com/success
7. Agenda
• What brought you to the circle / introductions
• Best Practices – 5 Simple Steps
• Getting Started – AppExchange Reports & Dashboards
• Discussion
• Key Takeaways & Wrap Up
8. What Brought You to This Circle Today?
Common topic questions customers ask. What are yours?
When should I
convert Leads to
Opportunities?
How can I ensure we have
followed up on leads?
How can I score and
assign leads in
Salesforce?
How do I measure Sales
Effectiveness?
Can reports help
me sell more?
How do I track multiple
Sales Processes in
Salesforce?
9. Best Practices
5 Simple Steps to Reports and Dashboards
Build your reports:
• Start with out-of-the box reports or source reports available on the
AppExchange.
• Understand the three different report types.
Build your dashboards:
• Understand the different dashboard formats.
Use data to drive behavior and produce results:
• Manage from the top down.
• Include adoption and data quality metrics.
• Always engage your user community.
Know what keeps your executives up at night:
• Ask questions and start at the top.
• Align metrics with your company vision.
• Tip: Salespeople thrive on competition.
Capture the right data:
• Manage what you measure.
• Limit the number of reports and dashboards.
• Develop a clear, concise naming strategy.
• Determine security and access.
Whitepaper: 5 simple steps to reports & dashboards
10. Great dashboard pack to get you started
Sales & Marketing Dashboards
• Marketing Executive Dashboard
• Sales Executive Dashboard
• Sales Manager Dashboard
• Salesperson Dashboard
Customer Service Dashboards
• Agent Supervisor Overview Dashboard
• Service Executive Overview Dashboard
• Service KPIs Dashboard
Next Steps
• Get It Now on the AppExchange
• View sample of Salesforce CRM Dashboards in PDF
Salesforce CRM Dashboards
11. Get visibility into your sales team’s activities
Dashboards to show how a company can
analyze sales activity rates and types
against opportunities:
• Visibility of Sales Activities: Custom reports based exclusively
on the out-of-the-box application.
• Visibility of Sales Professional Work Rate: Custom Dashboard.
• Spot Neglected Opportunities & Accounts.
NEXT STEPS
- Get It now on the AppExchange.
Sales Activity Dashboard
12. Easily keep track of leads and opportunity
management
Dashboards use standard fields and objects from within
Salesforce; therefore, there is no configuration to to be
done:
• Track open and closed opportunities for the
Year/Quarter/Month.
• Maintain year over year or month over month closing trends.
• Understand and manage your inbound lead flow.
NEXT STEPS
• Get It now on the AppExchange.
Lead and Opportunity Management
13. Inspire your Sales Team with a weekly pipeline
"housekeeping" dashboard
Dashboards to display deals that have been "pushed"
multiple times, deals without recent activity and deals missing
key data:
• Sales Dashboard
• Clean Your Room
• Opportunity Cleanup
Next Steps:
Get It now on the AppExchange.
Learn the best practices for Clean Your Room! Dashboard
Clean Your Room! Dashboard
14. Report & Dashboard Discussion
Topics
• What are common issues you encounter?
• What are some best practices you use today?
15. Key Takeaways
5 Simple Steps to Reports and Dashboards
Build your reports:
• Start with out-of-the box reports or source reports available on the
AppExchange.
• Understand the three different report types.
Build your dashboards:
• Understand the different dashboard formats.
Use data to drive behavior and produce results:
• Manage from the top down.
• Include adoption and data quality metrics.
• Always engage your user community.
Know what keeps your executives up at night:
• Ask questions and start at the top.
• Align metrics with your company vision.
• Tip: Salespeople thrive on competition.
Capture the right data:
• Manage what you measure.
• Limit the number of reports and dashboards.
• Develop a clear, concise naming strategy.
• Determine security and access.
Whitepaper: 5 simple steps to reports & dashboards
17. What’s Next? Book an Accelerator!
Get Expert Help With Reports & Dashboards
Salesforce.com/Accelerators
Accelerators are available to customers with Premier/+ or Signature
Success Plans. Other terms may apply.
1-on-1 Consultation with a Certified Cloud Specialist.
Recommended:
● Sales Cloud: Insights: Insights From Your Dashboards
● Sales Cloud: Insights: Design Reports & Dashboards
● Service Cloud: Insights: Dashboard Design
● Einstein Analytics: Insights: Build Dashboards
Contact Your AE or Success Manager
18. Premier Success Drives Salesforce ROI
Reported increase over Basic Plan customers
The ROI is based on a customer survey conducted by independent, third-party Market Tools.
All other metrics are based on Premier customer metadata.
19. Welcome to the Trailblazer Community
Engage directly with Salesforce experts.
Hear from MVPs and other customers.
Access all you need to achieve success:
• Content and resources
• Circles of Success and webinars
Join the conversation
Release
Readiness
Getting
Started
Lightning
Now
Premier
Central
Access the Trailblazer
Community today!
salesforce.com/success
20. Questions? Stop by Ask an Expert
in the Success Lodge!
City View @ Metreon, Level 4
Editor's Notes
Key Takeaway:We are a publicly traded company. Please make your buying decisions only on the products commercially available from Salesforce.
Talk Track:
Before I begin, just a quick note that when considering future developments, whether by us or with any other solution provider, you should always base your purchasing decisions on what is currently available.
Register today for the Success Cloud Keynote and learn how to get more value from Salesforce.
Share what you learn today during this session to win a Blaze pin! Make sure to use the hashtag #SuccessForAll and redeem within the Success Lodge at Blaze’s Prize Pickup.
I would like to take a moment to recognize a group of customers who have been blazing a trail with Salesforce for 10 or more years - Customer KOA.
Let’s take a moment and get to know each other. What I’d like all of you to do is to tell us your name, the company you work for, and the main thing that interested you about coming to this Circle of Success today.
[Note to facilitator: If you have a small group, just go around the table. If you have a large group with multiple tables, then ask each table to go through the exercise on their own. In either case, start by introducing yourself providing your name, how long you’ve been with Salesforce, and the department you work in. You can also mention anything that excites you about the topic related to this Circle, but this is not necessary.]
Whitepaper: https://help.salesforce.com/servlet/servlet.FileDownload?file=01530000001x34wAAA.
Reports and dashboards show how you performed in the past and what’s happening at the moment— they’re key to driving success and adoption for any CRM project. The information provided by reports and dashboards is especially important in today’s environment, where it’s critical to be proactive, rather than reactive, in your approach. You want to be able to spot trends and act on them immediately. For example, a sales organization wants to know which deals were lost, which competitors are gaining ground, and whether the average time to close is increasing or decreasing. For a customer service organization, it’s important to track the average days or time to close and satisfaction. And marketing organizations want to track campaign effectiveness and ROI. To make the most of Salesforce CRM’s reporting capabilities, it’s important to plan carefully and then follow these 5 proven steps to making reports and dashboards part of your business process:
Step #1: Know what keeps your executives up at night Finding answers to critical business questions and making good decisions is vital to executives—and to their companies’ success and competitive position: Ask questions and start at the top – When designing reports and dashboards, first define what your executives—your CEO; the VPs of Sales, Marketing, Support; and your channels—need to know to run their business. What are their key metrics? What behaviors do they want to encourage? Align metrics with your company vision – Take your business objectives, determine the metrics that measure those objectives, and map those metrics to the capabilities of Salesforce CRM. For example, if forecasting and tracking large deals are important to the VP of Sales, make sure you understand the key data points that give insight into those tasks and the best frequency for reporting that data. Or if your VP of Marketing needs to track response rates, sales, trials, meetings, or campaign awareness, you need to capture that data at the campaign, campaign member, lead, and opportunity level to return meaningful metrics. Tip: Salespeople thrive on competition. If you make it possible to track their progress in relation to their peers, your overall adoption rates will go up.
Step #2: Capture the right data Your reports and dashboards are only as good as the data behind them—planning is the key to capturing and displaying the correct metrics. Identify your sources early. Consider working backwards: plan your reports first and then configure the application by adding custom fields, formulas, and so on. If your marketing team wants to see campaign effectiveness over time, for example, you’d want to track which campaigns lead to leads, opportunities, and closed/won deals. Every week, you could use snapshot reports on lead status by campaign and opportunity status by campaign to show how many leads and opportunities were received and converted from each campaign. Manage what you measure – Pick a limited number of key performance indicators (KPIs) or metrics. A third-party survey of the number of metrics used by CEOs showed that 52 percent use 5–10 metrics to manage their entire business. Limit the number of reports/dashboards – Focus on those tied to specific business objectives. Develop a clear, concise naming strategy – That approach will make report and dashboard folders easy to find. Use labels that are meaningful to your users; for example “MW Sales Team,” “Premier/Gold Support Analysts,” or “Converted Leads for Verticals Team.” For dashboard folders, start with the word “Dashboard” (Dashboard – MW Sales Team,” “Dashboard – Premier/Gold Support Analysts”). Determine security and access for the report and dashboard folders and give users access based on their job functions or roles.
Step #3: Build your reports Most customers start with a current report tracked in Excel or Access and use it as a baseline. As you begin to build reports in Salesforce CRM, there are several resources to help you get started. Start with out-of the-box reports. Salesforce.com offers standard reports across all standard objects. You can use these reports as the basis for your custom reports. Understand the three different report types and how they’re used: • Tabular reports are the simplest and fastest way to return your data in a simple list view format. Keep in mind that tabular reports can’t be used to create dashboard components. • Summary reports return your data with subtotals and other summary-level information. Summary reports are great for showing average dollar values for closed won opportunities by salesperson or number of cases by status by support representative. • Matrix reports show data summaries against both horizontal and vertical criteria; for example, total sales per sales rep per year by quarter.
Step #4: Build your dashboards When you finish planning after asking all the right questions and building your reports, you’re ready to build your dashboards. The key to building dashboards your VPs, managers, and users can’t live without is to match the dashboard metrics to a compelling business metric. Understand the different dashboard formats and what type of data is best displayed in each format: • Horizontal bar/vertical column charts are great for showing geographical data, stage or status information, or any data that’s part of a single grouping. 5 simple steps to reports and dashboards For More Information Contact your account executive to learn how we can help you accelerate your CRM success. • Pie and donut charts are useful for displaying data that shows proportions of a total, such as the number of leads by lead source. • One of the newest chart types, the funnel, is best used for showing ordered picklists such as opportunity stage, case status, or lead stage. For more information, go to Help & Training and search on chart types. Don’t reinvent the wheel! Go to the AppExchange, download the free, pre-built dashboards—such as the Lead and Opportunity Management dashboard—created by Force.com Labs, and customize them to meet your business needs. Use these dashboards to track and measure adoption, sales productivity, campaigns, lead generation, and service and support.
Step #5: Use data to drive behavior and produce results Reports and dashboards are designed to be iterative—it’s important to keep them current and relevant. To successfully roll out business metrics, good communication is key. Make it easy for your users to find, view, and access the dashboards relevant to them. Use the schedule refresh feature to ensure your users see the most recent data. And use schedule and email reports and dashboards to remind your users that their business-critical metrics are in Salesforce CRM. Manage from the top down – Encourage managers to run forecast calls directly from their dashboards. Many customers also have the following mandate for sales: “If it’s not in Salesforce, it doesn’t exist.” This directive proves to be extremely motivating for salespeople. Include adoption and data quality metrics – Include a dashboard component that tracks faulty data, such as all accounts without an industry, contacts without valid email addresses, or leads with a status of “qualified” that haven’t been converted. Again, publishing such metrics can be extremely motivating. Engage your user community – Don’t make the mistake of tracking such metrics only at the executive level—make sure your users see the same metrics on their personal dashboards. What do your users want to see? What will help them do their jobs faster and smarter? Those are the metrics that matter. For example, you could create reports and dashboards that rank salespeople by top deal or top salespeople per quarter.
Your one stop shop for GREAT example dashboards. Includes dashboards for Executives, Reps, Sales, Support and more.
Gives you best-practices dashboards and reports for your sales, marketing, and service teams—straight out of the box.
Provides comprehensive insight into organization, team, and individual performance.
Increases the CRM adoption and effectiveness of your sales and service organizations.
With these CRM dashboards, your sales and service teams can stay on top of every deal or case, and close more business on time than ever before. Sales Managers will have more visibility into open opportunities and gain greater pipeline predictability. Dashboards and reports in this package are intended to provide you with a starting point to make reporting easier in your organization. Find out more at
This dashboard shows how a Company can analyze Sales Rep's activity rates and types against Opportunities.
Visibility of Sales Activities: Custom reports based exclusively on the out-of-the-box application
Visibility of Sales Professional Work Rate: Custom Dashboard
Spot Neglected Opportunities & Accounts
This Dashboard is important to Sales Professionals who wish to have visibility of the types of Activity their Sales Teams are engaging in on Opportunities. This is particularly helpful in team selling environments where together with Account Executives the Opportunity may have Activities from Sales Consulting, Engineering and Professional Services teams.
Install lead tracking and opportunity management dashboards instantly within your salesforce.com account. These dashboards only use standard fields and objects from within salesforce.com, therefore, there is no configuration to be done. A simple download.
Track open and closed opportunities for the Year/Quarter/Month
Maintain year over year or month over month closing trends
Understand and manage your inbound lead flow
Download these 2 free dashboards to wrap visibility around Lead flow and Opportunity Management.Lead Dashboards: Track lead counts, general status, ownership, source and conversion information.Opportunity Dashboards: Track closed business for Year/Quarter/Month. Track sales closing trends, win/loss ratios, top revenue generating accounts, industries and much more!Alternatively, you can bundle the Lead and Opportunity Management Dashboards with all other FREE Dashboards, by downloading the AppExchange Dashboard Pak.http://www.salesforce.com/appexchange/detail_overview.jsp?NavCode__c=&id=a0330000003gxJ1AAI
Playing on the competitive nature of salespeople, this is one leaderboard that your reps will NOT want to be listed on.Displays deals that have been "pushed" multiple times, deals without recent activity and deals missing key data.
Sales Dashboard
Clean Your Room
Opportunity Cleanup
Inspire your Sales Team with a weekly pipeline "housekeeping" dashboard. Playing on the competitive nature of salespeople, this is one leaderboard that your reps will NOT want to be listed on.Uses a push counter trigger to determine how many times an opportunity has been pushed forward to close in a different month. Details opportunities tat are set to close in the current month, however have not had any recent activity as well as account with no activity at all. Finally, lists Opportunities that are missing key data elements, such as Next Steps, Products and Partners.Fully customizable to support your unique needs.
Whitepaper: https://help.salesforce.com/servlet/servlet.FileDownload?file=01530000001x34wAAA.
Reports and dashboards show how you performed in the past and what’s happening at the moment— they’re key to driving success and adoption for any CRM project. The information provided by reports and dashboards is especially important in today’s environment, where it’s critical to be proactive, rather than reactive, in your approach. You want to be able to spot trends and act on them immediately. For example, a sales organization wants to know which deals were lost, which competitors are gaining ground, and whether the average time to close is increasing or decreasing. For a customer service organization, it’s important to track the average days or time to close and satisfaction. And marketing organizations want to track campaign effectiveness and ROI. To make the most of Salesforce CRM’s reporting capabilities, it’s important to plan carefully and then follow these 5 proven steps to making reports and dashboards part of your business process:
Step #1: Know what keeps your executives up at night Finding answers to critical business questions and making good decisions is vital to executives—and to their companies’ success and competitive position: Ask questions and start at the top – When designing reports and dashboards, first define what your executives—your CEO; the VPs of Sales, Marketing, Support; and your channels—need to know to run their business. What are their key metrics? What behaviors do they want to encourage? Align metrics with your company vision – Take your business objectives, determine the metrics that measure those objectives, and map those metrics to the capabilities of Salesforce CRM. For example, if forecasting and tracking large deals are important to the VP of Sales, make sure you understand the key data points that give insight into those tasks and the best frequency for reporting that data. Or if your VP of Marketing needs to track response rates, sales, trials, meetings, or campaign awareness, you need to capture that data at the campaign, campaign member, lead, and opportunity level to return meaningful metrics. Tip: Salespeople thrive on competition. If you make it possible to track their progress in relation to their peers, your overall adoption rates will go up.
Step #2: Capture the right data Your reports and dashboards are only as good as the data behind them—planning is the key to capturing and displaying the correct metrics. Identify your sources early. Consider working backwards: plan your reports first and then configure the application by adding custom fields, formulas, and so on. If your marketing team wants to see campaign effectiveness over time, for example, you’d want to track which campaigns lead to leads, opportunities, and closed/won deals. Every week, you could use snapshot reports on lead status by campaign and opportunity status by campaign to show how many leads and opportunities were received and converted from each campaign. Manage what you measure – Pick a limited number of key performance indicators (KPIs) or metrics. A third-party survey of the number of metrics used by CEOs showed that 52 percent use 5–10 metrics to manage their entire business. Limit the number of reports/dashboards – Focus on those tied to specific business objectives. Develop a clear, concise naming strategy – That approach will make report and dashboard folders easy to find. Use labels that are meaningful to your users; for example “MW Sales Team,” “Premier/Gold Support Analysts,” or “Converted Leads for Verticals Team.” For dashboard folders, start with the word “Dashboard” (Dashboard – MW Sales Team,” “Dashboard – Premier/Gold Support Analysts”). Determine security and access for the report and dashboard folders and give users access based on their job functions or roles.
Step #3: Build your reports Most customers start with a current report tracked in Excel or Access and use it as a baseline. As you begin to build reports in Salesforce CRM, there are several resources to help you get started. Start with out-of the-box reports. Salesforce.com offers standard reports across all standard objects. You can use these reports as the basis for your custom reports. Understand the three different report types and how they’re used: • Tabular reports are the simplest and fastest way to return your data in a simple list view format. Keep in mind that tabular reports can’t be used to create dashboard components. • Summary reports return your data with subtotals and other summary-level information. Summary reports are great for showing average dollar values for closed won opportunities by salesperson or number of cases by status by support representative. • Matrix reports show data summaries against both horizontal and vertical criteria; for example, total sales per sales rep per year by quarter.
Step #4: Build your dashboards When you finish planning after asking all the right questions and building your reports, you’re ready to build your dashboards. The key to building dashboards your VPs, managers, and users can’t live without is to match the dashboard metrics to a compelling business metric. Understand the different dashboard formats and what type of data is best displayed in each format: • Horizontal bar/vertical column charts are great for showing geographical data, stage or status information, or any data that’s part of a single grouping. 5 simple steps to reports and dashboards For More Information Contact your account executive to learn how we can help you accelerate your CRM success. • Pie and donut charts are useful for displaying data that shows proportions of a total, such as the number of leads by lead source. • One of the newest chart types, the funnel, is best used for showing ordered picklists such as opportunity stage, case status, or lead stage. For more information, go to Help & Training and search on chart types. Don’t reinvent the wheel! Go to the AppExchange, download the free, pre-built dashboards—such as the Lead and Opportunity Management dashboard—created by Force.com Labs, and customize them to meet your business needs. Use these dashboards to track and measure adoption, sales productivity, campaigns, lead generation, and service and support.
Step #5: Use data to drive behavior and produce results Reports and dashboards are designed to be iterative—it’s important to keep them current and relevant. To successfully roll out business metrics, good communication is key. Make it easy for your users to find, view, and access the dashboards relevant to them. Use the schedule refresh feature to ensure your users see the most recent data. And use schedule and email reports and dashboards to remind your users that their business-critical metrics are in Salesforce CRM. Manage from the top down – Encourage managers to run forecast calls directly from their dashboards. Many customers also have the following mandate for sales: “If it’s not in Salesforce, it doesn’t exist.” This directive proves to be extremely motivating for salespeople. Include adoption and data quality metrics – Include a dashboard component that tracks faulty data, such as all accounts without an industry, contacts without valid email addresses, or leads with a status of “qualified” that haven’t been converted. Again, publishing such metrics can be extremely motivating. Engage your user community – Don’t make the mistake of tracking such metrics only at the executive level—make sure your users see the same metrics on their personal dashboards. What do your users want to see? What will help them do their jobs faster and smarter? Those are the metrics that matter. For example, you could create reports and dashboards that rank salespeople by top deal or top salespeople per quarter.
Need more help with Reports & Dashboards? Salesforce Accelerators are a great resources! Available to our Premier and Signature Success customers, Accelerators are short 1-on-1 consultations with Certified Cloud Specialists that help you get started or deliver advanced help. Some are quick, easy, and accomplished with just a phone call and shared computer screen. Others connect your team to senior, cross-disciplinary Salesforce specialists for deep dives unique to how you use our Platform. I’ve identified a few Accelerators that can help you with Reports & Dashboards. To book one, contact your Account Executive or success manager.
MANDATORY SLIDE
Key talking points: (please do NOT use this as the talk track - consider them as guidelines/answers to typical customer questions)
Premier Success Plans offer ongoing success resources, technical support and unlimited online training, to drive
strong user adoption
higher user productivity
and more analytics and process automation
It’s about maximizing ROI, both as you begin your journey and throughout the lifetime of your subscription.
Our customers tell us Premier Success Plans drive an 80% higher ROI on their Salesforce investment.