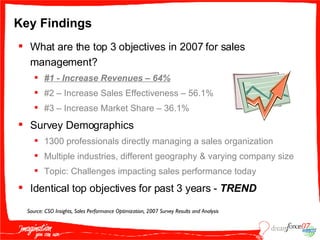
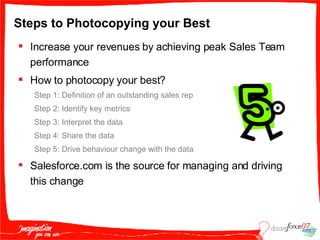
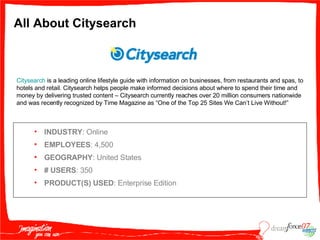
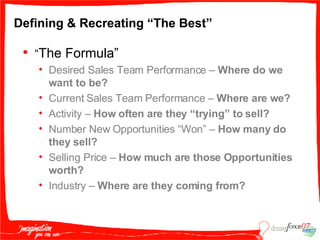
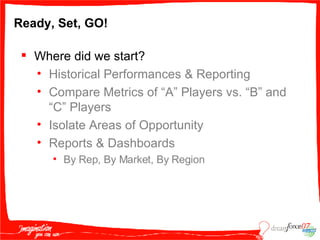
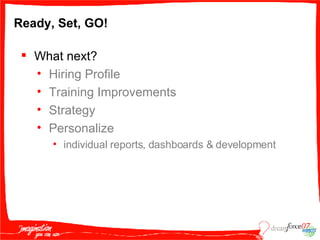
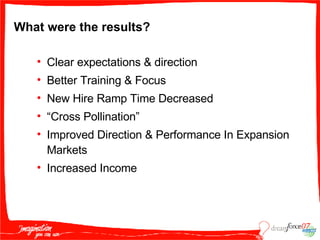
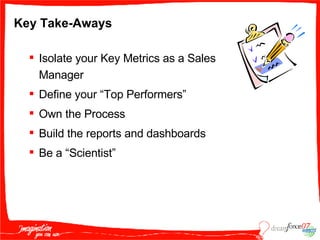
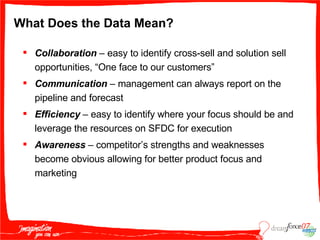
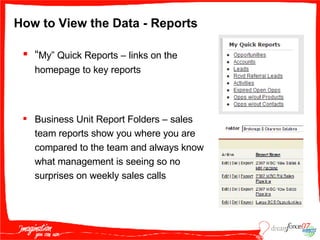
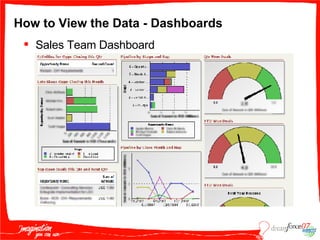
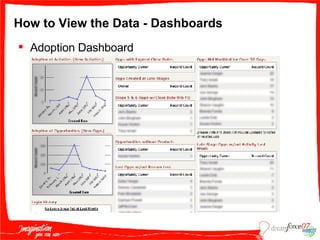
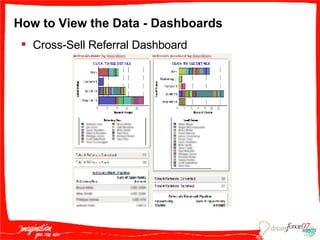
Photocopy Your Best Katrina Perano, Sungard Data Systems Carman Chan,  Salesforce.com Sales: Operations & Performance
Safe Harbor Statement “ Safe harbor” statement under the Private Securities Litigation Reform Act of 1995: This presentation may contain forward-looking statements including but not limited to statements concerning the potential market for our existing service offerings and future offerings. All of our forward looking statements involve risks, uncertainties and assumptions. If any such risks or uncertainties materialize or if any of the assumptions proves incorrect, our results could differ materially from the results expressed or implied by the forward-looking statements we make. The risks and uncertainties referred to above include - but are not limited to - risks associated with possible fluctuations in our operating results and cash flows, rate of growth and anticipated revenue run rate, errors, interruptions or delays in our service or our Web hosting, our new business model, our history of operating losses, the possibility that we will not remain profitable, breach of our security measures, the emerging market in which we operate, our relatively limited operating history, our ability to hire, retain and motivate our employees and manage our growth, competition, our ability to continue to release and gain customer acceptance of new and improved versions of our service, customer and partner acceptance of the AppExchange, successful customer deployment and utilization of our services, unanticipated changes in our effective tax rate, fluctuations in the number of shares outstanding, the price of such shares, foreign currency exchange rates and interest rates.  Further information on these and other factors that could affect our financial results is included in the reports on Forms 10-K, 10-Q and 8-K and in other filings we make with the Securities and Exchange Commission from time to time. These documents are available on the SEC Filings section of the Investor Information section of our website at  www.salesforce.com/investor . Salesforce.com, inc. assumes no obligation and does not intend to update these forward-looking statements, except as required by law.
Agenda Key Findings from Sales Organizations Steps to Photocopying your Best Customer Showcase:  Citysearch  Katrina Perano, Sungard Data Systems Recap & Summary Q&A with Speakers
Key Findings What are the top 3 objectives in 2007 for sales management? #1 - Increase Revenues – 64% #2 – Increase Sales Effectiveness – 56.1% #3 – Increase Market Share – 36.1%  Survey Demographics 1300 professionals directly managing a sales organization Multiple industries, different geography & varying company size Topic: Challenges impacting sales performance today Identical top objectives for past 3 years -  TREND Source: CSO Insights, Sales Performance Optimization, 2007 Survey Results and Analysis
Steps to Photocopying your Best  Increase your revenues by achieving peak Sales Team performance How to photocopy your best? Step 1: Definition of an outstanding sales rep Step 2: Identify key metrics Step 3: Interpret the data Step 4: Share the data Step 5: Drive behaviour change with the data Salesforce.com is the source for managing and driving this change
All About Citysearch INDUSTRY : Online EMPLOYEES : 4,500 GEOGRAPHY : United States #   USERS : 350 PRODUCT(S) USED : Enterprise Edition Citysearch  is a leading online lifestyle guide with information on businesses, from restaurants and spas, to hotels and retail. Citysearch helps people make informed decisions about where to spend their time and money by delivering trusted content – Citysearch currently reaches over 20 million consumers nationwide and was recently recognized by Time Magazine as “One of the Top 25 Sites We Can’t Live Without!”
Key Challenges Shifting Sales Objectives & New Direction Growing Sales Organization & Expansion Understanding Current Behavior Defining Training & Areas of Focus Slow Ramp Time For New Hires (60-90 days) “ The Formula”
Defining & Recreating “The Best” “ The Formula” Desired Sales Team Performance –  Where do we want to be? Current Sales Team Performance –  Where are we? Activity –  How often are they “trying” to sell? Number New Opportunities “Won” –  How many do they sell? Selling Price –  How much are those Opportunities worth? Industry –  Where are they coming from?
Ready, Set, GO! Where did we start? Historical Performances & Reporting  Compare Metrics of “A” Players vs. “B” and “C” Players  Isolate Areas of Opportunity  Reports & Dashboards  By Rep, By Market, By Region
Ready, Set, GO! What next? Hiring Profile  Training Improvements  Strategy  Personalize  individual reports, dashboards & development
What were the results? Clear expectations & direction  Better Training & Focus  New Hire Ramp Time Decreased  “ Cross Pollination”  Improved Direction & Performance In Expansion Markets Increased Income
Key Take-Aways Isolate your Key Metrics as a Sales Manager  Define your “Top Performers” Own the Process Build the reports and dashboards  Be a “Scientist”
Katrina Perano Marketing Operations, EMEA & APAC
SunGard Data Systems Global leader in integrated software and IT Services 25k customers in over 50 countries including the world's 50 largest financial services companies Supply solutions to the financial services industry, higher education and the public sector  Provide solutions to information dependant enterprises of all types to maintain the continuity of their business through information availability services  Privately Owned Company Annual revenue of $4 billion Global infrastructure spanning 50+ business units INDUSTRY:  Software & IT Services EMPLOYEES:  16000 GEOGRAPHY:  Global PRODUCT(S) USED:  SFA, Service & Support, 3 AppExchange Applications # USERS:  1000+
What Defines a Best Sales Rep? Uses SFDC to manage their pipeline not only to satisfy management, i.e.: Has key reports to know what deals to focus on – big deals, deals closing this month, new hot leads Integrates with Outlook/Notes to prioritize daily activities and have account details at his fingertips Quick to log notes after meetings Logs in daily! Uses SFDC as a resource and “wears their SunGard hat”, i.e.: Leverages key data and reports to know… What SunGard products does the account own? Who is currently meeting with this account? Is this a Global (GAM) account? Is there a cross-sell opportunity?
What are the Key Metrics? Performance  Sales closed this FQ/YTD versus quota Pipeline forecast Cross-sell referrals Adoption Open opps with expired close dates Early stage opps with close dates this FQ New business opps created at a late stage Late stage deals with no amount *Adoption metrics sent monthly to BU Executives
Focus on Activity Data The progress (or lack of progress) of a deal should be evident in the activities Activity best practices: Use Log a Call for client meetings, calls, demos and proposals, mandatory for GAM accounts and cross-sell referrals Provide a short summary of the next milestone in Next Steps Leverage Outlook/Notes Edition to associate calendar entries and emails to opportunities *  Reports used for weekly sales calls include Next Steps and Activity History
What Does the Data Mean? Collaboration   – easy to identify cross-sell and solution sell opportunities, “One face to our customers” Communication  – management can always report on the pipeline and forecast Efficiency  – easy to identify where your focus should be and leverage the resources on SFDC for execution Awareness  – competitor’s strengths and weaknesses become obvious allowing for better product focus and marketing
How to View the Data - Reports “ My” Quick Reports – links on the homepage to key reports  Business Unit Report Folders – sales team reports show you where you are compared to the team and always know what management is seeing so no surprises on weekly sales calls
How to View the Data - Dashboards Sales Team Dashboard
How to View the Data - Dashboards Adoption Dashboard
How to View the Data - Dashboards Cross-Sell Referral Dashboard
How to Use the Data to Drive Behavior Only use SFDC reports to run weekly sales calls “If it’s not in SFDC it doesn’t exist.” Display individual sales performance on team dashboards Use SFDC to drive commissions Enforce adoption metrics through executive support
Key Take-Aways By in by Senior Executives Make SFDC a Resource Know what you want defined  i.e. what is the important information Create Mandatory fields Flexible Keep requirements simple  Involve Sales Managers in the process
Summary & Recap Applicable for new hires and existing sales reps Develop a “formula” Increase collaboration & cross selling opportunities Use reports and dashboards Sales Management Involvement is Key
Session Feedback Let us know how we’re doing! Please score the session from 5 to 1 (5=excellent,1=needs improvement) in the following categories: Overall rating of the session Quality of content Strength of presentation delivery Relevance of the session to your organization We strive to improve, t hank you for filling out our survey. Additionally, please score each individual speaker on: Overall delivery of session
Questions & Answers  Katrina Perano Marketing Operations, EMEA & APAC Carman Chan Customer Success Manager

S O P006 Chan 091807

  • 1.
    Photocopy Your BestKatrina Perano, Sungard Data Systems Carman Chan, Salesforce.com Sales: Operations & Performance
  • 2.
    Safe Harbor Statement“ Safe harbor” statement under the Private Securities Litigation Reform Act of 1995: This presentation may contain forward-looking statements including but not limited to statements concerning the potential market for our existing service offerings and future offerings. All of our forward looking statements involve risks, uncertainties and assumptions. If any such risks or uncertainties materialize or if any of the assumptions proves incorrect, our results could differ materially from the results expressed or implied by the forward-looking statements we make. The risks and uncertainties referred to above include - but are not limited to - risks associated with possible fluctuations in our operating results and cash flows, rate of growth and anticipated revenue run rate, errors, interruptions or delays in our service or our Web hosting, our new business model, our history of operating losses, the possibility that we will not remain profitable, breach of our security measures, the emerging market in which we operate, our relatively limited operating history, our ability to hire, retain and motivate our employees and manage our growth, competition, our ability to continue to release and gain customer acceptance of new and improved versions of our service, customer and partner acceptance of the AppExchange, successful customer deployment and utilization of our services, unanticipated changes in our effective tax rate, fluctuations in the number of shares outstanding, the price of such shares, foreign currency exchange rates and interest rates. Further information on these and other factors that could affect our financial results is included in the reports on Forms 10-K, 10-Q and 8-K and in other filings we make with the Securities and Exchange Commission from time to time. These documents are available on the SEC Filings section of the Investor Information section of our website at www.salesforce.com/investor . Salesforce.com, inc. assumes no obligation and does not intend to update these forward-looking statements, except as required by law.
  • 3.
    Agenda Key Findingsfrom Sales Organizations Steps to Photocopying your Best Customer Showcase: Citysearch Katrina Perano, Sungard Data Systems Recap & Summary Q&A with Speakers
  • 4.
    Key Findings Whatare the top 3 objectives in 2007 for sales management? #1 - Increase Revenues – 64% #2 – Increase Sales Effectiveness – 56.1% #3 – Increase Market Share – 36.1% Survey Demographics 1300 professionals directly managing a sales organization Multiple industries, different geography & varying company size Topic: Challenges impacting sales performance today Identical top objectives for past 3 years - TREND Source: CSO Insights, Sales Performance Optimization, 2007 Survey Results and Analysis
  • 5.
    Steps to Photocopyingyour Best Increase your revenues by achieving peak Sales Team performance How to photocopy your best? Step 1: Definition of an outstanding sales rep Step 2: Identify key metrics Step 3: Interpret the data Step 4: Share the data Step 5: Drive behaviour change with the data Salesforce.com is the source for managing and driving this change
  • 6.
    All About CitysearchINDUSTRY : Online EMPLOYEES : 4,500 GEOGRAPHY : United States # USERS : 350 PRODUCT(S) USED : Enterprise Edition Citysearch is a leading online lifestyle guide with information on businesses, from restaurants and spas, to hotels and retail. Citysearch helps people make informed decisions about where to spend their time and money by delivering trusted content – Citysearch currently reaches over 20 million consumers nationwide and was recently recognized by Time Magazine as “One of the Top 25 Sites We Can’t Live Without!”
  • 7.
    Key Challenges ShiftingSales Objectives & New Direction Growing Sales Organization & Expansion Understanding Current Behavior Defining Training & Areas of Focus Slow Ramp Time For New Hires (60-90 days) “ The Formula”
  • 8.
    Defining & Recreating“The Best” “ The Formula” Desired Sales Team Performance – Where do we want to be? Current Sales Team Performance – Where are we? Activity – How often are they “trying” to sell? Number New Opportunities “Won” – How many do they sell? Selling Price – How much are those Opportunities worth? Industry – Where are they coming from?
  • 9.
    Ready, Set, GO!Where did we start? Historical Performances & Reporting Compare Metrics of “A” Players vs. “B” and “C” Players Isolate Areas of Opportunity Reports & Dashboards By Rep, By Market, By Region
  • 10.
    Ready, Set, GO!What next? Hiring Profile Training Improvements Strategy Personalize individual reports, dashboards & development
  • 11.
    What were theresults? Clear expectations & direction Better Training & Focus New Hire Ramp Time Decreased “ Cross Pollination” Improved Direction & Performance In Expansion Markets Increased Income
  • 12.
    Key Take-Aways Isolateyour Key Metrics as a Sales Manager Define your “Top Performers” Own the Process Build the reports and dashboards Be a “Scientist”
  • 13.
    Katrina Perano MarketingOperations, EMEA & APAC
  • 14.
    SunGard Data SystemsGlobal leader in integrated software and IT Services 25k customers in over 50 countries including the world's 50 largest financial services companies Supply solutions to the financial services industry, higher education and the public sector Provide solutions to information dependant enterprises of all types to maintain the continuity of their business through information availability services Privately Owned Company Annual revenue of $4 billion Global infrastructure spanning 50+ business units INDUSTRY: Software & IT Services EMPLOYEES: 16000 GEOGRAPHY: Global PRODUCT(S) USED: SFA, Service & Support, 3 AppExchange Applications # USERS: 1000+
  • 15.
    What Defines aBest Sales Rep? Uses SFDC to manage their pipeline not only to satisfy management, i.e.: Has key reports to know what deals to focus on – big deals, deals closing this month, new hot leads Integrates with Outlook/Notes to prioritize daily activities and have account details at his fingertips Quick to log notes after meetings Logs in daily! Uses SFDC as a resource and “wears their SunGard hat”, i.e.: Leverages key data and reports to know… What SunGard products does the account own? Who is currently meeting with this account? Is this a Global (GAM) account? Is there a cross-sell opportunity?
  • 16.
    What are theKey Metrics? Performance Sales closed this FQ/YTD versus quota Pipeline forecast Cross-sell referrals Adoption Open opps with expired close dates Early stage opps with close dates this FQ New business opps created at a late stage Late stage deals with no amount *Adoption metrics sent monthly to BU Executives
  • 17.
    Focus on ActivityData The progress (or lack of progress) of a deal should be evident in the activities Activity best practices: Use Log a Call for client meetings, calls, demos and proposals, mandatory for GAM accounts and cross-sell referrals Provide a short summary of the next milestone in Next Steps Leverage Outlook/Notes Edition to associate calendar entries and emails to opportunities * Reports used for weekly sales calls include Next Steps and Activity History
  • 18.
    What Does theData Mean? Collaboration – easy to identify cross-sell and solution sell opportunities, “One face to our customers” Communication – management can always report on the pipeline and forecast Efficiency – easy to identify where your focus should be and leverage the resources on SFDC for execution Awareness – competitor’s strengths and weaknesses become obvious allowing for better product focus and marketing
  • 19.
    How to Viewthe Data - Reports “ My” Quick Reports – links on the homepage to key reports Business Unit Report Folders – sales team reports show you where you are compared to the team and always know what management is seeing so no surprises on weekly sales calls
  • 20.
    How to Viewthe Data - Dashboards Sales Team Dashboard
  • 21.
    How to Viewthe Data - Dashboards Adoption Dashboard
  • 22.
    How to Viewthe Data - Dashboards Cross-Sell Referral Dashboard
  • 23.
    How to Usethe Data to Drive Behavior Only use SFDC reports to run weekly sales calls “If it’s not in SFDC it doesn’t exist.” Display individual sales performance on team dashboards Use SFDC to drive commissions Enforce adoption metrics through executive support
  • 24.
    Key Take-Aways Byin by Senior Executives Make SFDC a Resource Know what you want defined i.e. what is the important information Create Mandatory fields Flexible Keep requirements simple Involve Sales Managers in the process
  • 25.
    Summary & RecapApplicable for new hires and existing sales reps Develop a “formula” Increase collaboration & cross selling opportunities Use reports and dashboards Sales Management Involvement is Key
  • 26.
    Session Feedback Letus know how we’re doing! Please score the session from 5 to 1 (5=excellent,1=needs improvement) in the following categories: Overall rating of the session Quality of content Strength of presentation delivery Relevance of the session to your organization We strive to improve, t hank you for filling out our survey. Additionally, please score each individual speaker on: Overall delivery of session
  • 27.
    Questions & Answers Katrina Perano Marketing Operations, EMEA & APAC Carman Chan Customer Success Manager

Editor's Notes

  • #2 Good afternoon. Welcome to the session, Photocopy Your Best. My name is Carman Chan and I’m a Customer Success Manager at Salesforce.com. With me on stage are two customer heros; James Smith, Sales Director at CitySearch and Katrina Perano, Marketing Operations for EMEA & APAC at Sungard Data Systems. We will be discussing how to take your best reps and replicate what he or she does across all your entire organization.