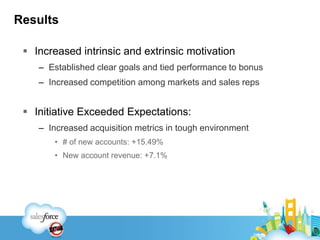
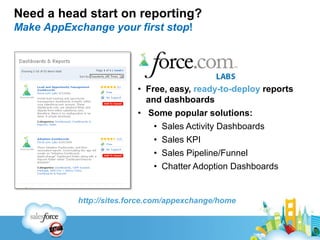
Reporting, Analytics and DashboardsIngo Fochler and Jared Miller
Ingo FochlerCorporate CRM Manager
Company OverviewThe New York Times Regional Media Group (a division of NYTco.) consists of 15 daily newspapers and several weekly and community magazines in five states. Salesforce.com customer since 2006.  INDUSTRY: Printing and Publishing
 EMPLOYEES: 1975 RMG Division
 GEOGRAPHY: United States
 # USERS: 510
 PRODUCT(S) USED:   Salesforce Unlimited Edition   w/ Admin Support since 2006Corporate KPI Initiative DashboardsBusiness Situation:Change in corporate strategyInconsistent processesLack of visibilityManual analytical processesBusiness Need:Drive new behaviorProvide visibilityStandardize processes to compare ‘apples to apples’
Keys for Successful DashboardsVisibilityAccountabilityResults
Keys for Successful Dashboards: VisibilityKeep it simpleFocus on data presentationMake it relevantCreate transparencyPull and push information
Keys for Successful Dashboards: AccountabilityManagement buy-in Standardize processesTrainingLink performance to compensationValid reports
Keys for Successful Dashboards: ResultsWhat’s in it for me?Provide value to each hierarchy levelDaily/weekly usageMonitor behavior			Results will come automatic
Corporate KPI dashboard
Results Increased intrinsic and extrinsic motivationEstablished clear goals and tied performance to bonusIncreased competition among markets and sales repsInitiative Exceeded Expectations:Increased acquisition metrics in tough environment# of new accounts: +15.49%New account revenue: +7.1%
Results – Process Dependentproject launchClosed New Business+ 690%Won New Business+ 1,103%Close Rate New Business+ 42%
Continuous ImprovementAnalytics are a work in progressBetter data + more knowledgeable users generate need for more ‘actionable’ reports with deeper insight
Keys for Successful DashboardsVisibilityAccountabilityResults
Jared MillerSenior ConsultantRiptide Software@jaredemiller
Need a head start on reporting?Make AppExchange your first stop!Free, easy, ready-to-deploy reports and dashboards
 Some popular solutions:
Sales Activity Dashboards

[DF2U] Deep Dive into Salesforce.com Reporting, Analytics, and Dashboard

  • 1.
    Reporting, Analytics andDashboardsIngo Fochler and Jared Miller
  • 2.
  • 3.
    Company OverviewThe NewYork Times Regional Media Group (a division of NYTco.) consists of 15 daily newspapers and several weekly and community magazines in five states. Salesforce.com customer since 2006. INDUSTRY: Printing and Publishing
  • 4.
    EMPLOYEES: 1975RMG Division
  • 5.
  • 6.
  • 7.
    PRODUCT(S) USED: Salesforce Unlimited Edition w/ Admin Support since 2006Corporate KPI Initiative DashboardsBusiness Situation:Change in corporate strategyInconsistent processesLack of visibilityManual analytical processesBusiness Need:Drive new behaviorProvide visibilityStandardize processes to compare ‘apples to apples’
  • 8.
    Keys for SuccessfulDashboardsVisibilityAccountabilityResults
  • 9.
    Keys for SuccessfulDashboards: VisibilityKeep it simpleFocus on data presentationMake it relevantCreate transparencyPull and push information
  • 10.
    Keys for SuccessfulDashboards: AccountabilityManagement buy-in Standardize processesTrainingLink performance to compensationValid reports
  • 11.
    Keys for SuccessfulDashboards: ResultsWhat’s in it for me?Provide value to each hierarchy levelDaily/weekly usageMonitor behavior Results will come automatic
  • 12.
  • 13.
    Results Increased intrinsicand extrinsic motivationEstablished clear goals and tied performance to bonusIncreased competition among markets and sales repsInitiative Exceeded Expectations:Increased acquisition metrics in tough environment# of new accounts: +15.49%New account revenue: +7.1%
  • 14.
    Results – ProcessDependentproject launchClosed New Business+ 690%Won New Business+ 1,103%Close Rate New Business+ 42%
  • 15.
    Continuous ImprovementAnalytics area work in progressBetter data + more knowledgeable users generate need for more ‘actionable’ reports with deeper insight
  • 16.
    Keys for SuccessfulDashboardsVisibilityAccountabilityResults
  • 17.
  • 20.
    Need a headstart on reporting?Make AppExchange your first stop!Free, easy, ready-to-deploy reports and dashboards
  • 21.
    Some popularsolutions:
  • 22.

Editor's Notes

  • #5 Steering your business with dashboards – and we did just thatChange in corp. strategy: No secret, tough industry, online focus, SMBInconsistent processes: Decentralized company paired lack of training led to incon. Processes and lack of visibilityMore with less resourcesneeded to change the attitude of the sales organizationProvide visibility to local and exec. management
  • #6 Had similar projects, didn’t work, why?Provided some visibility, but no accountability and limited resultsFocus on preparation and provide max. visibility and accountability So in the end, building dashboards was the easy part
  • #7 Keep it simple: measurable, easy to understand, mgmt knows the benefits To drive real change, focus only on a few key metrics6 simple KPIs to compare 14 different newspapers Presentation:Easy to read, use best way to present data (tables, columns, lines, etc.) Same dashboards / reports for each level: Corporate, Local Manager, Sales Representative Pull and push: Easy access to data, visibility into the entire orgDashboard sent out weekly to all users
  • #8  Aligned with corporate strategy- Executive management buy-in – sometimes tough to find out what they want bc they only know the status quo – ask the right questionsStandardized processes + definitionsRoll-out supported by training Link performance to compensation- In order to make people accountable, reports have to be valid!
  • #9 Results:If every user can answer the question what’s in it for me, the dashboards will workIf dashboards provide value for each level in the org – daily/weekly usageDrive desired behaviorResults
  • #10 Building is easy – especially in this case4 KPI for reps:of NBDsClose RateNew AccountsDigital AccountsTrending with analytic snapshot
  • #11 Shift in sales management culture – more metric driven than before
  • #12 Closed New Business Development Opportunities (NBDs): 690% (1,846 vs 14,582)Closed Won NBDs: 1,103% (667 vs 8,025)Closed NBDs Improvement: 42% (36.63% vs 51.84%)
  • #14 Key points:Preparation – building dashboards is the easiest partKeep it simpleManagement buy-inProvide value to drive resultsConstant improvement
  • #18 http://sites.force.com/appexchange/home
  • #19 Report folders are you friendUse to control accessDevelop folder & report naming conventions-Develop folder & report naming conventionse.g., Regional Sales Report Folder, also thinking about preceding with “DB-” for dashboard reports(SE Pipeline, US Marketing, EMEA Lead Gen, etc.) - Don’t forget about the Rolling Calendar (e.g., Last 240 Days, This Quarter)
  • #20 Report folders are you friendUse to control accessDevelop folder & report naming conventions-Develop folder & report naming conventionse.g., Regional Sales Report Folder, also thinking about preceding with “DB-” for dashboard reports(SE Pipeline, US Marketing, EMEA Lead Gen, etc.) - Don’t forget about the Rolling Calendar (e.g., Last 240 Days, This Quarter)
  • #21 Report folders are you friendUse to control accessDevelop folder & report naming conventions-Develop folder & report naming conventionse.g., Regional Sales Report Folder, also thinking about preceding with “DB-” for dashboard reports(SE Pipeline, US Marketing, EMEA Lead Gen, etc.) - Don’t forget about the Rolling Calendar (e.g., Last 240 Days, This Quarter)