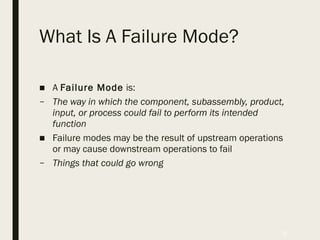
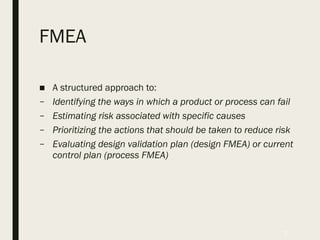
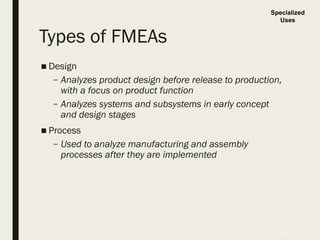
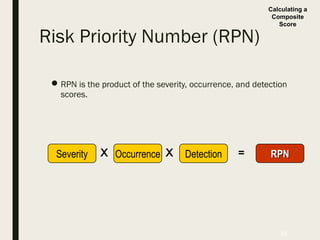
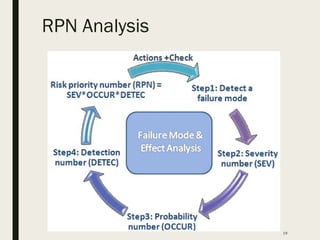
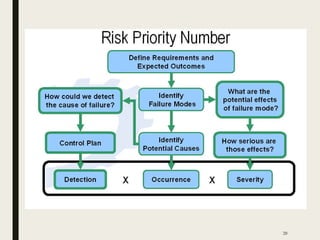
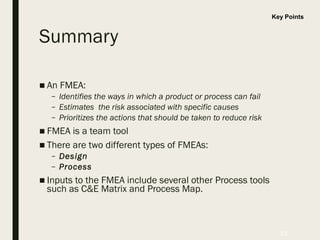
Failure Modes
Effect Analysis
(FMEA)
By,
Amit kumar
Y chaitanya
Tejas
Learning Objectives
■ To understand the use of Failure Modes Effect Analysis
(FMEA)
■ To learn the steps to developing FMEAs
■ To summarize the different types of FMEAs
■ To learn how to link the FMEA to other Process tools
2
Benefits
■ Allows us to identify areas of our process that most
impact our customers
■ Helps us identify how our process is most likely to fail
■ Points to process failures that are most difficult to
detect
3
Application Examples
■ Manufacturing: A manager is responsible for moving a
manufacturing operation to a new facility. He/she wants
to be sure the move goes as smoothly as possible and
that there are no surprises.
■ Design: A design engineer wants to think of all the
possible ways a product being designed could fail so
that robustness can be built into the product.
■ Software: A software engineer wants to think of possible
problems a software product could fail when scaled up
to large databases. This is a core issue for the Internet.
4
What Is A Failure Mode?
■ A Failure Mode is:
– The way in which the component, subassembly, product,
input, or process could fail to perform its intended
function
■ Failure modes may be the result of upstream operations
or may cause downstream operations to fail
– Things that could go wrong
5
FMEA
■Why
– Methodology that facilitates process improvement
– Identifies and eliminates concerns early in the
development of a process or design
– Improve internal and external customer satisfaction
– Focuses on prevention
– FMEA may be a customer requirement (likely
contractual)
– FMEA may be required by an applicable
Quality Management System Standard (possibly ISO)
6
FMEA
■ A structured approach to:
– Identifying the ways in which a product or process can fail
– Estimating risk associated with specific causes
– Prioritizing the actions that should be taken to reduce risk
– Evaluating design validation plan (design FMEA) or current
control plan (process FMEA)
7
History of FMEA
■ First used in the 1960’s in the Aerospace industry during the
Apollo missions
■ In 1974, the Navy developed MIL-STD-1629 regarding the use
of FMEA
■ In the late 1970’s, the automotive industry was driven by
liability costs to use FMEA
■ Later, the automotive industry saw the advantages of using
this tool to reduce risks related to poor quality
8
Examples
The FMEA Form
9
Identify failure modes
and their effects
Identify causes of the
failure modes
and controls
Prioritize
Determine and
assess actions
A Closer Look
Types of FMEAs
■ Design
– Analyzes product design before release to production,
with a focus on product function
– Analyzes systems and subsystems in early concept
and design stages
■ Process
– Used to analyze manufacturing and assembly
processes after they are implemented
10
Specialized
Uses
FMEA: A Team Tool
■ A team approach is necessary.
■ Team should be led by the Process Owner who is the
responsible manufacturing engineer or technical person,
or other similar individual familiar with FMEA.
■ The following should be considered for team members:
– Design Engineers – Operators
– Process Engineers – Reliability
– Materials Suppliers – Suppliers
– Customers
11
Team Input
Required
FMEA Procedure
1. For each process input (start with high value inputs),
determine the ways in which the input can go wrong
(failure mode)
2. For each failure mode, determine effects
– Select a severity level for each effect
3. Identify potential causes of each failure mode
– Select an occurrence level for each cause
4. List current controls for each cause
– Select a detection level for each cause
12
Process Steps
FMEA Procedure (Cont.)
5. Calculate the Risk Priority Number (RPN)
6. Develop recommended actions, assign responsible
persons, and take actions
– Give priority to high RPNs
– MUST look at severities rated a 10
7. Assign the predicted severity, occurrence, and
detection levels and compare RPNs
13
Process Steps
FMEA Inputs and Outputs
14
FMEA
C&E Matrix
Process Map
Process History
Procedures
Knowledge
Experience
List of actions to
prevent causes or
detect failure
modes
History of actions
taken
Inputs Outputs
Information
Flow
Severity, Occurrence,
and Detection
■Severity
– Importance of the effect on customer requirements
■Occurrence
– Frequency with which a given cause occurs and
creates failure modes (obtain from past data if possible)
■Detection
– The ability of the current control scheme to detect
(then prevent) a given cause (may be difficult to estimate
early in process operations).
15
Analyzing
Failure &
Effects
Rating Scales
■ There are a wide variety of scoring
“anchors”, both quantitative or qualitative
■ Two types of scales are 1-5 or 1-10
■ The 1-5 scale makes it easier for the teams
to decide on scores
■ The 1-10 scale may allow for better
precision in estimates and a wide variation
in scores (most common)
16
Assigning
Rating
Weights
Rating Scales
■ Severity
– 1 = Not Severe, 10 = Very Severe
■ Occurrence
– 1 = Not Likely, 10 = Very Likely
■ Detection
– 1 = Easy to Detect, 10 = Not easy to Detect
17
Assigning
Rating
Weights
Risk Priority Number (RPN)
RPN is the product of the severity, occurrence, and detection
scores.
18
Severity Occurrence Detection RPNRPNX X =
Calculating a
Composite
Score
RPN Analysis
19
20
Summary
■ An FMEA:
– Identifies the ways in which a product or process can fail
– Estimates the risk associated with specific causes
– Prioritizes the actions that should be taken to reduce risk
■ FMEA is a team tool
■ There are two different types of FMEAs:
– Design
– Process
■ Inputs to the FMEA include several other Process tools
such as C&E Matrix and Process Map.
21
Key Points
Reference
■ www.reliasoft.com
■ http://asq.org/learn-about-quality/process-analysis-tools/overview/fme
■ www.isixsigma.com
22
23

FMEA

  • 1.
  • 2.
    Learning Objectives ■ Tounderstand the use of Failure Modes Effect Analysis (FMEA) ■ To learn the steps to developing FMEAs ■ To summarize the different types of FMEAs ■ To learn how to link the FMEA to other Process tools 2
  • 3.
    Benefits ■ Allows usto identify areas of our process that most impact our customers ■ Helps us identify how our process is most likely to fail ■ Points to process failures that are most difficult to detect 3
  • 4.
    Application Examples ■ Manufacturing:A manager is responsible for moving a manufacturing operation to a new facility. He/she wants to be sure the move goes as smoothly as possible and that there are no surprises. ■ Design: A design engineer wants to think of all the possible ways a product being designed could fail so that robustness can be built into the product. ■ Software: A software engineer wants to think of possible problems a software product could fail when scaled up to large databases. This is a core issue for the Internet. 4
  • 5.
    What Is AFailure Mode? ■ A Failure Mode is: – The way in which the component, subassembly, product, input, or process could fail to perform its intended function ■ Failure modes may be the result of upstream operations or may cause downstream operations to fail – Things that could go wrong 5
  • 6.
    FMEA ■Why – Methodology thatfacilitates process improvement – Identifies and eliminates concerns early in the development of a process or design – Improve internal and external customer satisfaction – Focuses on prevention – FMEA may be a customer requirement (likely contractual) – FMEA may be required by an applicable Quality Management System Standard (possibly ISO) 6
  • 7.
    FMEA ■ A structuredapproach to: – Identifying the ways in which a product or process can fail – Estimating risk associated with specific causes – Prioritizing the actions that should be taken to reduce risk – Evaluating design validation plan (design FMEA) or current control plan (process FMEA) 7
  • 8.
    History of FMEA ■First used in the 1960’s in the Aerospace industry during the Apollo missions ■ In 1974, the Navy developed MIL-STD-1629 regarding the use of FMEA ■ In the late 1970’s, the automotive industry was driven by liability costs to use FMEA ■ Later, the automotive industry saw the advantages of using this tool to reduce risks related to poor quality 8 Examples
  • 9.
    The FMEA Form 9 Identifyfailure modes and their effects Identify causes of the failure modes and controls Prioritize Determine and assess actions A Closer Look
  • 10.
    Types of FMEAs ■Design – Analyzes product design before release to production, with a focus on product function – Analyzes systems and subsystems in early concept and design stages ■ Process – Used to analyze manufacturing and assembly processes after they are implemented 10 Specialized Uses
  • 11.
    FMEA: A TeamTool ■ A team approach is necessary. ■ Team should be led by the Process Owner who is the responsible manufacturing engineer or technical person, or other similar individual familiar with FMEA. ■ The following should be considered for team members: – Design Engineers – Operators – Process Engineers – Reliability – Materials Suppliers – Suppliers – Customers 11 Team Input Required
  • 12.
    FMEA Procedure 1. Foreach process input (start with high value inputs), determine the ways in which the input can go wrong (failure mode) 2. For each failure mode, determine effects – Select a severity level for each effect 3. Identify potential causes of each failure mode – Select an occurrence level for each cause 4. List current controls for each cause – Select a detection level for each cause 12 Process Steps
  • 13.
    FMEA Procedure (Cont.) 5.Calculate the Risk Priority Number (RPN) 6. Develop recommended actions, assign responsible persons, and take actions – Give priority to high RPNs – MUST look at severities rated a 10 7. Assign the predicted severity, occurrence, and detection levels and compare RPNs 13 Process Steps
  • 14.
    FMEA Inputs andOutputs 14 FMEA C&E Matrix Process Map Process History Procedures Knowledge Experience List of actions to prevent causes or detect failure modes History of actions taken Inputs Outputs Information Flow
  • 15.
    Severity, Occurrence, and Detection ■Severity –Importance of the effect on customer requirements ■Occurrence – Frequency with which a given cause occurs and creates failure modes (obtain from past data if possible) ■Detection – The ability of the current control scheme to detect (then prevent) a given cause (may be difficult to estimate early in process operations). 15 Analyzing Failure & Effects
  • 16.
    Rating Scales ■ Thereare a wide variety of scoring “anchors”, both quantitative or qualitative ■ Two types of scales are 1-5 or 1-10 ■ The 1-5 scale makes it easier for the teams to decide on scores ■ The 1-10 scale may allow for better precision in estimates and a wide variation in scores (most common) 16 Assigning Rating Weights
  • 17.
    Rating Scales ■ Severity –1 = Not Severe, 10 = Very Severe ■ Occurrence – 1 = Not Likely, 10 = Very Likely ■ Detection – 1 = Easy to Detect, 10 = Not easy to Detect 17 Assigning Rating Weights
  • 18.
    Risk Priority Number(RPN) RPN is the product of the severity, occurrence, and detection scores. 18 Severity Occurrence Detection RPNRPNX X = Calculating a Composite Score
  • 19.
  • 20.
  • 21.
    Summary ■ An FMEA: –Identifies the ways in which a product or process can fail – Estimates the risk associated with specific causes – Prioritizes the actions that should be taken to reduce risk ■ FMEA is a team tool ■ There are two different types of FMEAs: – Design – Process ■ Inputs to the FMEA include several other Process tools such as C&E Matrix and Process Map. 21 Key Points
  • 22.
  • 23.