Downloaded 81 times
![COST FUNCTION IN LONG- RUN
Cost function in Long- Run may be defined
as the mathematical relationship btw cost
of a product and the various determinants
of cost.
C= F [Q, T ,Pf, K]](https://image.slidesharecdn.com/longrun-131130093200-phpapp01/85/Long-run-Managerial-Economics-2-320.jpg)
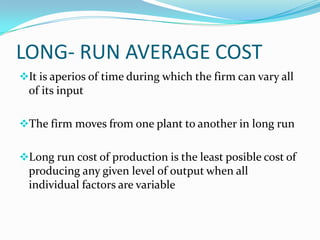
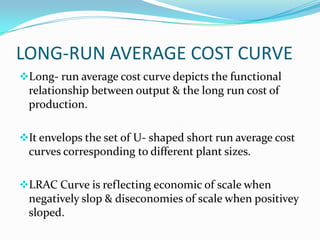
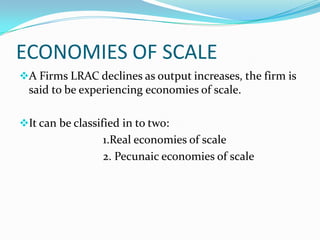
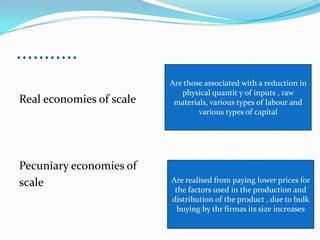
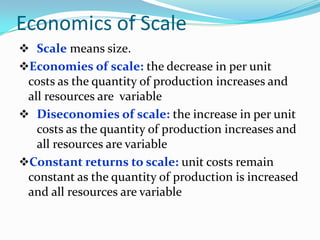
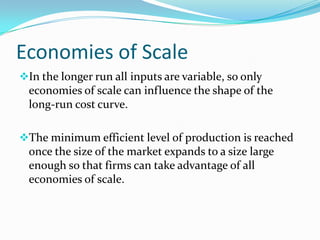
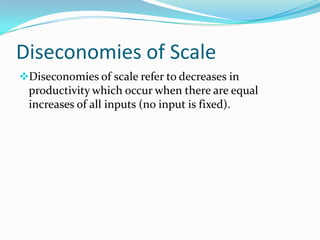
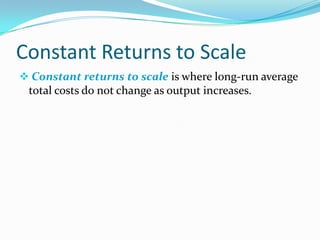
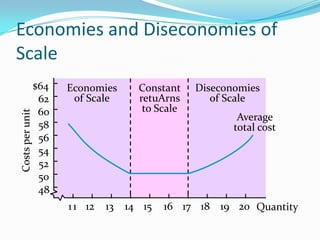


The document discusses cost functions and curves in the long run. It defines long run costs as those that can change as the firm varies all inputs over time. The long run average cost curve depicts the relationship between output and long run average cost of production as the firm takes advantage of economies of scale by increasing production. Economies of scale refer to decreasing long run average costs from increasing production, while diseconomies of scale refer to increasing costs from producing at too large a scale.


![6. Costs Management MEn BE me something in ibsbeMBA.pptxAutosaved].pptx](https://cdn.slidesharecdn.com/ss_thumbnails/6-251228180457-10e76ffe-thumbnail.jpg?width=640&height=640&fit=bounds)


![Awareness of digital currency[1] (1).pptx](https://cdn.slidesharecdn.com/ss_thumbnails/awarenessofdigitalcurrency11-260125155504-b1badee4-thumbnail.jpg?width=640&height=640&fit=bounds)


