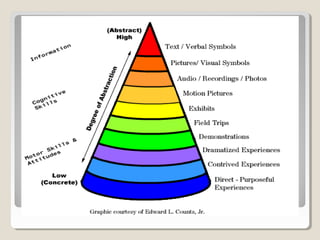
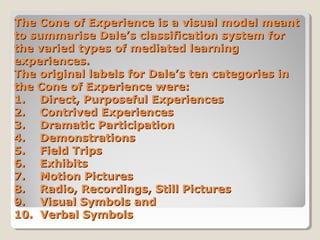
3. The Cone was originally developed by Edgar
Dale in 1946. It was intended as a way to
describe various learning experiences.
Essentially, the Cone shows the progression
of experiences from the most concrete (at the
bottom of the cone) to the most abstract (at
the top of the cone). It is important to note
that Dale never intended the Cone to depict a
value judgment of experiences; in other
words, his argument was not that more
concrete experiences were better than more
abstract ones. Dale believed that any and all
of the approaches could and should be used,
depending on the needs of the learner
4.
5. The Cone of Experience is a visual model meant
to summarise Dale’s classification system for
the varied types of mediated learning
experiences.
The original labels for Dale’s ten categories in
the Cone of Experience were:
1. Direct, Purposeful Experiences
2. Contrived Experiences
3. Dramatic Participation
4. Demonstrations
5. Field Trips
6. Exhibits
7. Motion Pictures
8. Radio, Recordings, Still Pictures
9. Visual Symbols and
10. Verbal Symbols
6. 1. Direct purposeful experience- it is
the first hand experience which serve
as the foundation of our learning. It is
learning by doing. We build up our
reservoir of meaningful information
and ideas through seeing, hearing,
touching, tasting and smelling.
7. 2. Contrived experiencesIn here we make use of a
representative models or
mocks up of reality for
practical reasons.
8. 3. Dramatized experiencesThrough dramatization we can
participate in a reconstructed
experience, even though the
original event is far removed
from us in time.
9. 4. Demonstrations- It is a
visualized explanation of an
important fact, idea or process by
the use of photographs, drawings,
films, displays or guided motions.
.
10. 5.Study trips- these are
excursions, educational trips, and
visits conducted to observe an
event that is unavailable within
the classroom.
11. 6. Exhibits- there are displays to
be seen by spectators.They may
consist of working models arranged
meaningfully or photographs with
models, charts, and posters.
12. 7. Television and motion picturestelevision and motion pictures can
reconstruct the reality of the past
so effectively that we are made to
feel we are there.
13. 8. Visual symbols- these are no
longer realistic reproduction of
physical things for these are highly
abstract representations. Examples
are charts, graphs, maps, and
diagrams.
14. 9. Verbal symbols- they are not
like the objects or ideas for which
they stand. they usually do not
contain visual clues to their
meaning.
15. When Dale researched learning and teaching
methods he found that much of what we found
to be true of direct and indirect (and of concrete
and abstract) experience could be summarised
in a pyramid or ‘pictorial device’ Dales called
‘the Cone of Experience’. In his book ‘Audio
visual methods in teaching’ – 1957, he stated
that the cone was not offered as a perfect or
mechanically flawless picture to be taken
absolutely literally. It was merely designed as a
visual aid to help explain the interrelationships
of the various types of audio-visual materials, as
well as their individual ‘positions’ in the learning
process.
16. Dale points out that it would be a
dangerous mistake to regard the
bands on the cone as rigid, inflexible
divisions.
He said “The cone device is a visual
metaphor of learning experiences, in
which the various types of audiovisual materials are arranged in the
order of increasing abstractness as
one proceeds from direct
experiences”
17. People Remember
It is said that people remember:
§ 10% of what they read
§ 20% of what they hear
§ 30% of what they see
§ 50% of what they see and hear
§ 70% of what they write and say
§ 90% of what they say as they
do
18. The percentages –> 10% of what they read 20%
of what they hear 30% of what they see 50% of
what they hear and see 70% of what they say or
write 90% of what they say as they do a thing
are not from Dale. The bogus percentages appear
to have been first published by an employee of
Mobil Oil Company in 1967, writing in the
magazine “Film and Audio-Visual
Communications”.
These percentages have since been discredited.
THEY ARE FICTION! This is one of the great
training/ people development myths.