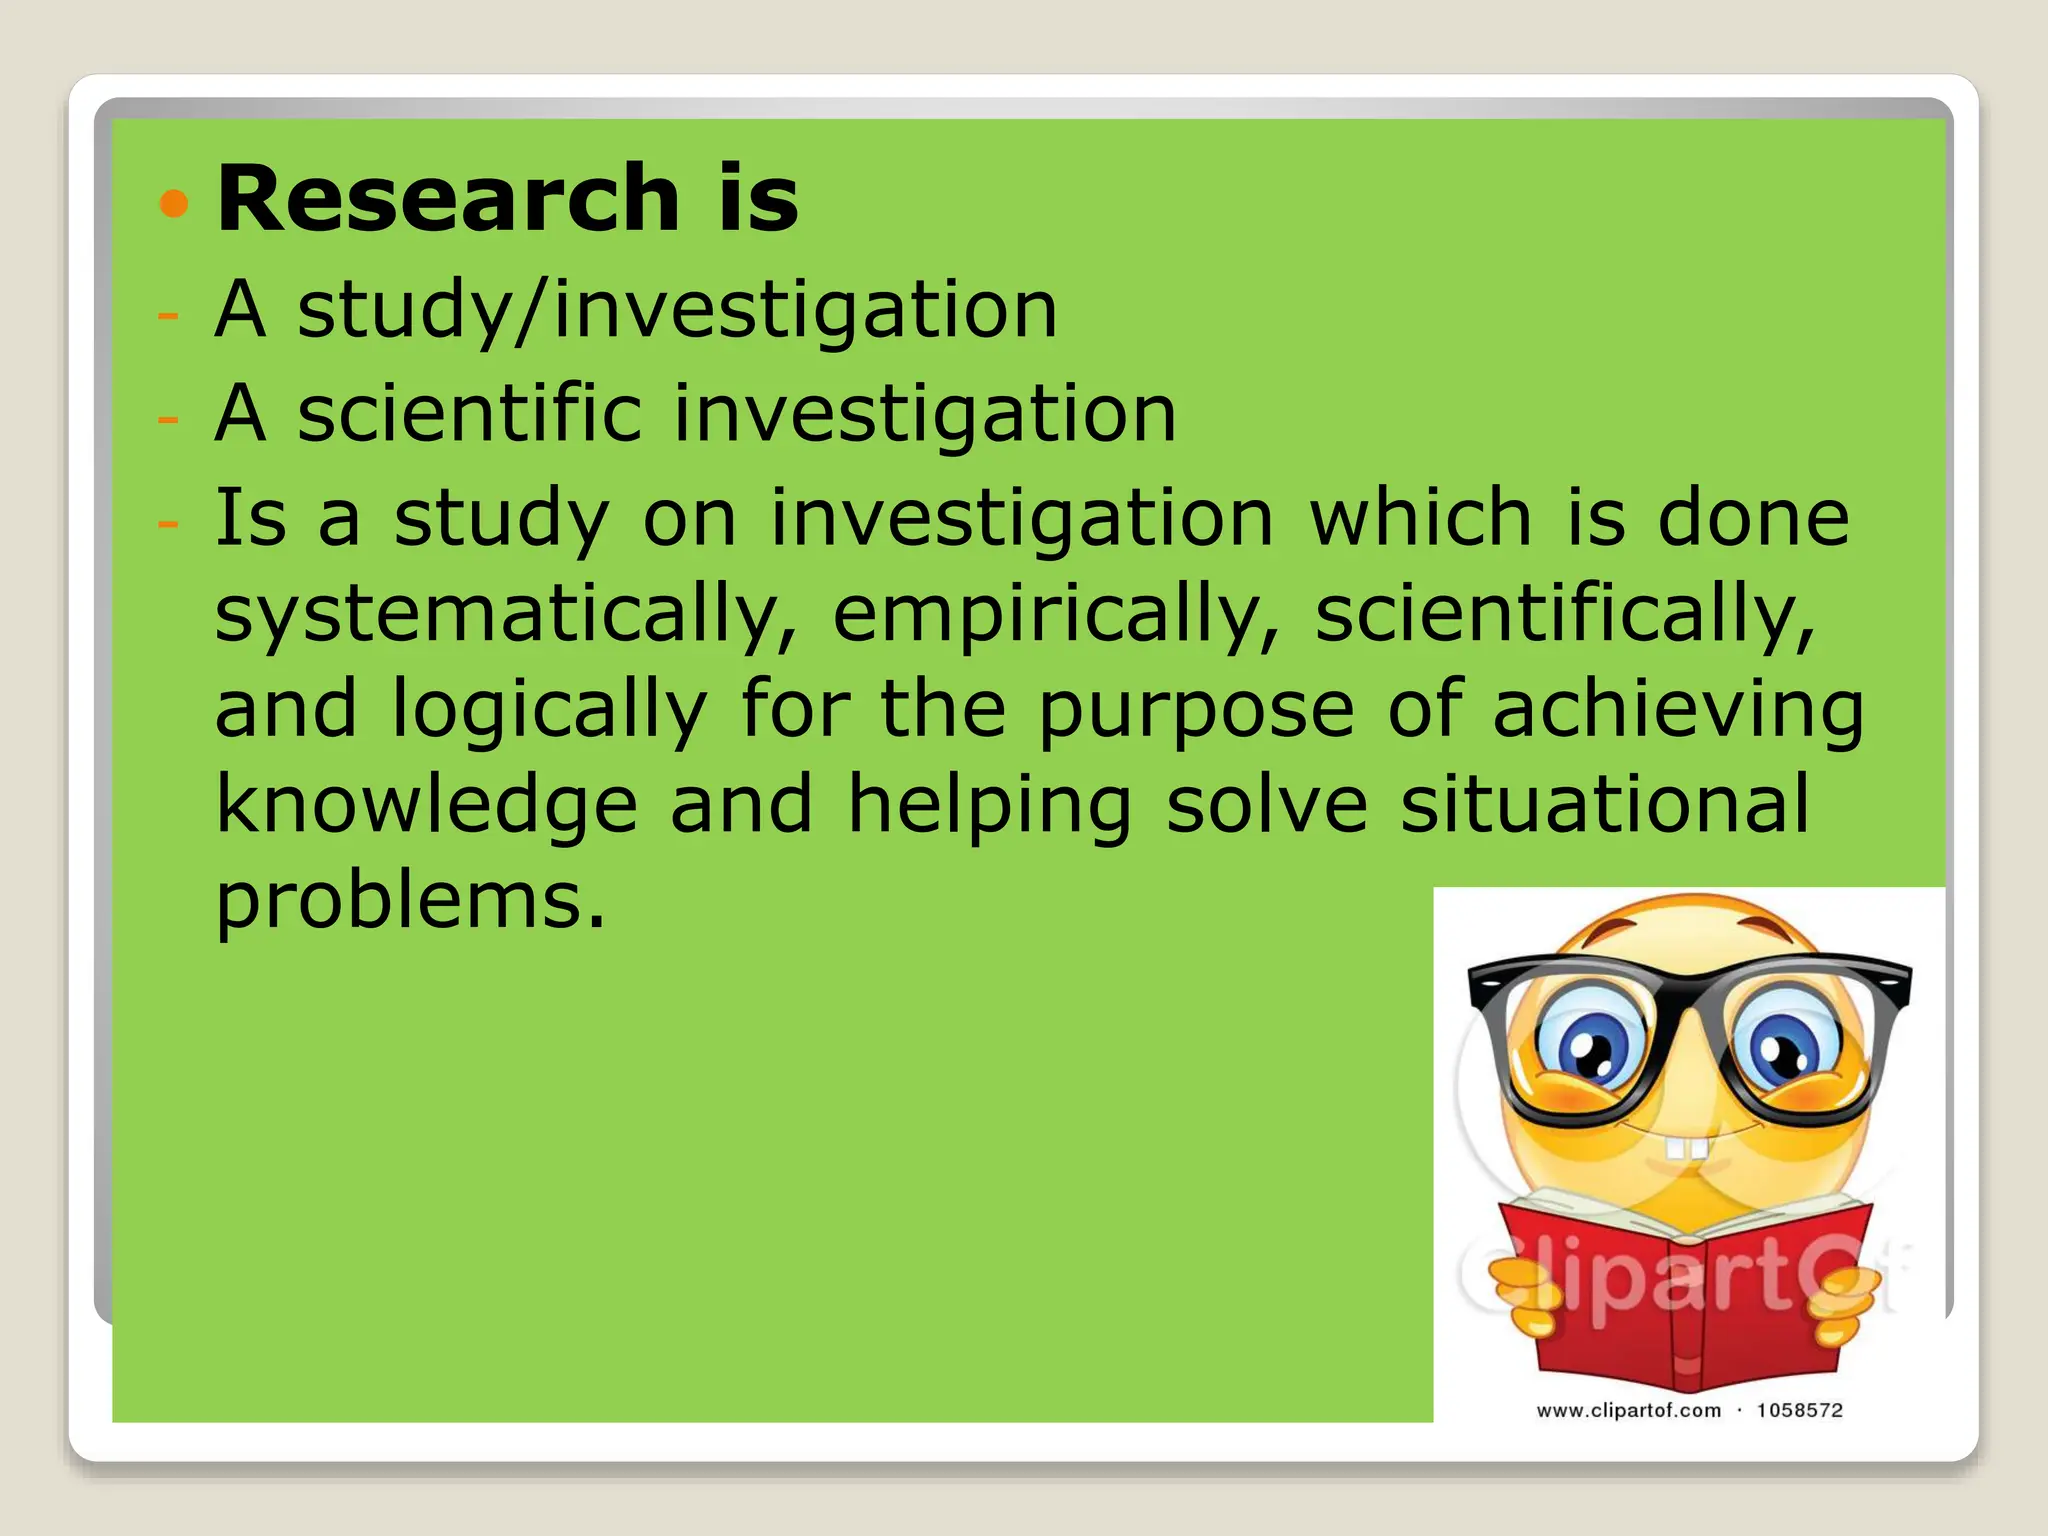
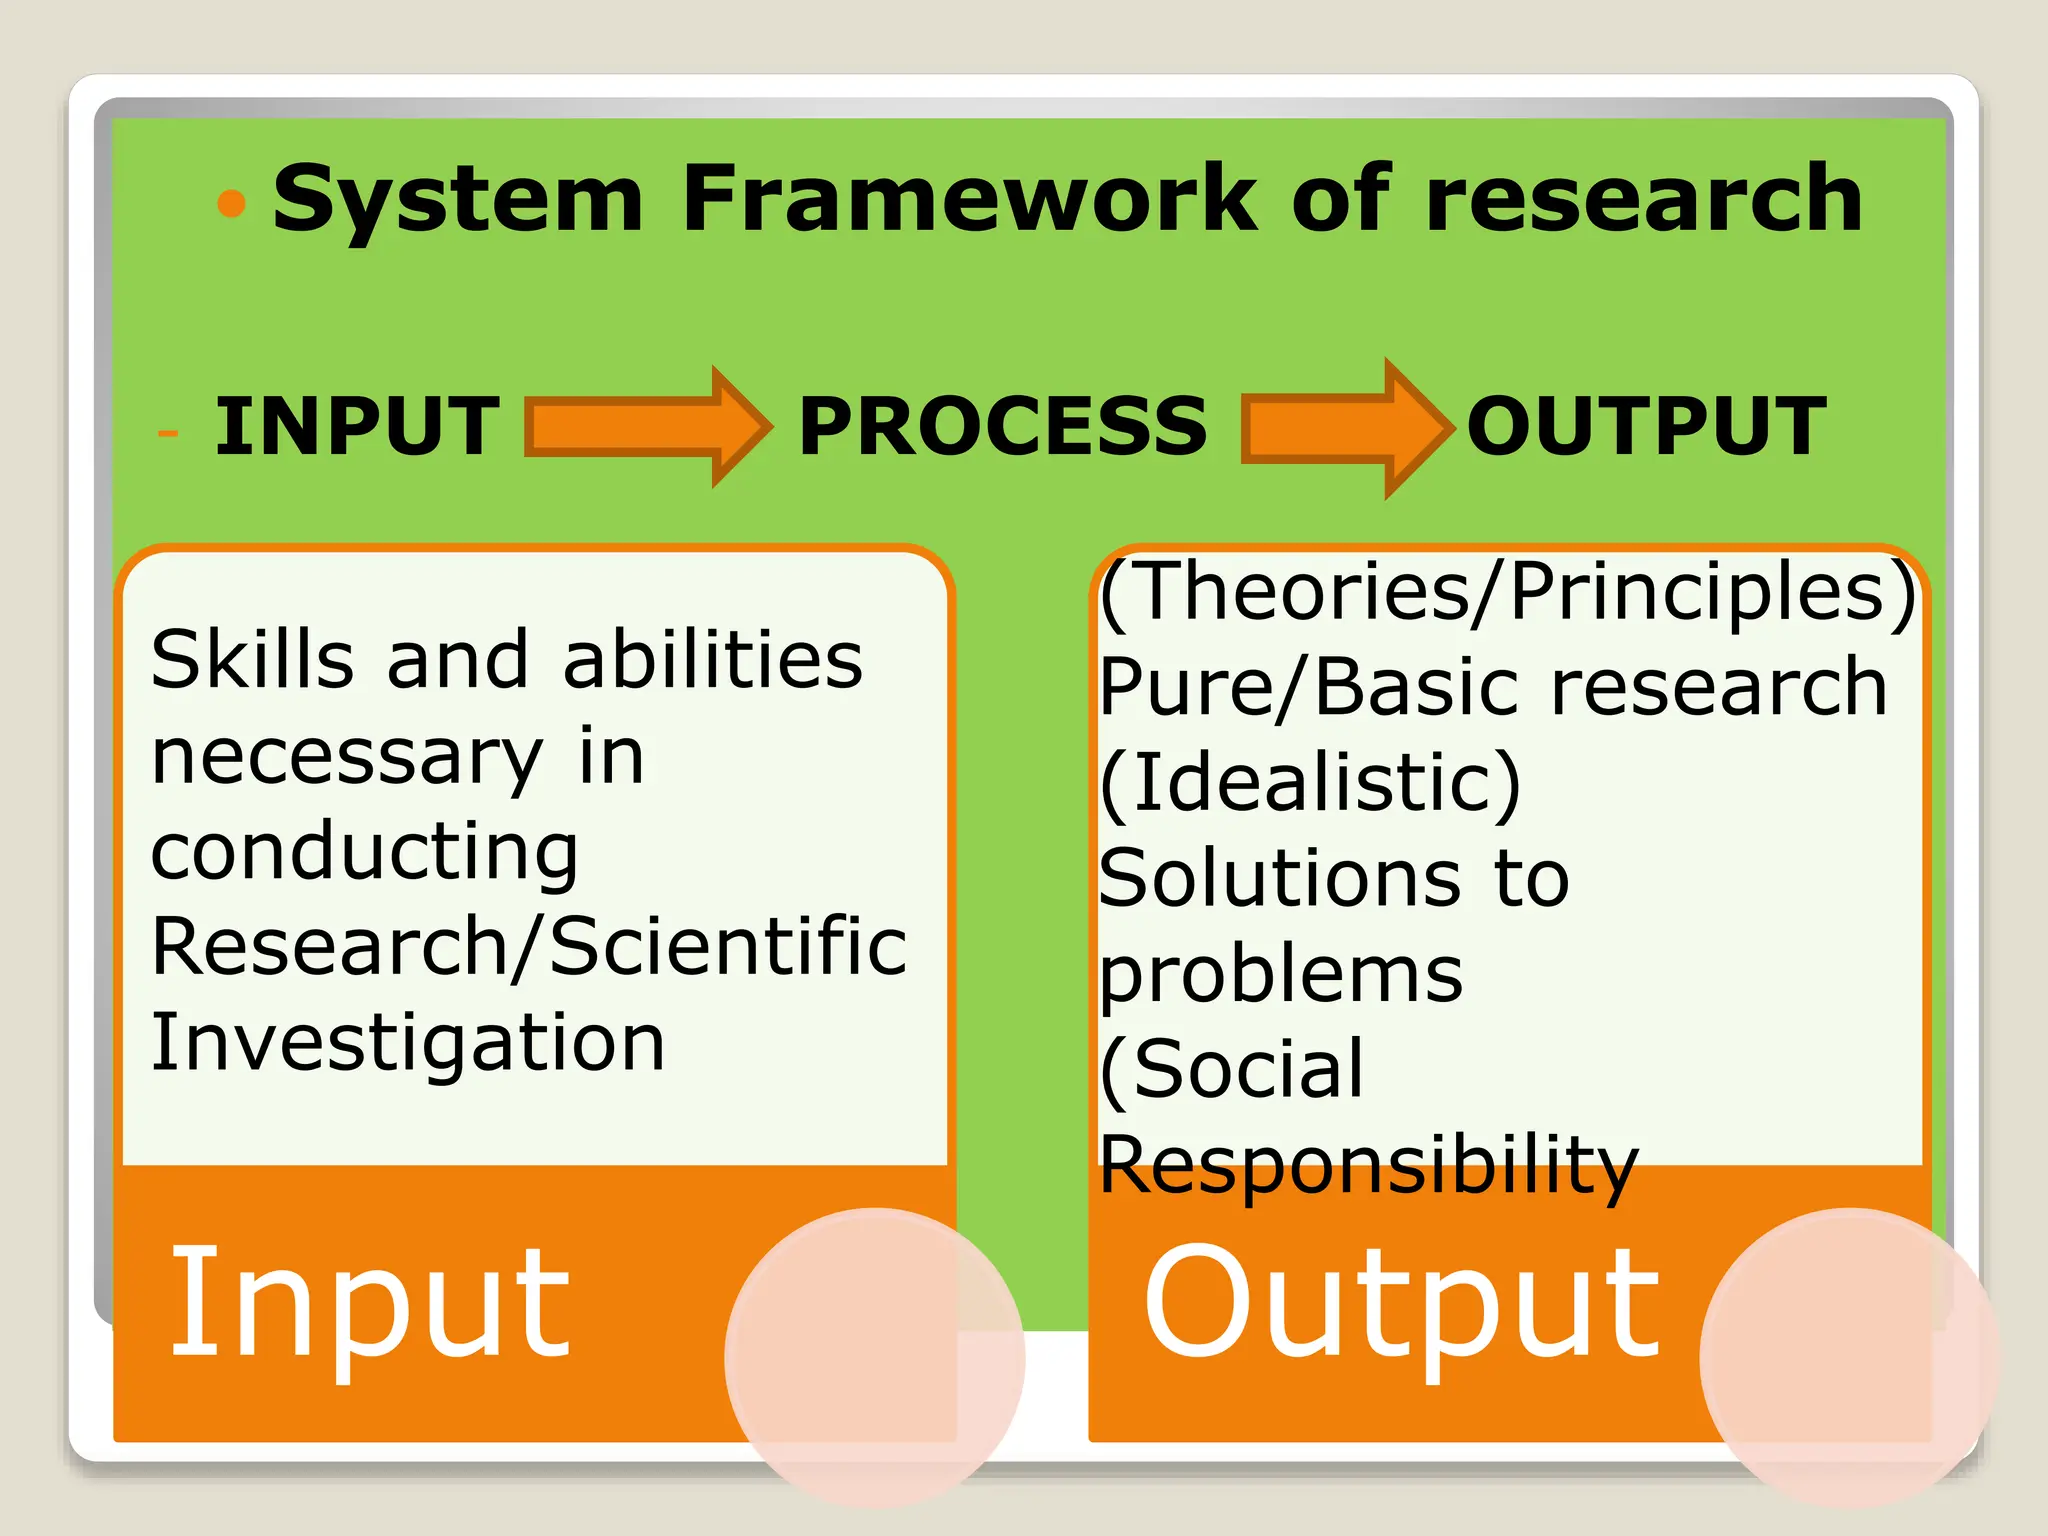
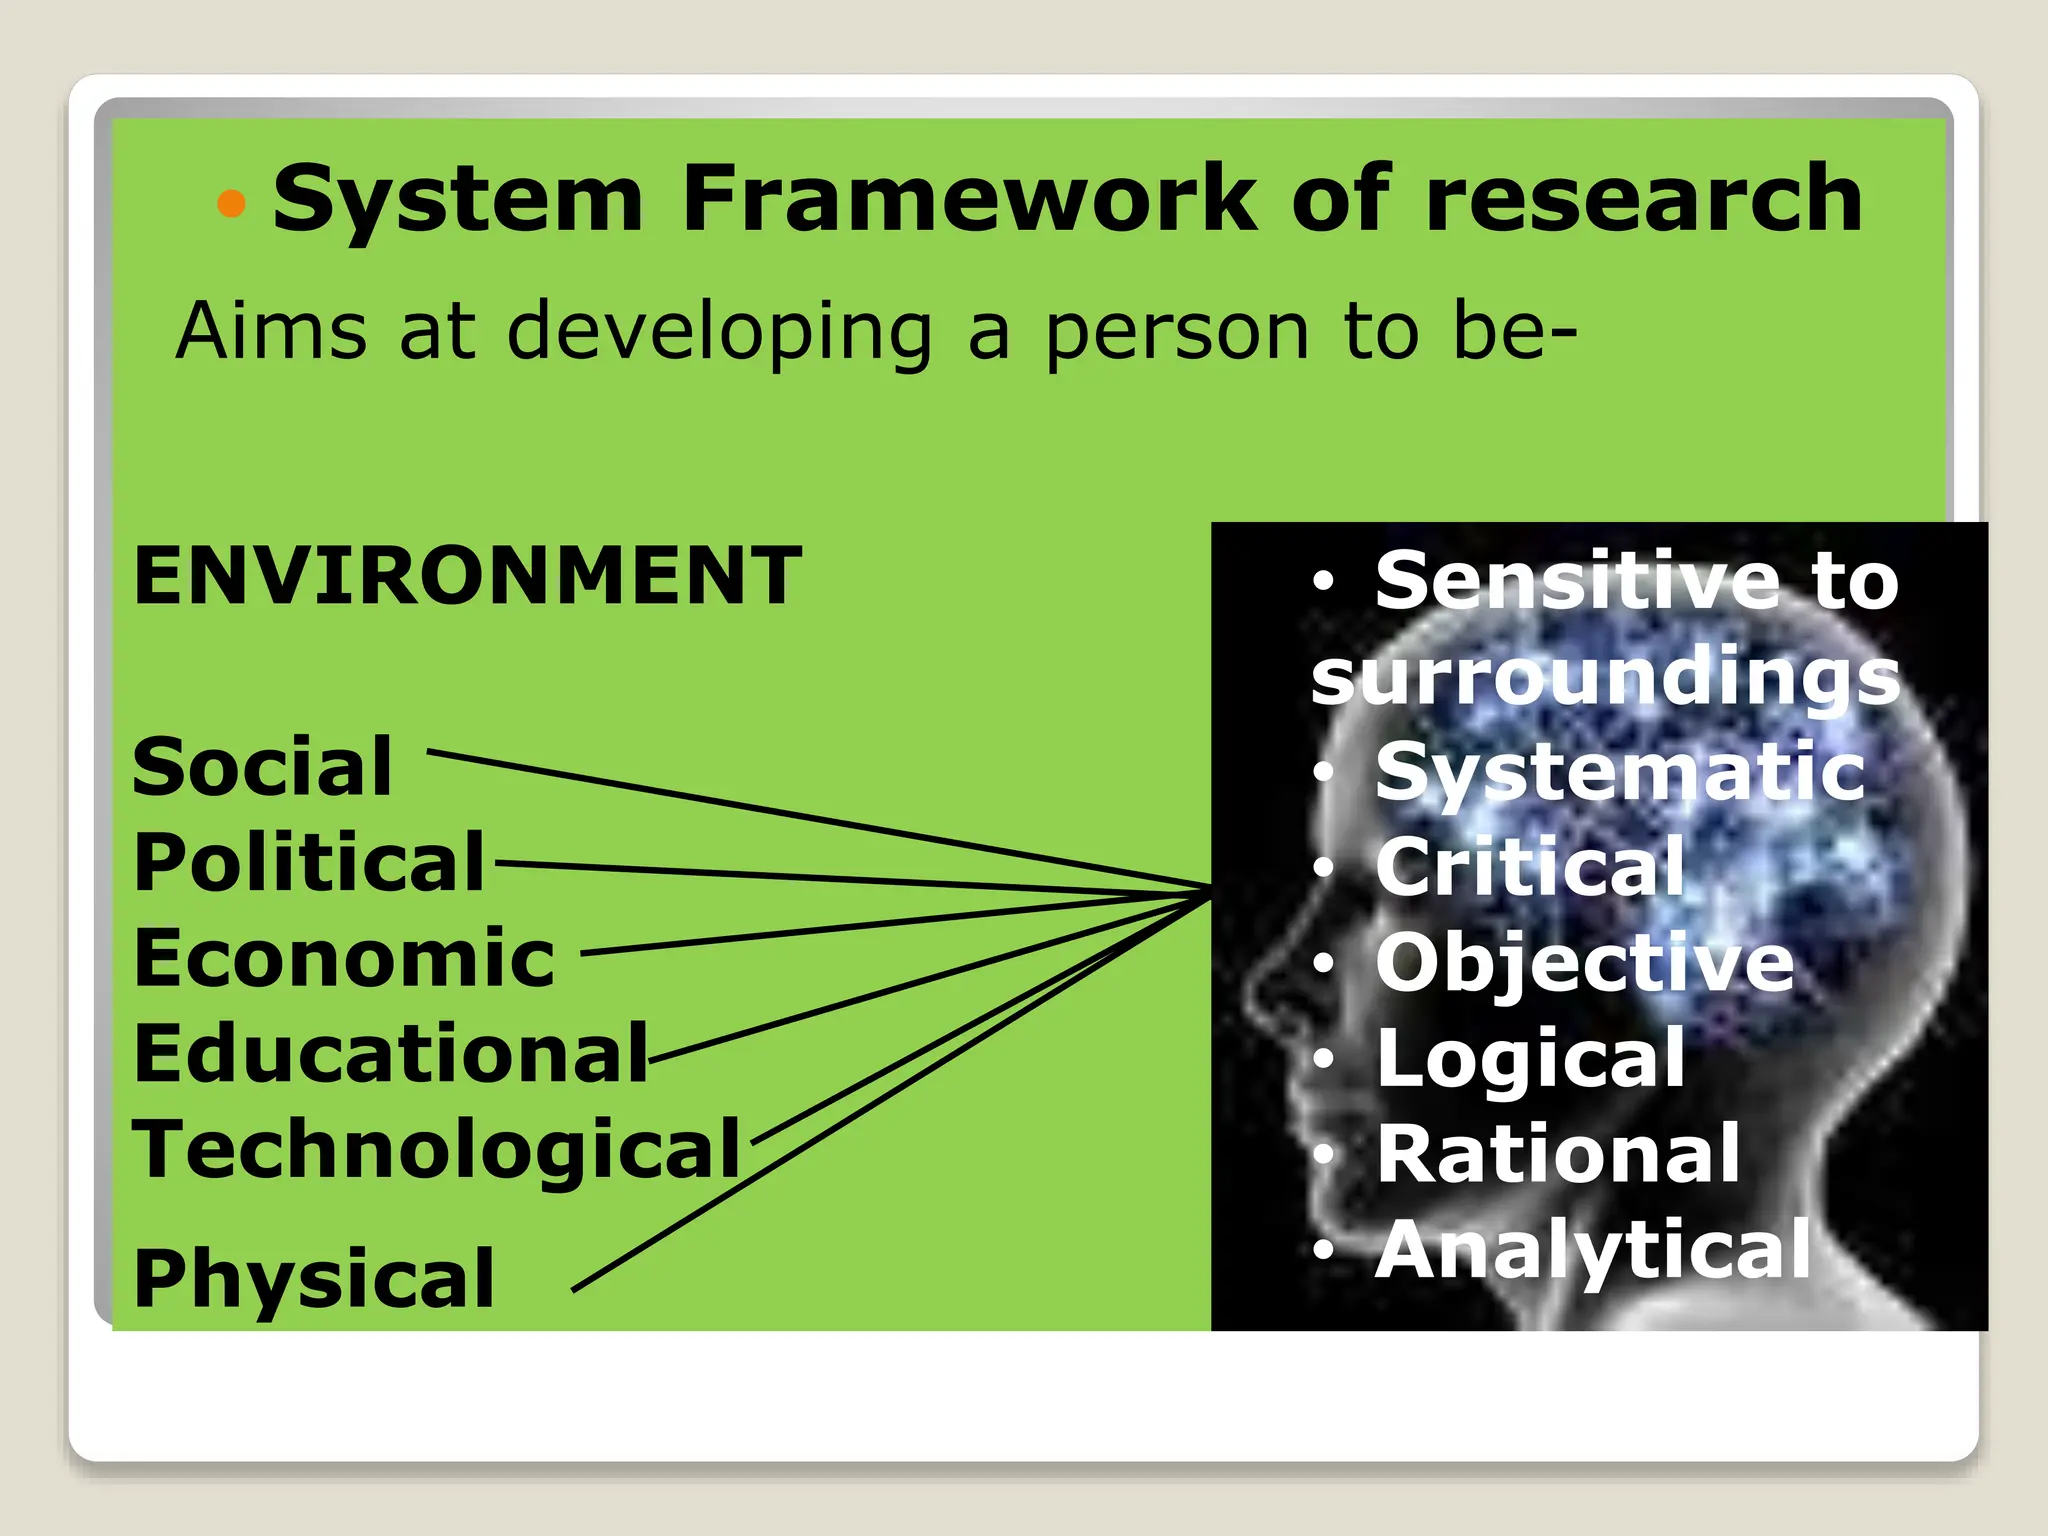
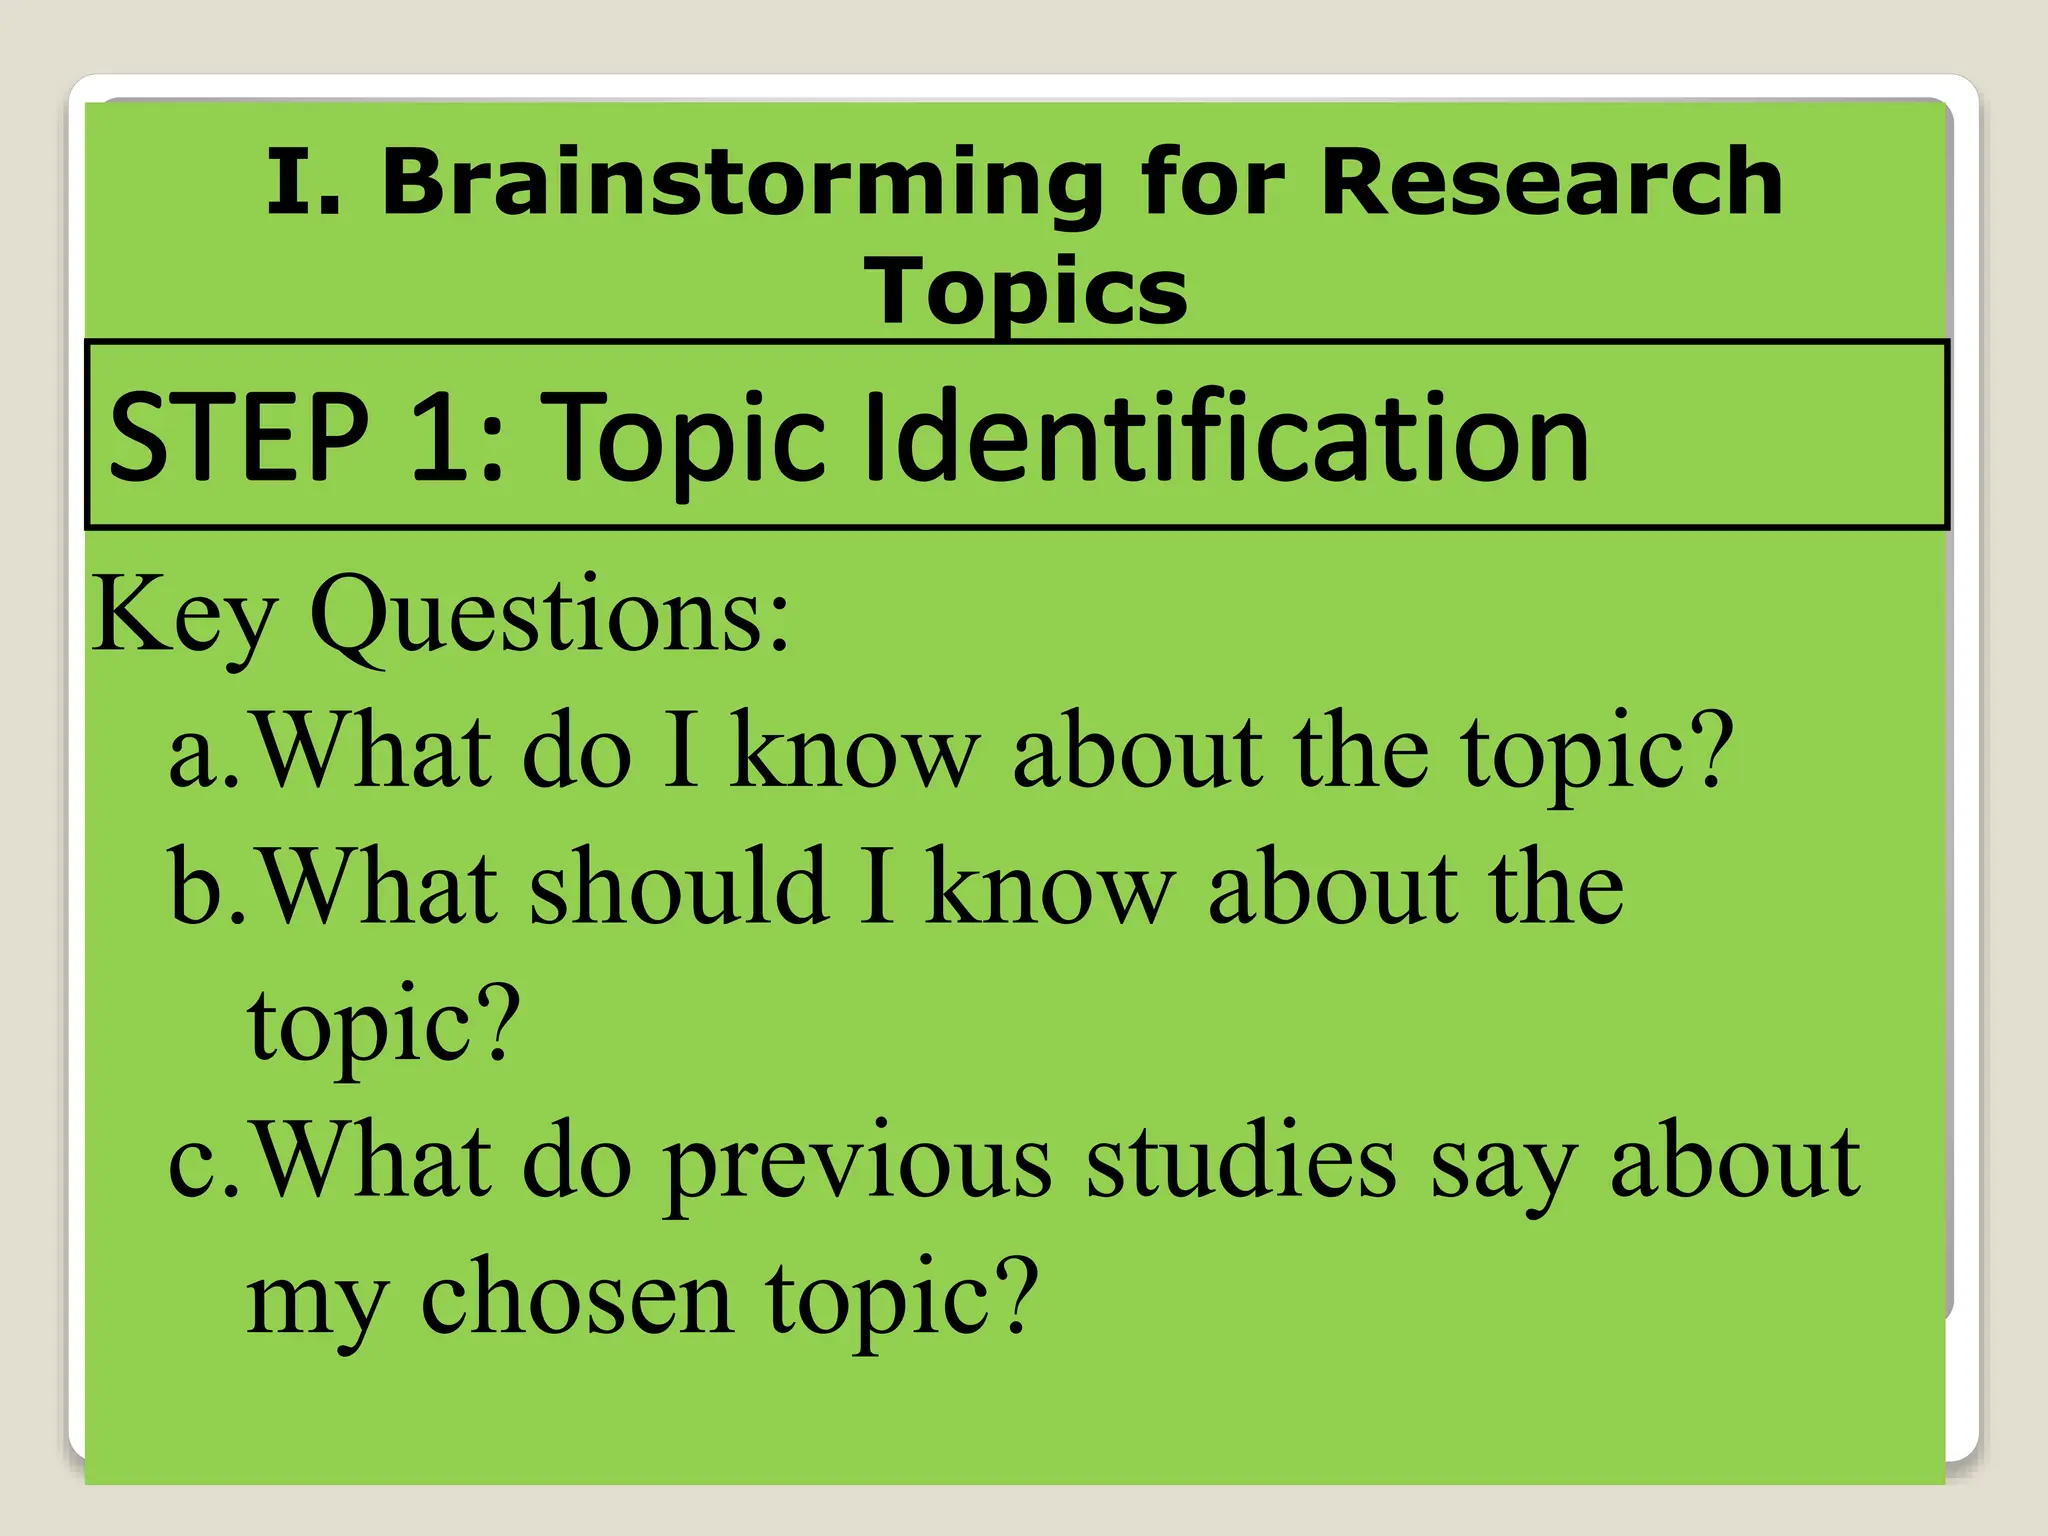
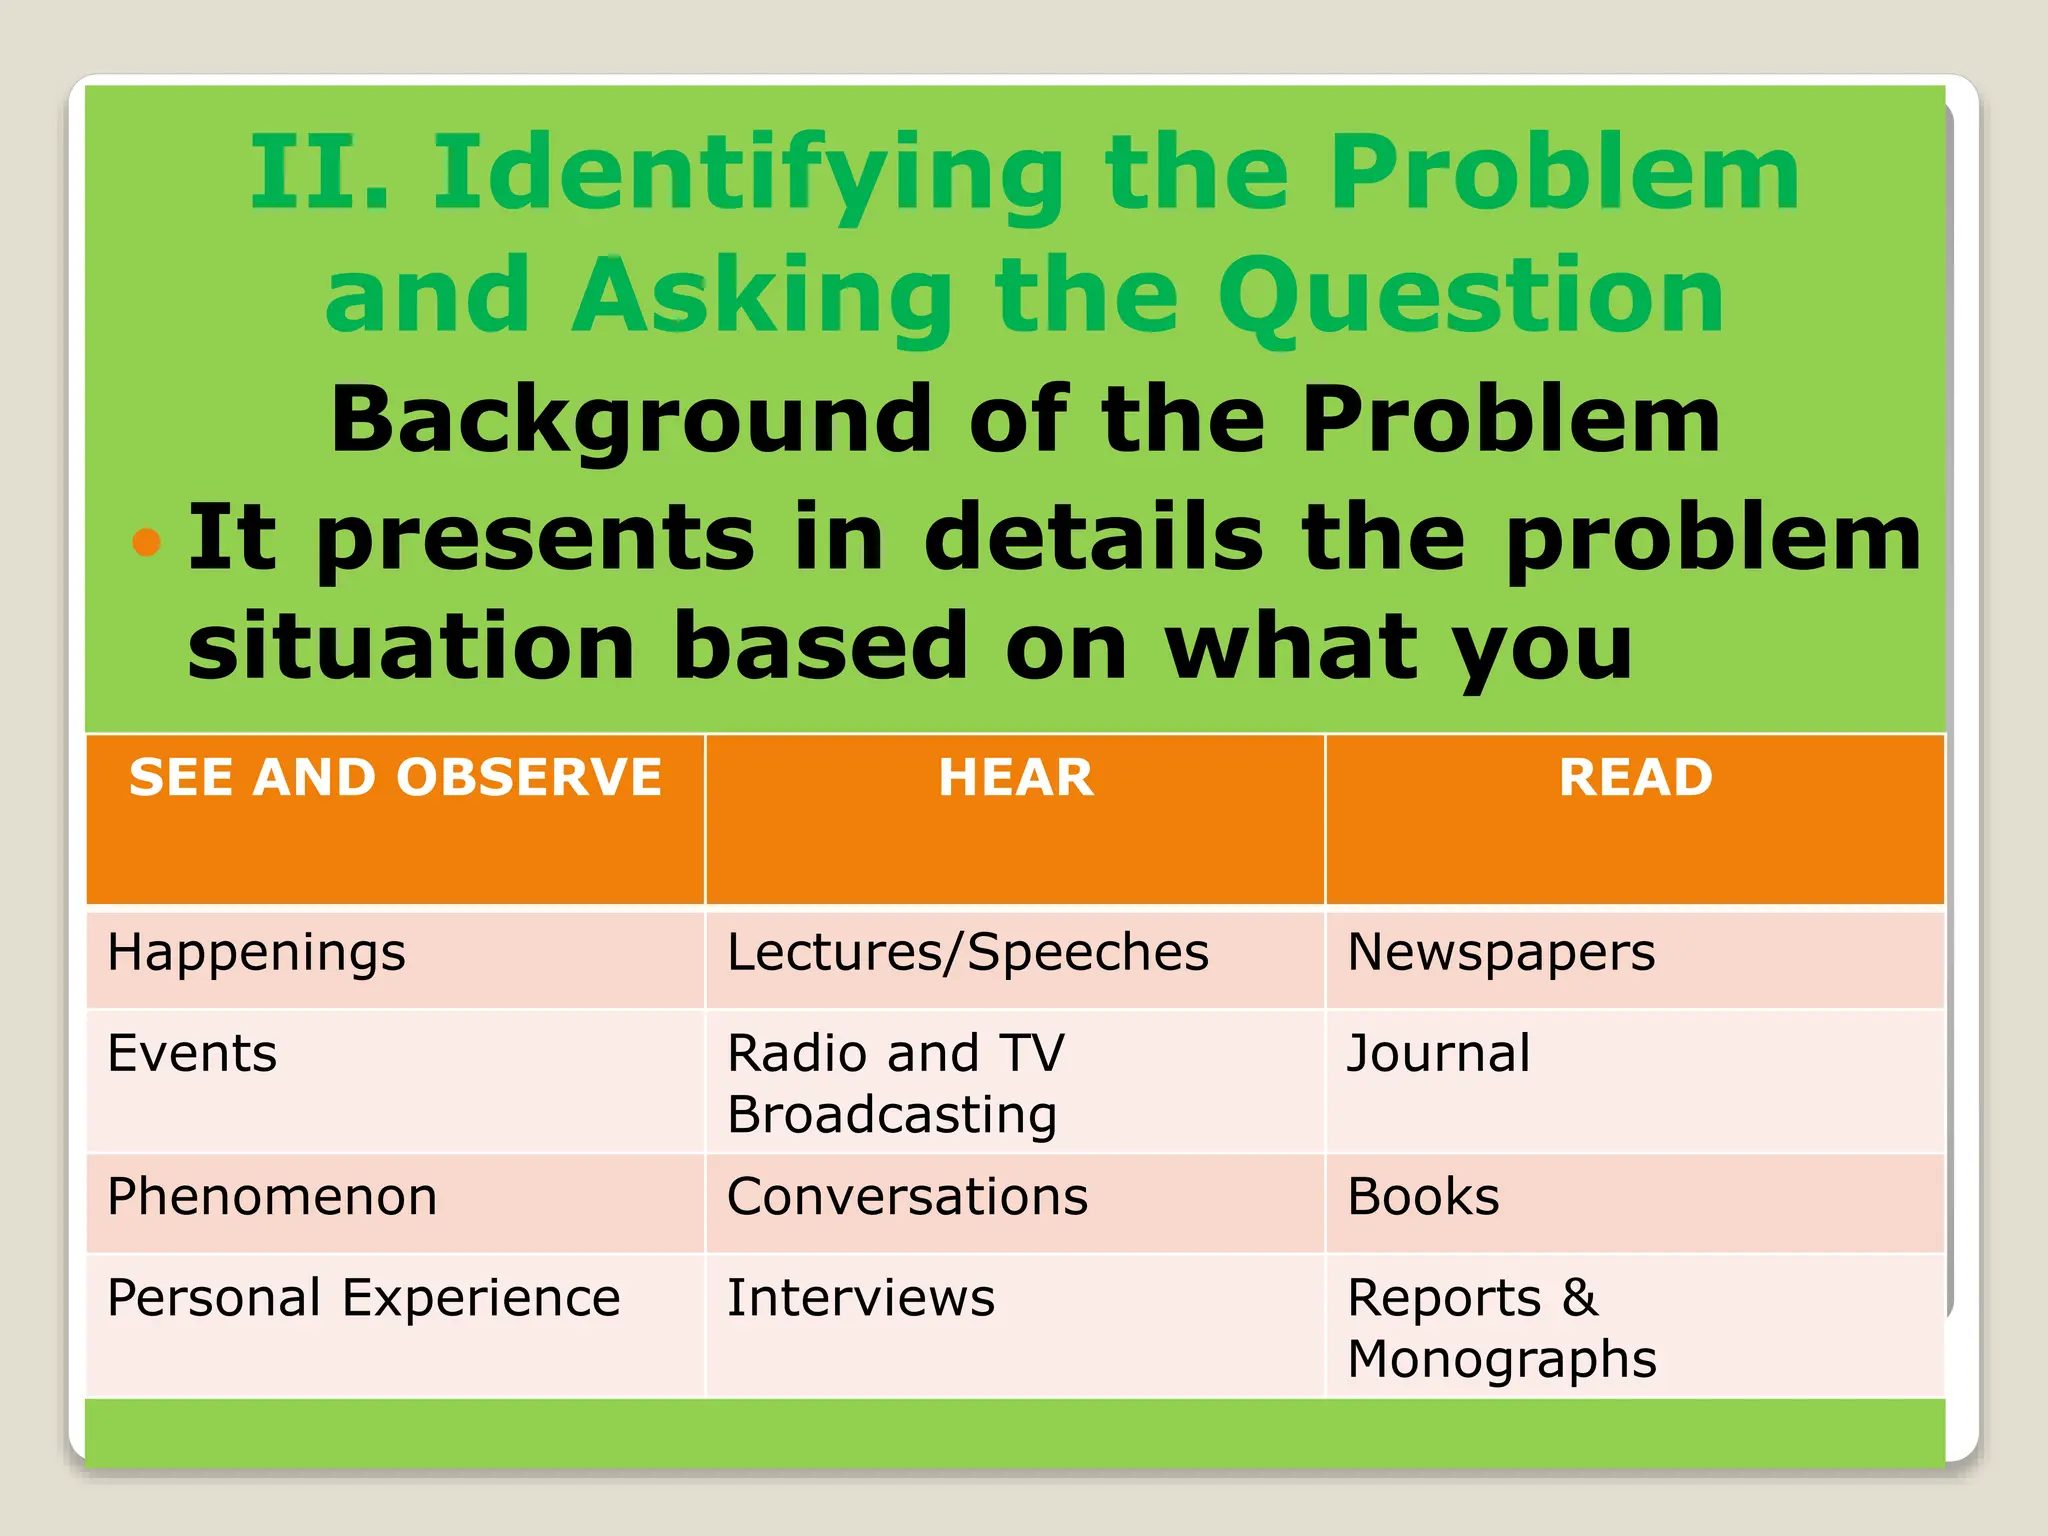
Inquiries, Investigations and
Immersions
 What is research?
 Research is
- A study/investigation
- A scientific investigation
- Is a study on investigation which is done
systematically, empirically, scientifically,
and logically for the purpose of achieving
knowledge and helping solve situational
problems.
 Characteristics of a Research
Process
- Systematic - well defined designs, an
orderly procedure
- Empirical – measurable and observable
things or phenomenon that you can put in
print on the bases of your senses.
- Scientific – can be tested
- Logical – justifiable and acceptable by
reason
Purpose of Research
1. Discover new knowledge
2. Help solve situational problems
 System Framework of research
- INPUT PROCESS OUTPUT
Input Output
Skills and abilities
necessary in
conducting
Research/Scientific
Investigation
(Theories/Principles)
Pure/Basic research
(Idealistic)
Solutions to
problems
(Social
Responsibility
 System Framework of research
Aims at developing a person to be-
• Sensitive to
surroundings
• Systematic
• Critical
• Objective
• Logical
• Rational
• Analytical
ENVIRONMENT
Social
Political
Economic
Educational
Technological
Physical
 Critical Researcher- has the “3rd
eyes”, seeks the truth from what he
reads, does not take them hook-line
and sinker, does not jump into
conclusions. Treat opinions as
opinions
Begin with a
TOPIC in
mind
9
TOPIC
Feasible
Relevant
Significant
10
Brainstorming for Research Topics
1. Scheduling
2. Team teaching
3. Evaluation of
learning,
reporting to
parents
4. Student
regulation
5. Learning styles
6. Peer Tutoring
7. Field trips
8. School facilities
9. Extracurricular
programs
10. Uses of ICT in
Instruction
11. Stress
management
12.Guidance-
counseling
programs
I. Brainstorming for Research
Topics
Key Questions:
a.What do I know about the topic?
b.What should I know about the
topic?
c.What do previous studies say about
my chosen topic?
II. Identifying the Problem
and Asking the Question
Specific Consideration in Choosing
a Problem
 Workability
Is it within the limit and range of your
resource and time constraints?
Will you have access to the number of
samples required?
Is there reason to believe that you can come
up with the answers to the problem?
Is the required methodology manageable and
understandable?
II. Identifying the Problem
and Asking the Question
Specific Consideration in Choosing
a Problem
 Critical Mass
Is the problem sufficient in magnitude and
scope (are there enough variables and
potential results)?
 Interest
Are you interested in the problem?
Does it relate to your career interest?
II. Identifying the Problem
and Asking the Question
Specific Consideration in Choosing
a Problem
 Theoretical Value
Does the problem fill a gap in the literature?
Will it contribute to the advancement in your
field?
Does it improve the “state of the art”?
II. Identifying the Problem
and Asking the Question
Specific Consideration in Choosing
a Problem
 Practical Values
Will the solution to the problem improve
practice?
Are practitioners likely to be interested in the
results?
Will the findings aid the managers in making
sound decisions?
Will the system be changed by the outcome?
Situational Problem – Research Problem
SEE
EXPERIENCE
OBSERVE
HEAR
READ
FEEL
Situation in the
Environment
• Social
• Political
• Physical
• Economic
• Religious/Moral
Meaningful sensation of
the condition in the
environment that bothers
you and which you alone
cannot solve.
RESEARCH PROBLEM
-a scientific
investigation of the
different dimensions
associated with the
situational problem
involving 2 or more
factors or variables
Source of Situational Problem
 Example
Knowledge of child abuse existing
in the environment are problems
that can be derived from this
situation. Problems would be –
a. Do children abused sexually
come from
-broken homes or not
-one-parent homes or not
-poor families or not
 The research problem is just a
part of the whole pie. It
investigates two or more
variables, particularly, how these
variables are related.
II. Identifying the Problem
and Asking the Question
Background of the Problem
 It is the presentation of the
concept of the study in a very
effective manner.
1. It must include an assumption
of significance.
2. It must be a loaded statement
that would drive an impact to
emote interest from the reader.
3. It must be simple, clear, specific
and related to the topic.
II. Identifying the Problem
and Asking the Question
Background of the Problem
 This introductory page acquaints
the reader with the problem to be
dealt with. This orientation is
best accomplished by providing
rationale or background.
II. Identifying the Problem
and Asking the Question
Background of the Problem
 The background intends to draw
a clearer picture of what you
want to say. It describes clearly,
colorfully and vividly the problem
situation which serves as the
rationale of the study.
II. Identifying the Problem
and Asking the Question
Background of the Problem
 It presents in details the problem
situation based on what you
SEE AND OBSERVE HEAR READ
Happenings Lectures/Speeches Newspapers
Events Radio and TV
Broadcasting
Journal
Phenomenon Conversations Books
Personal Experience Interviews Reports &
Monographs
Records of Critical
Incidents
Records of
opinions, positions,
values
Records of findings,
figures/statistical
data
SEE AND OBSERVE HEAR READ
Happenings Lectures/Speeches Newspapers
Events Radio and TV
Broadcasting
Journal
Phenomenon Conversations Books
Personal Experience Interviews Reports &
Monographs
1. Background of the Problem
 The purpose of the background is to
highlight the need for the study by
presenting what is happening at
present and what ought to be using
the data that the researcher has
gathered.
 It identifies the area in which the
problem is to be found, and points
out that the problem had not been
fully studied.
2. Conceptual Framework
This deals with the key concepts and
related literature underlying the
framework that guides the study. The
purpose of this is:
1. To expand the context and
background of the study
2. To help further define the problem
3. To provide an empirical basis for the
subsequent
development/formulation of
hypothesis.
2. Conceptual Framework
The initial step is to identify the
key variables of the study. This refers
to the independent, dependent and
moderator variables to be investigated.
2. Conceptual Framework
The second step is to look for the
definitions of the variables. For the
dependent variables the following should
be done:
1. Define the variable (universal
definition)
2. Describe its characteristics and
indicators
3. Discuss its importance (how it affects
other variables) and how it is affected
by other variables (independent
variables)
2. Conceptual Framework
For the independent variable,
define and describe its characteristics
and indicators. Discuss its effect on the
dependent variable on the basis of the
review of related literature and studies.
The same should be done for the
moderator variables.
2. Conceptual Framework
The discussion should point out
how the previous studies relate to the
present investigation by highlighting
their similarities and differences. More
importantly, it must include some
relevant theories and concepts that
help in the development of the present
study.
2. Conceptual Framework
Organizing the literature review
section by subheadings makes it easier
for the researcher to follow. To be
meaningful, this subheadings should
reflect the variables and their
relationship.
2. Conceptual Framework
We should remember that the purpose of
literature review is to provide a basis for the
formulation of hypothesis.
The conceptual framework is
summarized or synthesized into a logical
network of relationship of the key concepts or
variables involved in the study. This is further
simplified by presenting a research paradigm
or hypothetical illustration of the relationship
of variables and their corresponding
indicators.
3. Research Hypothesis
(for quantitative research)
Hypothesis – is a conjectural statement
of the relation between two or more variables.
It is a tentative or temporary answer to a
research problem.
3. Research Hypothesis
(for quantitative research)
It has the following characteristics:
1. It should conjecture upon a relationship
between two or more variables.
2. It should be stated clearly and
unambiguously in a declarative statement.
3. It should be testable; that is it should be
possible to restate it in an operational form
which can be evaluated based on data.
3. Research Hypothesis
(for quantitative research)
Example:
I.Q. and achievement test are positively
related.
3. Research Hypothesis
(for quantitative research)
There are two approaches for developing
hypothesis:
Deduction – starts from generalization or
theory by logical deduction.
Induction – starts from observation, opinions
to generalizations.
3. Research Hypothesis
(for quantitative research)
General Classification of Hypothesis
RESEARCH/
ALTERNATIVE (H1)
This temporarily
asserts the
relationship of
variables
NULL/TEST (Ho) Denies the relationship
of variables
4. Statement of the Problem
The advantages of stating the
statement of the problem are:
1. It provides the reader with an
immediate basis from which to
interpret subsequent statements
2. It makes it possible to quickly
determine the purpose of the study.
The reader will not have to search
for the introduction and background
to discover the problem being
examined.
4. Statement of the Problem
A problem statement must have the
following characteristics:
1. It should ask about a relationship
between two or more variables.
2. It should be stated clearly,
unambiguously and usually in
question form.
3. It should be possible to collect data
to answer the question asked.
4. It should not represent a moral or
ethical position.
4. Statement of the Problem
One or two sentences will normally
suffice to state the problem. Often the
statement begins as follows:
The purpose of this study is to examine
the relationship between…….(state the
variables, locale and time as the case
maybe).
4. Statement of the Problem
Specifically, it seeks answers to the
following questions:
1. What is the relation between I.Q.
and achievement?
2. Is there a relationship between
economic background and dropout
rate?
5. Definition of Terms
The definition is based on the
observable characteristics of that which
is being defined.
What is important is the nature of these
observations upon which definitions
are based.
5. Definition of Terms
There are 3 approaches or types of
constructing definitions. These are
arbitrarily labelled as A, B, and C by Bruce
W. Tuckman.
A type A definition can be constructed in
terms of the operations that must be
performed to cause the phenomenon or
state being defined to occur.
An intelligent child can be defined
operationally as the child produced by the
marriage of above average, intelligent
couples.
5. Definition of Terms
A type B definition can be constructed in
terms of how the particular object or thing
defined operates, that is what it does or
what constitute its dynamic properties.
Thus an intelligent student can be
operationally defined as a person who gets
high grades in school or a person who
demonstrates capability for solving
complicated mathematical problems.
5. Definition of Terms
A type C definition can be constructed
in terms of what the object or
phenomenon being defined looks like
that is what constitutes its static
properties. Thus, an intelligent student
can be defined for instance as a person
who has a good memory, large
vocabulary, good reasoning ability,
good mathematical skills, etc.
5. Definition of Terms
Ideally, the operational definition
should contain three parts. The first
part is its universal meaning. The
second part is how it is being used in
the study. The third is how it is being
measured.
6. Importance of the Study
It is at this point that the researcher
described who will benefit and what benefits
can be derived from the findings of the
study. The writer, under this section, tries
to sell its importance to the panel or to the
funding agency.
7. Scope and limitations of the Study
This tells the specific boundaries of
the study by describing the place or venue
of the study, the population,
subjects/respondents, time frame, the
variables and their indicators.
Any weakness of the study such as
failure to use a more precise data
gathering or measuring instrument or
failure to execute an important procedure
due to certain circumstances beyond the
researcher’s control form part of the
study’s limitations.
Learner’s Output:
List of Related Literature
LITERATURE REVIEW
A literature review is a re-
view of something that has
already been written
STEP 1a: Literature Review: The Research
Powerhouse
• Generativity is one of the hallmarks of
scholarship (Shulman, 1999). It is the
ability to build on the scholarship and
research of those who have come before
us.
A literature review is an account of what
has been published on a topic by
accredited scholars and researchers
51
 A literature review can be a precursor in
the introduction of a research paper
 A literature review is a critical and in
depth evaluation of previous research. It
is a summary and synopsis of a particular
area of research, allowing anybody
reading the paper to establish why you
are pursuing this particular research
project.
Why do a literature review?
Tips for Searching for Resources
on the Internet
 Finding related research articles
typically requires competence on
the internet.
 Search through databases that
have indexed information on
thousands of research articles
that have been conducted
Tips for Searching for Resources
on the Internet
 List the major or key variables/concepts in the study
 List synonyms for each variable
 Outline the major points to be made in the literature
review
 Do not limit your search to only studies that examine all of
the same variables as your study.
 Put key phrases in quotation marks
 When searching online, use the limit function to reduce
searches that have too many results.
 Limit your use of Google
 Do not cite wikipedia as a source. Like Google, anybody
can edit articles on wikipedia. Therefore, wikipedia
should never be used as a source for an academic paper.
 Use the resources you have to find additional resources.
Tips for Searching for Resources
on the Internet
Boolean logic is the way to
put terms together in a
search by using AND, OR,
NOT
Using AND
 When you use AND you will be
looking for articles containing two or
more words within each article.
For example, employee AND
motivation would retrieve articles
with both words in the article.
Use AND when you are searching for
concepts and want to be more
specific in your search (to narrow it
down).
Using OR
When you use OR you will be looking
for articles containing either one
word or the other word.
For Example, employee OR
personnel OR staff. You would use
OR for similar concepts and
alternative words or synonyms (to
broaden out your search).
Using NOT
When you use NOT you will be
looking for one term but not the
other.
For example, you might search for
broadband NOT wireless. You would
use NOT to exclude irrelevant results
(to narrow down your search).
Table 1 Writing styles – opening sentence
Good opening style Opening style to avoid
Early work by Thomas (1996)
shows that …
Another study on the topic by
Brown (2000) asserts that …
The latest research (Smith,
2003) show …
Thomas (1996) said …
Brown said (2000) …
Smith (2003) wrote ….
Table 2 Verbs and synonyms, to use in writing about text and making an
argument
Account for Clarify Describe Exemplify Investigate Recognize
Analyze
Argues
Assess
Assert
Assume
Claim
Compare &
contrast
Conclude
Criticize
Debate
Defend
Define
Demonstrat
e
Determine
Discuss
Distinguish
Differentiate
Evaluate
Emphasize
Examine
Expand
Explain
Exhibit
Identify
Illustrate
Imply
Indicate
Judge
Justify
Narrate
Outline
Persuade
Propose
Question
Reflect
Refer to
Relate to
Report
Review
Suggest
Summarize
Table 3. Forming critical sentences using signaling words
As a consequence of x then y
Consequently, …
Hence …
Therefore, …
Thus …
In short …
In effect …/ It follows that …
This indicates that …
This suggests that …
This points to the conclusion that …
This most obvious explanation is …
This means that …
Finally, …
Source: Brown and Keeley (2004)
Writing the Literature
Review
Rule 1: State the theory
Suggested Sentence Stems
The theoretical basis of this paper is
This paper is theoretically anchored on
This paper is premised on
The theory of ______ underpins this study
We draw on ___________ to (state the objective of the
paper)
Rule 2: Explain the theory
Rule 3: Contextualize the theory
Writing the Theoretical Background
(The SEC Approach)
LITERATURE REVIEW
Rule 1: Synoptic Dimension
 Defining what the construct is all about
 Stating what has been said about the
variable (relationship, effect, difference) or it
historical development
Rule 2: Argumentative Dimension
 Build arguments either through sentence of
problematising (SOP) or the need for the
study (NFS)
Variable: Teaching Beliefs
Literature 1
Literature 2
Literature 3
Literature 4
Literature 5
Literature 6
Literature 7
Claim 1
Claim 2
Claim 3
Evidence
Evidence
Evidence
How do the findings
relate?
How do the findings
differ?
From these similarities
and differences, what
can we possibly
claim?
Cite specific studies
from your literature
review that will support
the claims made in
frame 2
Indicate the findings
of each of the
literature reviewed
The Need for
Dendrogramming
Literature 1
Finding 1
Finding 2
Finding 3
Literature 2
Finding 1
Finding 2
Finding 3
Finding 4
Literature 3
Finding 1
Finding 2
Finding 3
Literature 4
Finding 1
Finding 2
Finding 3
Literature 5
Finding 1
Finding 2
Finding 3
Finding 4
Finding 5
Example write-up (CF)
The conceptual framework underlying this study is
anchored on the concepts of research capability,
workload, and research productivity.
Research Capability
Research capability is simply the capability of the
faculty to undertake research. All the resources or
inputs which enable the faculty member to conduct
research are considered as components of research
capability (Deza, 1999; Banaag, 1994). Salazar-
Clemena and Almonte-Acosta (2007) enumerated
indicators of research capability which include budget
for research, the ability to obtain research grants, the
provision of research infrastructure, the ability to
collaborate with and access to research professionals,
and the presence of rules and procedure on the
granting of rewards for research.
 In this study, research capability is described in terms
of technical skills in doing research, skills in
conceptualizing a research problem, knowledge and
skills in designing the research plan, knowledge and
skills on research data processing, and knowledge and
skills in writing the research paper. Technical skills
include written communication (expressing one’s
ideas and arguments using language rules, presenting
and packaging ideas effectively); oral communication
(expressing one’s ideas and arguments using
language rules, presenting and packaging ideas
effectively); critical /analytical thinking (evaluating
ideas, analyzing the arguments of others); problem-
solving; research organization (parts, format of a
research paper); online search , use of electronic
resources, databases & search engines; use of
computer commands/programs/ software; and
acknowledging or citing sources/ cross-referencing.
Example write-up (CF)
Determinants of Research Productivity
 Previous foreign and local studies have revealed
that the reasons for low research productivity
among faculty members are poor or lack of
research skills (Anunobi & Emerole, 2008; Iqbal,
2011); lack of research funds (Anunobi &
Emerole, 2008; Iqbal, 2011; Mahilum, 2010);
and heavy workload or teaching overload (Iqbal,
2011; Mahilum, 2010; Mordeno, 2002). Iqbal
(2011) added performance of administrative
duties along with academic duties, nonexistence
of research leave, negative attitude of the faculty
towards research and absence of professional
journals while Anunobi & Emerole (2008)
included time constraints as impediments to
research publication.
Example write-up (CF)
Determinants of Research Productivity
 Predictors of research productivity include
teachers training or having research
orientation (Finkelstein, 1984, Banaag, 1994,
Mordeno, 2002); academic rank (Flanigan, et
al.,1988; Banaag, 1994); highest educational
attainment (Finkelstein, 1984; Flanigan, et
al.,1988; Banaag, 1994);and sufficient time
allocated to research (Finkelstein, 1984).
Example write-up (CF)
While several studies have been made to investigate
correlates of research productivity, studies on
research capability in terms of specific research
skills of teachers were lacking. In this end, the
researchers were motivated to conduct this research
that explored the levels of proficiency of teachers on
different skills that determine their capability in doing
research and how this capability can be associated
to research productivity. Workload in terms of hours
of work and number of teaching preparations was
also investigated to verify its impact on faculty
productivity in research. In the end, it is aimed that
this research may contribute to the existing
literatures on determinants of research productivity.
Example write-up (CF)
Remember!
 Read enough background material to
discuss the research and the theory
giving a reasonably complete account of
our knowledge of the topic
 Present data that are based on data and
theory, including conflicting views of
different researchers.
 Make it easy for the reader to
understand how all of the studies
interrelate.
Writing the Introduction
(The TIOC Approach)
Pointers: The TIOC Approach
• Highlight then trend/s in the field
• Pinpoint the issues underlying the trend/s
• State the overall objective/intent of the
paper in the light of the gap identified
• Discuss the possible contribution of the
research attempt to advancing/improving
disciplinal theory, research, practice and
policy
• (cross-reference to strengthen claims
Source: De Guzamn (2012). Writing for Intl Publication
Some Approaches to Starting the
Introduction
 Make a compelling statement about an
important issue
There is a strong evidence that computer games are hugely
popular. For example, as of 2002, more money was spent on
computer games in the United States- 6.9billion dollars- than
on box-office movies, and approximately 145 million
Americans (or about 60% of the population over age 6)
regularly played computer games (Lee, Park, & Jin, 2006).
Advocates of educational gaming have proposed that
educators should harness the appeal of computer games as a
vehicle for fostering student learning, but reviews of the
research literature have not yielded strong support for the
instructional effectiveness of computer games (Adams,
Mayer, McNamara, Koenig, & Wainess, 2011).
Some Approaches to Starting the
Introduction
 Identifying the Scope of Previous
Research
The literature on suicide and suicide risk factors is extensive.
The research includes clinical reports, intervention strategies,
identification of individual risk factors, demographic patterns
of suicide, and estimates of base rates in different ages and
culture. A subset of this literature has examined suicide in
college students. College students suicide research is
longstanding and an increasing number of articles address
the topic each year (Stephenson, Belesis, & Balliet, 2005)
Some Approaches to Starting the
Introduction
 Presenting a Statistics
Health outcomes are increasingly
recognized as socially patterned, In 2001-
2002, the leading causes of death were
heart disease, cancer and stroke (Jackson,
Kubzansky, & Wright, 2006).
Some Approaches to Starting the
Introduction
 Describing common occurrences
For traditionally male jobs,.. Women are
less likely to be hired than men. They are
also paid less, given less authority, and
promoted less often. ..Conversely, male
applicants are discriminated against for
jobs that are considered feminine (Ulhmann
& Cohen, 2005),
Plagiarism
“Authors do not present the work
of another as if it were their own
work”.
Whether paraphrasing, quoting an author
directly, or describing an idea that
influenced your work, you must credit the
source. To avoid charges of plagiarism,
take careful notes as you research to keep
track of your sources and cite those
sources according to the guidelines.
Table 6.1. Basic Citation Styles
Type of citation First citation in
text
Subsequent
citations in text
Parenthetical
format, first
citation in text
Parenthetical
format,
subsequent
citations in text
One work by
one author
Walker (2007) Walker (2007) (Walker, 2007) (Walker, 2007)
One work by
two authors
Walker and
Allen (2004)
Walker and
Allen (2004)
(Walker &
Allen, 2004)
(Walker &
Allen, 2004)
One work by
three authors
Bradley,
Ramirez, and
Soo (1999)
Bradley et al.
(1999)
(Bradley,
Ramirez & Soo,
1999)
(Bradley et al.,
1999)
One work by
four authors
Bradley,
Ramirez, Soo
and Walsh
(2006)
Bradley et al.
(2006)
(Bradley,
Ramirez, Soo &
Walsh, 2006)
(Bradley et al.,
2006)
Type of citation First citation in
text
Subsequent
citations in text
Parenthetical
format, first
citation in text
Parenthetical
format,
subsequent
citations in text
One work by
five authors
Walker, Allen,
Bradley,
Ramirez, and
Soo (2008)
Walker et al.
(2008)
(Walker, Allen,
Bradley,
Ramirez, & Soo,
2008)
(Walker et al.,
2008)
One work by six
or more authors
Wasserstein et
al. (2005)
Wasserstein et
al. (2005)
(Wasserstein et
al., 2005)
(Wasserstein et
al., 2005)
Groups (readily
identified
through
abbreviation) as
authors
National
Institute of
Mental Health
(NIMH, 2003)
NIMH (2003) (National
Institute of
Mental Health
[NIMH], 2003)
(NIMH, 2003)
Groups (no
abbreviaton) as
authors
University of
Pittsburgh
(2005)
University of
Pittsburgh
(2005)
(University of
Pittsburgh,
2005)
(University of
Pittsburgh,
2005)
References
 Beins, B.C. APA simplified style: Writing in
psychology, nursing, education, and
sociology. USA: John Wiley & Sons, Inc.
 De Guzman, A.B. Writing for international
publication. Presented in a seminar-
workshop 2012
 explorable.com/what-is-a-literature-
review
 Korb, K. (2015). Conducting educational
research: Search the Research Literature
Understanding Ways to Collect
Data
1. Research Design
A research design is a plan or strategy
in order to answer the research problem
and control (variance) for validity. This is
the over-all plan for the conduct of the
investigation.
Hence, substantially a design is
intended to answer the problem; and,
technically it provides control for validity.
Understanding Ways to Collect
Data
1. Research Design
Essentially, research designs may be
classified only in two (2) categories on the
basis of maximum control for validity:
1. non-design or non-experimental
(descriptive)
2. True Design or experimental design
Understanding Ways to Collect
Data
1. Research Design
EXPERIMENTAL RESEARCH
A. Pre-experimental design (non-design)
Not recommended for use
-designs which do not control adequate
against sources of internal validity
1. One shot case study
2. One-group pre-test-post-test design
B. Quasi-experimental design
C. True Experimental Design
Understanding Ways to Collect
Data
1. Research Design
EXPERIMENTAL RESEARCH
A. Pre-experimental design (non-design)
B. Quasi-experimental design
-this design controls some but not all
sources of internal invalidity due to existing
conditions by which experimental control is
difficult if not impossible.
C. True Experimental Design
Understanding Ways to Collect
Data
1. Research Design
EXPERIMENTAL RESEARCH
A. Pre-experimental design (non-design)
B. Quasi-experimental design
1. Expost facto design – This is the study in which
the researcher examine the effects of
naturalistically occurring treatment after that
treatment has occurred rather than creating
the treatment itself. The researcher attempts
to rotate this after the fact.
2. Co-relational standard
C. True Experimental Design
Understanding Ways to Collect
Data
1. Research Design
EXPERIMENTAL RESEARCH
A. Pre-experimental design (non-design)
B. Quasi-experimental design
1. Expost facto design
2. Co-relational standard – this involves two or
more sets of data from a group of subjects with
an attempt to determine the subsequent
relation between those sets of data.
C. True Experimental Design
Understanding Ways to Collect
Data
1. Research Design
EXPERIMENTAL RESEARCH
A. Pre-experimental design (non-design)
B. Quasi-experimental design
1. Expost facto design
2. Co-relational standard – serve as useful
purpose in determining the relationship among
measures and suggesting possible bases for
causality, while correlation does not necessarily
imply causation.
C. True Experimental Design
Understanding Ways to Collect
Data
1. Research Design
EXPERIMENTAL RESEARCH
A. Pre-experimental design (non-design)
B. Quasi-experimental design
C. True Experimental Design – provide
complete adequate controls for all sources of
internal invalidity (only possible for non-human
subjects
1. Post-only control group design
2. Pretest-post test control group design
Experimental Research
 Most powerful design
 Used to establish cause and effect by
manipulating (influencing) an IV
(independent variable, aka
treatment or experimental variable)
to see its effect on a DV (dependent
variable ,aka criterion or outcome
variable)
 Goes beyond description and
prediction
Experimental Research
 Comparison of groups (at least two groups of
subjects, called treatment and control groups)
 Manipulation of the IV (experimenter changes
something for the treatment group that’s
different than the control group)
 Randomization (true experiments require
random assignment into treatment/control
conditions…after random selection of subjects to
participate in study)
 Assignment takes place at start of experiment
Experimental Research
 Do not use already formed groups
 Groups should be equivalent (any
differences due to chance)
 Randomization eliminates threats
from extraneous variables
 Groups must be sufficiently large to
be equivalent
Experimental Research
 All extraneous variables must be controlled
to eliminate threats to validity/rival
hypotheses
 Ensure groups are equivalent to begin using
randomization
 Hold certain variables constant (i.e. age,
IQ) or build them into to the design
Experimental Research
 Use matching when necessary
 Use subjects as their own controls
(treat same group first in control
condition then in treatment OR use
pre-test/posttest on same group)
 Use analysis of covariance to
statistically equate unequivalent
groups
Experimental Research
(Group Designs)
 Weak Designs(Pre experimental Designs)
 True Experimental Designs
 Quasi Experimental Designs
Pre-Experimental Designs
 Do not adequately control for the problems
associated with loss of external or internal
validity
 Cannot be classified as true experiments
 Often used in exploratory research
 Three Examples of Pre-Experimental Designs
◦ One-Shot Design
◦ One-Group Pretest-Posttest Design
◦ Static Group Design
One-Shot Design
 A.K.A. – after-only design
 A single measure is recorded after the treatment
is administered
 Study lacks any comparison or control of
extraneous influences
 No measure of test units not exposed to the
experimental treatment
 May be the only viable choice in taste tests
 Diagrammed as: X O1
One-Group Pretest-Posttest
Design
 Subjects in the experimental group are
measured before and after the treatment
is administered.
 No control group
 Offers comparison of the same individuals
before and after the treatment (e.g.,
training)
 If time between 1st & 2nd measurements is
extended, may suffer maturation
 Can also suffer from history, mortality, and
testing effects
 Diagrammed as O1 X O2
Static Group Design
 A.K.A., after-only design with control group
 Experimental group is measured after being exposed to the
experimental treatment
 Control group is measured without having been exposed to
the experimental treatment
 No pre-measure is taken
 Major weakness is lack of assurance that the groups were
equal on variables of interest prior to the treatment
 Diagrammed as: Experimental Group X O1
Control Group O2
Pretest-Posttest Control
Group Design
 A.K.A., Before-After with Control
 True experimental design
 Experimental group tested before and after
treatment exposure
 Control group tested at same two times without
exposure to experimental treatment
 Includes random assignment to groups
 Effect of all extraneous variables assumed to be
the same on both groups
 Do run the risk of a testing effect
Pretest-Posttest Control Group
Design
 Diagrammed as
◦ Experimental Group: O1 X O2
◦ Control Group: O3 O4
 Effect of the experimental treatment equals
(O2 – O1) -- (O4 – O3)
R
R
Posttest-Only Control Group
Design
 A.K.A., After-Only with Control
 True experimental design
 Experimental group tested after treatment exposure
 Control group tested at same time without exposure
to experimental treatment
 Includes random assignment to groups
 Effect of all extraneous variables assumed to be the
same on both groups
 Do not run the risk of a testing effect
 Use in situations when cannot pretest
Posttest-Only Control Group
Design
 Diagrammed as
◦ Experimental Group: X O1
◦ Control Group: O2
 Effect of the experimental treatment equals
(O2 – O1)
 Example
◦ Assume you manufacture an athlete’s foot remedy
◦ Want to demonstrate your product is better than
the competition
◦ Can’t really pretest the effectiveness of the remedy
R
R
Solomon Four-Group Design
 True experimental design
 Combines pretest-posttest with control group
design and the posttest-only with control group
design
 Provides means for controlling the interactive
testing effect and other sources of extraneous
variation
 Does include random assignment
Solomon Four-Group Design
 Diagrammed as
◦ Experimental Group 1: O1 X O2
◦ Control Group 1: O3 O4
◦ Experimental Group 2: X O5
◦ Control Group 2: O6
 Effect of independent variable (O2 – O4) & (O5 –
O6)
 Effect of pretesting (O4 – O6)
 Effect of pretesting & measuring (O2 – O5)
 Effect of random assignment (O1 – O3)
R
R
R
R
Quasi-Experimental Designs
 More realistic than true experiments
 Researchers lacks full control over the scheduling of
experimental treatments or
 They are unable to randomize
 Includes
◦ Time Series Design
◦ Multiple Time Series Design
 Same as Time Series Design except that a control
group is added
Time Series Design
 Involves periodic measurements on the dependent variable
for a group of test units
 After multiple measurements, experimental treatment is
administered (or occurs naturally)
 After the treatment, periodic measurements are continued
in order to determine the treatment effect
 Diagrammed as:
O1 O2 O3 O4 X O5 O6 O7 O8
Experimenter Bias Effect
 The intentional or unintentional influence
that an experimenter (researcher) may
exert on a study
Correlation Research
(Predicting Outcomes Through
Association)
 Correlational research involves study of existing
relationships between two variables
 Descriptive in nature
 Often a precursor to experimental research
 Positive correlation is Hi/Hi and Lo/Lo (coeff. +r)
 Negative correlation is Hi/Lo and Lo/Hi (-r)
 Purpose is to explain relationships or to predict
outcomes
Correlation Research
(Predicting Outcomes
Through Association)
 Explanatory studies examine relationship to
identify possible cause/effect
 Relationship might or MIGHT NOT mean
causation
 For causation: 1) A before B; 2) A and B
related; 3) Rule out other causes of B (need
experiment)
 Prediction studies identify predictors of
criterions (i.e. HS GPA and College GPA)
 The stronger the correlation the better the
prediction
Correlation Research
(Predicting Outcomes Through
Association)
 Complex Correlation Techniques, such as multiple
regression allow use of several predictors for one criterion
 Coefficient of multiple correlation (R) gives strength of
correlation between predictors and criterion
 Coefficient of determination (r2) is amount x and y vary
together
 Descriminant function analysis is for non-quantitative
criterion (predict which group someone will be in)
 Other techniques also used (factor analysis, path analysis,
structural modeling)
Correlation Research
(Predicting Outcomes Through
Association)
 Problem selection – usually it’s are x and y related
or how well does p predict c
 Sample – random selection of at least 30
 Measurement – need quantitative data
 Design/Procedures – need two measures on each
subject
 Data collection – usually both measures close in
time
 Data analysis – correlation coefficient, r, and plot
(r is -1 to +1, and the closer to plus or minus 1, the
stronger the relationship)
Correlation Research
 General guidelines:
+.75 to +1.0 Very strong relationship
+.50 to +.75 Moderate strong
relationship
+.25 to +.50 Weak relationship
+.00 to +.25 Low to no relationship
 Need .5 or better for prediction of any
use, and .65 for accurate predictions
 Reliability coefficients should be .7 up
 Validity coefficients should be .5 up
Correlation Research
 Remember correlation is not causation
(lurking variables)
 Subject characteristics – may get different
correl w/ different ability levels, gender,
etc. (can control with partial correlation)
 Location – testing conditions can impact
results
 Instrumentation problems – helps to
standardize instrument and data collection
for both groups
Correlation Research
 What factors could affect the variables
being studied?
 Does any factor affect BOTH variables? (this
is where threats occur)
 Figure a way to control any lurking
variables
Causal Comparative Research
(Ex Post Facto)
 Determines cause (or effect) that has occurred and
looks for effect (or cause) from it
 Start w/ differences in groups and examine them
 Examples: Difference in math abilities of
male/female students
 No random assignment to treatment (it already
occurred)
 Associational like correlation but primarily
interested in cause/effect
 IV either cannot (ethnicity) or should not
(smoking) be manipulated
Causal Comparative versus
Correlational Research
 Often an alternative to experimental (faster
and cheaper)
 Serious limitation is lack of control over
threats to internal validity
 Need to remember the cause may be the
effect; they may only be related and there is
some other variable that is the cause
(lurker)
Causal Comparative versus
Correlational Research
 Both are associational (looking for relationship)
 Both are often prelude to experiments
 Neither involves manipulation of variables
 Causal Comparative works with different groups;
correlation examines one group on different
variables
 Correlation is measured w/ coefficient while
Causal comparative compares
means/medians/percents of group members
Causal Comparative Research
versus Experimental Research
 Both compare group scores of some type
 In experimental the IV is manipulated, but
not in CC (already took place)
 CC does not provide as strong evidence as
experimental for cause and effect
Causal Comparative Research
(Steps)
 Problem formation – identify phenomena and look
for causes or consequences of it
 Sometimes several alternate hypotheses
investigated
 Sample – define (operationally) characteristics of
study carefully, then select individuals who possess
 Groups should be homogeneous in regard to several
important variables (to control for them as causes)
then match control/experimental groups on one or
more variables
 Instruments – use any type to compare the groups
 Design – basic CC involves 2 or more groups that
differ on variable of interest (basic design is one
group possesses trait (athlete) other doesn’t
compare DV (GPA)
Causal Comparative Research
(Threats to Internal Validity)
 Subject characteristics – since don’t select
subjects and form groups, there may be
unidentified lurking variables
 Can use matching to control for any identified
differences, but limits samples size
 Can find or create homogeneous groups (for
example compare only high GPA students to
other high GPA students) on attitudes toward x
 Statistical matching – adjusts posttest scores
based on some initial difference
 Other threats – location, instrument, history,
maturation, loss of subjects can be concerns
 Need to control as many as possible to eliminate
alternate hypotheses
Survey Research
(Used to describe what people
think/do/believe)
Types
 Cross sectional provide a snapshot in time
 Longitudinal collect data at different points in time
to study changes over time
 Trend study - random sample each year on same
topic
 Cohort study - sample from same cohort members
year after year
 Panel study - same individuals surveyed year after
year (mortality a problem over long time periods)
 Often surveys are the data collection instrument in
correlation (or cc/exp’l) studies
Steps to conduct Survey
Research
 Define the problem
Needs to be important enough
respondents will invest their time to
complete it
Must be based on clear objectives
 Identify the target population
Defined by sample unit or unit of analysis
Unit can be a person, school, classroom,
district, etc.)
Survey a sample or do a census of the
population
Survey Research
(Steps to conduct survey research)
Methods of data collection
Direct administration to a group (such as at a meeting)
- good response rate, limited generalize.
Mail survey (inexpensive way to get large amount of
data from widespread pop) - lower response rates, not
in-depth info, illiterate missed
Telephone survey (cheap/fast) - response rates higher
due to encouragement (“I’m not selling…”); miss some
pop members, interviewer bias possible
Personal interviews (face-to-face has good response
rate but time and cost high) - lack anonymity,
interviewer bias
Survey Research
(Steps to conduct survey research)
 Select the sample (randomly, but check to see
respondents are qualified to answer)
Pilot test can indicate likely response rate and
problems with data collection or sample
 Prepare instrument (questionnaire and
interview schedule)
 Appearance important - look short and easy
 Clarity in questions is essential
Survey Research
(Steps to conduct survey research)
 Question types (same questions need to be asked
of all respondents)
 Closed ended (multiple choice) - easier to
complete, score, analyze
 Categories must be all inclusive, mutually
exclusive
 Open ended - easy to write, hard to analyze and
hard on respondents
Population
This describes the population of the study and
the method of getting the representative
sample (of the population). The total
population of interest and the number of the
sample subjects of the study are given and
embodied in a table.
 Sample – any group on which info is obtained
 Population – group that researcher is trying to
represent
 Population must be defined first; more closely
defined, easier to do, but less generalizable
 Study a subset of the population because it is
cheaper, faster, easier, and if done right, get same
results as a census (study of whole population)
 Accessible population – the group you are able to
realistically generalize to…may differ from target
population
Sample and Population
Sampling Method
 Random – every population element has an
equal and independent chance to participate
Uses names in a hat or table or random
numbers
Elimination of bias in selecting the sample
is most important (meaning the researcher
does not influence who gets selected)
Ensuring sufficient sample size is second
most important
Random v. Nonrandom Sampling
 Nonrandom/purposive - troubles
with
representativeness/generalizing
Random v. Nonrandom Sampling
Names in a hat or table of random
numbers
Larger samples more likely to
represent population.
Any difference between
population and sample is random
and small (called random sampling
error)
Simple Random Sampling
 Ensures small subgroups (strata)
are represented
 Normally proportional to their part
of population
 Break population into strata, then
randomly select w/in strata
 Multistage sampling
Stratified random sampling
 Select groups as sample units
rather than individuals
 REQUIRES a large number of
groups/clusters
 Multistage sampling
Cluster Random Sampling
 Considered random is list if
randomly ordered or nonrandom if
systematic w/ random starting
point
 Divide population size by sample
size to get N (ps/ss=N)
 Systematic can be nonrandom if
list is ordered
Systematic (Nth) Sampling
 Using group that is
handy/available (or volunteers)
 Avoid, if possible, since tend not
to be representative due to
homogeneity of groups
 Report large number of
demographic factors to see
likeliness of representativeness
Convenience Sampling
 Using personal judgment to select
sample that should be
representative (i.e., this faculty
seems to represent all teachers)
OR selecting those who are known
to have needed info (interested in
talking only to those in power)
 Snowball is a type (used with hard
to identify groups such as addicts)
Purposive Sampling
Sample size affects accuracy of
representation
 Larger sample means less
chance of error
 Minimum is 30; upper limit is
1,000 (see table)
Sampling
Representative sample is required (not
the same thing as variety in a sample)
 High participation rate is needed
 Multiple replications enhance
generalization when nonrandom
sampling is used
 Ecological generalization (generalizable
to other settings/conditions, such as
using a method tested in math for
English class)
Sampling
Data Collection Procedure
This represents the logical procedure in
collecting and treating data to answer the research
question and the hypothesis:
The usual order of presentation of this
section is chronological, for instance:
1) Requesting permission from the concerned
authorities to conduct the investigation and to
administer the research instruments to the
subjects, including its approval thereof attached as
an appendix;
Data Collection Procedure
2) Orientation and actual administration or
mailing of the research instrument;
3) Follow-ups of those who failed to return
the instrument before the deadline set;
4) Gathering of the duly accomplished
research instrument.
This section tells the reader what you did
and how you did it. Any errors or weaknesses in
the procedures that have been discovered during
the conduct of the research should be pointed out,
and any consequent limitations upon the research
should be fully noted.
Instrumentation
(Measurement)
• Data – information researchers obtain
about subjects
◦ Demographic data are
characteristics of subjects such as
age, gender, education level, etc.
◦ Assessment data are scores on
tests, observations, etc. (the device
used to measure these is called the
measurement instrument)
Instrumentation
• Validity – measures what it is supposed to
(accurate)
• Reliability – a measure that consistently
gives same readings (repeatable)
Instrumentation
• Objectivity – absence of subjective
judgments (need to eliminate subjectivity
in measuring)
• Usability of instruments
◦ Consider ease of administration; time
to administer; clarity of directions;
ease of scoring; cost; reliability/validity
data availability
Instrumentation
(Classifying Data Collection
Instruments)
• By the group providing the data
◦ Researcher instruments (researchers
observes student performance and
records)
◦ Subject instruments (subjects record
data about themselves, such as taking
test)
◦ Others/Informants (3rd party reports
about subjects such as teacher rates
students)
• By where instrument came from
◦ Preference is for existing
◦ Can develop your own (requires time,
effort, skill, testing;
• By response type
◦ Written response – preferred – objective
tests, rating checklist
◦ Performance instruments – measure
procedure, product
Instrumentation
(Classifying Data Collection
Instruments)
Instrumentation(Examples of
Data Collection Instruments)
• Researcher Completed Instruments
◦ Rating scales (mark a place on a continuum
for example numeric rating 1=poor to 5=
excellent)
◦ Interview schedules (complete scales as
interview takes place; use precoding; beware
of dishonesty)
Instrumentation(Examples of
Data Collection Instruments)
• Researcher Completed Instruments
◦ Tally sheets (for counting/recording
frequency of behavior, remarks, activities,
etc.)
◦ Flow charts (to record interactions in a room)
◦ Anecdotal records (need to be specific and
factual)
◦ Time/Motion logs (record what took place and
when)
Instrumentation
• Item Formats
◦ Selection items or closed response (T/F;
Yes/No; Right/Wrong; Multiple choice)
◦ Supply items or open ended (short answer;
essay)
◦ Unobtrusive measures (no intrusion into
event… usually direct observation and
recording)
Instrumentation
• Types of Scores
◦ Raw scores (initial score or count
obtained…w/out context)
◦ Derived scores (raw scores translated to
meaningful usage with standardized process)
 Age/Grade equivalence; Percentile ranks;
Standard scores (how far a score is from a given
reference point, i.e. z and T scores);
 Which to use depends on the purpose; usually
standard scores used
Instrumentation
• Norm Referenced v. Criterion Referenced Tests
• Norm referenced scores give a score relative to
a reference group (the norm group)
◦ Criterion referenced scores determine if a
criterion has been mastered
◦ These are used to improve instruction since
they indicate what students can or cannot do
or do or do not know
Instrumentation
(Measurement Scales)
• Nominal (in name only)
◦ Numbers are only name tags, they have no
mathematical value (gender: 1=male and 2=
female OR race: 1= Blk, 2=Wht, 3=other)
• Ordinal (in name, plus relative order)
◦ Numbers show relative position, but not
quantity (grade level, finishing place in a
race)
Instrumentation
(Measurement Scales)
• Interval (in name w/ order AND equal distance)
◦ Numbers show quantity in equal intervals, but an
arbitrary zero (can have negative numbers;
degrees C or F)
• Ratio (in name, w/ order, eq. distance AND absolute
zero)
◦ Numbers show quantity with base of zero where
zero means the construct is absent
• Higher levels more precise…collect data at highest
level possible; some statistics only work with higher
level data
Instrumentation
(Preparing for Data Analysis)
• Scoring data – use exact same format for
each test and describe scoring method in
text
• Tabulating and Coding – carefully transfer
data from source documents to computer
◦ Give each test an ID number
◦ Any words must be coded with numerical
values
◦ Report codes in text of research report
Measurement Instruments
 Types of instruments
◦ Cognitive – measuring intellectual processes
such as thinking, memorizing, problem
solving, analyzing, or reasoning
◦ Achievement – measuring what students
already know
◦ Aptitude – measuring general mental ability,
usually for predicting future performance
Measurement Instruments
 Types of instruments (continued)
◦ Affective – assessing individuals’ feelings,
values, attitudes, beliefs, etc.
 Typical affective characteristics of interest
◦ Values – deeply held beliefs about ideas, persons, or
objects
◦ Attitudes – dispositions that are favorable or unfavorable
toward things
◦ Interests – inclinations to seek out or participate in
particular activities, objects, ideas, etc.
◦ Personality – characteristics that represent a person’s
typical behaviors
Measurement Instruments
 Types of instruments (continued)
◦ Affective (continued)
 Scales used for responding to items on affective tests
◦ Likert
 Positive or negative statements to which subjects
respond on scales such as strongly disagree, disagree,
neutral, agree, or strongly agree
◦ Semantic differential
 Bipolar adjectives (i.e., two opposite adjectives) with a
scale between each adjective
 Dislike: ___ ___ ___ ___ ___ :Like
◦ Rating scales – rankings based on how a subject would
rate the trait of interest
Obj. 5.1
Measurement Instruments
 Types of instruments (continued)
◦ Affective (continued)
 Scales used for responding to items on affective
tests (continued)
◦ Thurstone – statements related to the trait of interest to
which subjects agree or disagree
◦ Guttman – statements representing a uni-dimensional
trait
Obj. 5.1
Measurement Instruments
 Issues for cognitive, aptitude, or affective
tests
◦ Problems inherent in the use of self-report
measures
 Bias – distortions of a respondent’s performance or
responses based on ethnicity, race, gender, language,
etc.
 Responses to affective test items
◦ Socially acceptable responses
◦ Accuracy of responses
◦ Response sets
◦ Alternatives include the use of projective tests
Finding the Answers to the
Research Question
1. Interpretation of Data
Quantitative
Analysis
Descriptive Statistics
 For descriptive problems that require
finding out “what is,” as the term implies,
descriptive statistical analysis can be
used to describe the data. The mean,
median, mode and standard deviation are
the main descriptive statistical treatment
applicable. The mean or median is used
to indicate the average while the
standard deviation provides the
variability of the data/scores in the
sample.
Sample of Computer Output
N Min Max Mean SD
TEST
THIRDQ
FOURTHQ
Valid N
(listwise)
56
56
56
56
1.0
2.0
5.0
2.0
46.0
7.0
1.5
21.8
24.3
0.5
17.6
7.4
Sample Frequencies
Frequency Percent Percent
Cum.
Valid
Percent
Female
Male
Total
216
258
474
45.6
54.4
100.0
45.6
54.4
100.0
45.6
100.0
Illustration:
Characteristic Profile
A. Gender
F %
Male
Female
Total
216
258
474
45.6
54.4
100.0
Sample Interpretation
 as to gender, the respondents were
mostly female (since the modal class is
female).
Illustration 2.
Age
F %
 30-32 5 6.25
 27-29 43 53.75
 24-26 29 36.25
 21-23 3 3.75
 Total 80 100
Interpretation
◦ Results on the table show that most of the
respondents were within the age range of
27-39 (43 or 53.75%). However it could be
seen that the combined ranges from 24-26
to 27-39 composed almost 90% of the
respondents.
◦ From this, it could be said that most of the
respondents were young adults.
Descriptive Statistics Used in
Evaluation Studies
Illustration
EVALUATION OF THE CONTEXTUAL
TEACHING MATERIALS BY
EXPERTS
Contents Mean Verbal Des.
 Concept definition 4.6 Excellent
 Presentation of concepts 4.6 Excellent
 Sufficiency of Problem
scenarios and examples 5.0 Excellent
 Sufficiency of questions to
ignite the critical thinking 4.8 Excellent
 Writing of the topics within
to the level of the student’s
understanding 4.8 Excellent
Interpret results on the
context of the study
 The concepts in the CTL were presented in
real situations that are familiar to the
students (X=4.6). This is the basic principle
strictly adhered to in a contextual teaching
approach, thus, if the materials fail in this
aspect, there is no contextual approach.
Since the experts judged the criterion as
excellent, it only means that the CTL
materials were successful in translating the
concepts to true-to-life experiences.
Inferential
Statistics
Correlation
Techniques
 Bivariate Analysis
Interval Data Pearson’s r
Ranked Data Spearman rho
Kendall Tau
Nominal data Chi square
Comparison of
Groups
 2 Groups T-test of Difference
between means of Independent Data
 2 sets of scores of 1 group (ie
Comparison of Pre & Posttest) T-test of
Difference Between Means of Correlated
Data
Comparison of 3 or more Groups –
Analysis of Variance.
Sample of a Correlation Matrix
# of
Childrn
Age Incom Yrs
inSch
Educ
# of
Childrn
r 1.0 .404 -.018 -.237 -.172
2-t sig . .000 .489 .000 .000
Age r .4041 1 -.047 -.250 .149
2-t sig .000 .070 . .000 .000
Incom r -.018 .047 1 .361 .360
2-t sig .489 .070 . 000 . .000
Yrs inSch r -.237 -.259 .361 1 .864
2-t sig .000 .000 .000 . .000
Interpreting correlation
coefficient
 Positive correlation:
X Y
X Y
 Negative correlation:
X Y
X Y
Illustration
 Subjects being Pearson’s r Significance
Related
Mathvs.MathNEAT 0.77095 significant
Sci vs.Sci(NEAT) 0.79908 significant
Eng vs.Eng(NEAT) 0.69801 significant
HEKASI vs HEKASI 0.23142 not sig.
 It is necessary to explore the statistical
significance by using the critical value,
however, it is much better to determine
whether the computed Pearson's r denotes
a high correlation between the variable
concerned because statistical
significance may only be negligible or
too low to consider. Computer
statistical outputs provide the
probability of alpha which may
indicate the percent of occurrence of
the error to reject the null hypothesis
when it is true.
Sample Interpretation
 As shown in the table, math
achievement is significantly related to
the result of the NEAT in mathematics
(r=.77). This means that the NEAT
results in mathematics relate to the
math achievement of the students in
school. If a pupil performs well in
school mathematics, he is likely to get
high in the NEAT.
Test of Difference
Between Groups
The Pretest/Posttest control
group Design
 Experimental grp. R O1 X O2
 Control grp. R O3 O4
where: 01 and 03 are pretests
02 and 04 are posttest
Possible Results of the design
 O2 = O4; The traditional and
experimental approach have the same
results.
 O2 > O4; The experimental group have
better results.
 O2 < O4: The control group have better
results.
Sample of T-test Output
One-Sample Statistics
N Mean Std. Dev Std.
Error
of the
mean
Pre
Post
29
29
6.50
40.20
1.60
4.00
.29
.74
t – Value = 0.8972 (Probability of t = 0.4831)
T Stat continued
Paired
Difference
Std.
Dev
t df Sig. (2-
tailed)
Pair 1
PRE
POST
33.70 2.90 61.05 28 .000
Sample of T-test Output
Independent samples
Group Statistics
N Mean Std. Dev Std. Error
of the
mean
Post
Exp Grp
Control
15
4
40.4
40.0
4.3
3.8
1.14
1.01
T Stat continued
T-TEST
FOR =
of
Means
Std.
Error
t df Sig. (2-
tailed)
Equal
variances
assumed
.232 1.5 .264 27 .794
Sample result for
Experimental
Design and Group
Comparison By T-
test
Difference Between 2 Groups
 Difference Between the Experimental &
Control groups in the pre-test
Statistics Experimental Control Group
 Mean 7.6 7.4
 SD 11.1 6.0
 N 50 50
 t – Value = 0.8972
 (Probability of t = 0.4831)
Interpretation
◦ The computed t-value for the difference
between the pretest scores of the control and
experimental groups shows no significant
difference since the probability of error (.4831)
is more than the target level (.05).
◦ The two groups are equally prepared for the
experimentation as indicated by the very close
means of the control (7.6) and experimental
groups(7.4).
Comparing 3 or
More Groups By
Analysis of
Variance
Illustrating an ANOVA Table
ANOVA Statistics for Weight Difference
of Three Groups of Broilers
Source of Var. df SS MS F Prob.
of F
 Between G 2 0.0932 0.046 2.84
0.0429
 Within G 9 0.1479 0.016
 Total 11 0.2411
Interpretation of
the ANOVA table
Analysis of Variance for the
Three Groups
 The ANOVA table shows that the computed F
is significant at 0.04 level. The difference was
significant among the groups concerned. At
0.05 level, the null hypothesis, which states
that no difference exists among the groups,
was rejected. It means that the three groups
of broilers were significantly different in terms
of feed conversion.
 (It is necessary to show the basis of the
difference, thus, the researcher must present
next the means of the three groups.
Tell the difference by
the means
Groups Mean
 Group A 18.5
 Group B 15.2
 Group C 15.4
Explain the reason
 The difference was explicit on the weight
of the broilers. The broilers mixed fed
with corn were heavier than the rest.
The two groups, those mixed fed with
grass and camote tops had almost similar
mean weights. This shows that corn
mixed in feeds resulted to heavier
chicken because of the high protein
carbohydrate content of corn compared
to those mixed fed with plant products.
Two-Way ANOVA
Two-Way ANOVA
 To find Difference Among Groups
Mean1=Mean2=Mean3=…=Mean4
 To find Interaction Between Variables
MeanB11=MeanB12=MeanB13…=MeanBij
Illustration 1
Problem: Is constructivism strategy
effective in teaching Analytic Geometry?
One Solution: Test it between groups
 1 group given the constructivist Strategy
 1 group given the traditional approach
 Is there an interaction between method
of teaching and the ability of the
students?
Solution
 Use two-way ANOVA to compare
between groups and determine
interaction between variables.
Illustration 2
 Is Constructivist Strategy In Teaching
Effective?
 Is there an interaction between This
Method and the ability of the students?
Sample Problem
Using and
Interpreting the
Two-Way ANOVA
Results
Performance in Analytic Geometry by
treatment group
& Mathematical Background
Group Mathematical Background
High Average Low Total
T1 18.60 15.20 17.20 51
T2E 20.00 21.70 19.00 60.7
T3 14.50 17.10 15.00 46.6
T4E 19.20 19.60 13.90 52.7
72.30 73.60 65.10 211.0
Analyze mean performances and try to
find out the highest and the lowest.
 Observe that for those with high math
ability group the highest mean was for
the T2 group.
 For the Average and Low Math ability
groups, the highest means were also
recorded for the T2 Group.
 Among the three math ability groups, the
highest recorded performance was for
the average math ability group.
Two-Way ANOVA Statistics
SV SS df X2 F F Prob
 Group 115.70 3 38.56 6.17 0.029
 Math Bck 35.00 2 17.50 2.80 0.115
 Interaction 7.10 6 12.85 2.05 0.045
 Error 150.10 24 6.25
 Total 377.90 35
 To interpret the results, observe the
probability of alpha (p-value). This will
indicate whether the result is significant or
not. Since alpha is the probability of
rejecting the Ho when it is true, its value
must be less than the targeted alpha.
 Thus, the table shows that the interaction
is significant. This will be the basis for
answering the problem. If it is not
significant, it follows that the researcher
should examine the significance of the row
or column differences between the means.
 Since the Interaction effect is significant,
the researcher could pinpoint in the
conclusion the observe differences. The
higher means could be used as basis for
the conclusions.
 Since the highest mean was observed for
the average mathematics ability group, it
could be said that the constructivist
method worked well with them.
 T2 had the higher mean score compared
to T4 which is also an experimental group.
Compared to the control groups, both
experimental groups had high mean
performances.
Conceptualized Framework for
Qualitative Research
2. Conceptual Framework
This deals with the key concepts and
related literature underlying the
framework that guides the study. The
purpose of this is:
1. To expand the context and
background of the study
2. To help further define the problem
3. To provide an empirical basis for the
subsequent
development/formulation of
hypothesis.
Summary of Findings
Conclusions
Recommendations
List of References
APA Style
Written Research Report
Draft Written Research Report
for Oral Presentation
Final Written Research Report for
Submission

INQUIRIES INVESTIGATIONS & IMMERSIONS.pptx

  • 1.
  • 2.
     What isresearch?
  • 3.
     Research is -A study/investigation - A scientific investigation - Is a study on investigation which is done systematically, empirically, scientifically, and logically for the purpose of achieving knowledge and helping solve situational problems.
  • 4.
     Characteristics ofa Research Process - Systematic - well defined designs, an orderly procedure - Empirical – measurable and observable things or phenomenon that you can put in print on the bases of your senses. - Scientific – can be tested - Logical – justifiable and acceptable by reason
  • 5.
    Purpose of Research 1.Discover new knowledge 2. Help solve situational problems
  • 6.
     System Frameworkof research - INPUT PROCESS OUTPUT Input Output Skills and abilities necessary in conducting Research/Scientific Investigation (Theories/Principles) Pure/Basic research (Idealistic) Solutions to problems (Social Responsibility
  • 7.
     System Frameworkof research Aims at developing a person to be- • Sensitive to surroundings • Systematic • Critical • Objective • Logical • Rational • Analytical ENVIRONMENT Social Political Economic Educational Technological Physical
  • 8.
     Critical Researcher-has the “3rd eyes”, seeks the truth from what he reads, does not take them hook-line and sinker, does not jump into conclusions. Treat opinions as opinions
  • 9.
  • 10.
  • 11.
    Brainstorming for ResearchTopics 1. Scheduling 2. Team teaching 3. Evaluation of learning, reporting to parents 4. Student regulation 5. Learning styles 6. Peer Tutoring 7. Field trips 8. School facilities 9. Extracurricular programs 10. Uses of ICT in Instruction 11. Stress management 12.Guidance- counseling programs
  • 12.
    I. Brainstorming forResearch Topics Key Questions: a.What do I know about the topic? b.What should I know about the topic? c.What do previous studies say about my chosen topic?
  • 13.
    II. Identifying theProblem and Asking the Question Specific Consideration in Choosing a Problem  Workability Is it within the limit and range of your resource and time constraints? Will you have access to the number of samples required? Is there reason to believe that you can come up with the answers to the problem? Is the required methodology manageable and understandable?
  • 14.
    II. Identifying theProblem and Asking the Question Specific Consideration in Choosing a Problem  Critical Mass Is the problem sufficient in magnitude and scope (are there enough variables and potential results)?  Interest Are you interested in the problem? Does it relate to your career interest?
  • 15.
    II. Identifying theProblem and Asking the Question Specific Consideration in Choosing a Problem  Theoretical Value Does the problem fill a gap in the literature? Will it contribute to the advancement in your field? Does it improve the “state of the art”?
  • 16.
    II. Identifying theProblem and Asking the Question Specific Consideration in Choosing a Problem  Practical Values Will the solution to the problem improve practice? Are practitioners likely to be interested in the results? Will the findings aid the managers in making sound decisions? Will the system be changed by the outcome?
  • 17.
    Situational Problem –Research Problem SEE EXPERIENCE OBSERVE HEAR READ FEEL Situation in the Environment • Social • Political • Physical • Economic • Religious/Moral Meaningful sensation of the condition in the environment that bothers you and which you alone cannot solve. RESEARCH PROBLEM -a scientific investigation of the different dimensions associated with the situational problem involving 2 or more factors or variables Source of Situational Problem
  • 18.
     Example Knowledge ofchild abuse existing in the environment are problems that can be derived from this situation. Problems would be – a. Do children abused sexually come from -broken homes or not -one-parent homes or not -poor families or not
  • 19.
     The researchproblem is just a part of the whole pie. It investigates two or more variables, particularly, how these variables are related.
  • 20.
    II. Identifying theProblem and Asking the Question Background of the Problem  It is the presentation of the concept of the study in a very effective manner. 1. It must include an assumption of significance. 2. It must be a loaded statement that would drive an impact to emote interest from the reader. 3. It must be simple, clear, specific and related to the topic.
  • 21.
    II. Identifying theProblem and Asking the Question Background of the Problem  This introductory page acquaints the reader with the problem to be dealt with. This orientation is best accomplished by providing rationale or background.
  • 22.
    II. Identifying theProblem and Asking the Question Background of the Problem  The background intends to draw a clearer picture of what you want to say. It describes clearly, colorfully and vividly the problem situation which serves as the rationale of the study.
  • 23.
    II. Identifying theProblem and Asking the Question Background of the Problem  It presents in details the problem situation based on what you SEE AND OBSERVE HEAR READ Happenings Lectures/Speeches Newspapers Events Radio and TV Broadcasting Journal Phenomenon Conversations Books Personal Experience Interviews Reports & Monographs
  • 24.
    Records of Critical Incidents Recordsof opinions, positions, values Records of findings, figures/statistical data SEE AND OBSERVE HEAR READ Happenings Lectures/Speeches Newspapers Events Radio and TV Broadcasting Journal Phenomenon Conversations Books Personal Experience Interviews Reports & Monographs
  • 25.
    1. Background ofthe Problem  The purpose of the background is to highlight the need for the study by presenting what is happening at present and what ought to be using the data that the researcher has gathered.  It identifies the area in which the problem is to be found, and points out that the problem had not been fully studied.
  • 26.
    2. Conceptual Framework Thisdeals with the key concepts and related literature underlying the framework that guides the study. The purpose of this is: 1. To expand the context and background of the study 2. To help further define the problem 3. To provide an empirical basis for the subsequent development/formulation of hypothesis.
  • 27.
    2. Conceptual Framework Theinitial step is to identify the key variables of the study. This refers to the independent, dependent and moderator variables to be investigated.
  • 28.
    2. Conceptual Framework Thesecond step is to look for the definitions of the variables. For the dependent variables the following should be done: 1. Define the variable (universal definition) 2. Describe its characteristics and indicators 3. Discuss its importance (how it affects other variables) and how it is affected by other variables (independent variables)
  • 29.
    2. Conceptual Framework Forthe independent variable, define and describe its characteristics and indicators. Discuss its effect on the dependent variable on the basis of the review of related literature and studies. The same should be done for the moderator variables.
  • 30.
    2. Conceptual Framework Thediscussion should point out how the previous studies relate to the present investigation by highlighting their similarities and differences. More importantly, it must include some relevant theories and concepts that help in the development of the present study.
  • 31.
    2. Conceptual Framework Organizingthe literature review section by subheadings makes it easier for the researcher to follow. To be meaningful, this subheadings should reflect the variables and their relationship.
  • 32.
    2. Conceptual Framework Weshould remember that the purpose of literature review is to provide a basis for the formulation of hypothesis. The conceptual framework is summarized or synthesized into a logical network of relationship of the key concepts or variables involved in the study. This is further simplified by presenting a research paradigm or hypothetical illustration of the relationship of variables and their corresponding indicators.
  • 33.
    3. Research Hypothesis (forquantitative research) Hypothesis – is a conjectural statement of the relation between two or more variables. It is a tentative or temporary answer to a research problem.
  • 34.
    3. Research Hypothesis (forquantitative research) It has the following characteristics: 1. It should conjecture upon a relationship between two or more variables. 2. It should be stated clearly and unambiguously in a declarative statement. 3. It should be testable; that is it should be possible to restate it in an operational form which can be evaluated based on data.
  • 35.
    3. Research Hypothesis (forquantitative research) Example: I.Q. and achievement test are positively related.
  • 36.
    3. Research Hypothesis (forquantitative research) There are two approaches for developing hypothesis: Deduction – starts from generalization or theory by logical deduction. Induction – starts from observation, opinions to generalizations.
  • 37.
    3. Research Hypothesis (forquantitative research) General Classification of Hypothesis RESEARCH/ ALTERNATIVE (H1) This temporarily asserts the relationship of variables NULL/TEST (Ho) Denies the relationship of variables
  • 38.
    4. Statement ofthe Problem The advantages of stating the statement of the problem are: 1. It provides the reader with an immediate basis from which to interpret subsequent statements 2. It makes it possible to quickly determine the purpose of the study. The reader will not have to search for the introduction and background to discover the problem being examined.
  • 39.
    4. Statement ofthe Problem A problem statement must have the following characteristics: 1. It should ask about a relationship between two or more variables. 2. It should be stated clearly, unambiguously and usually in question form. 3. It should be possible to collect data to answer the question asked. 4. It should not represent a moral or ethical position.
  • 40.
    4. Statement ofthe Problem One or two sentences will normally suffice to state the problem. Often the statement begins as follows: The purpose of this study is to examine the relationship between…….(state the variables, locale and time as the case maybe).
  • 41.
    4. Statement ofthe Problem Specifically, it seeks answers to the following questions: 1. What is the relation between I.Q. and achievement? 2. Is there a relationship between economic background and dropout rate?
  • 42.
    5. Definition ofTerms The definition is based on the observable characteristics of that which is being defined. What is important is the nature of these observations upon which definitions are based.
  • 43.
    5. Definition ofTerms There are 3 approaches or types of constructing definitions. These are arbitrarily labelled as A, B, and C by Bruce W. Tuckman. A type A definition can be constructed in terms of the operations that must be performed to cause the phenomenon or state being defined to occur. An intelligent child can be defined operationally as the child produced by the marriage of above average, intelligent couples.
  • 44.
    5. Definition ofTerms A type B definition can be constructed in terms of how the particular object or thing defined operates, that is what it does or what constitute its dynamic properties. Thus an intelligent student can be operationally defined as a person who gets high grades in school or a person who demonstrates capability for solving complicated mathematical problems.
  • 45.
    5. Definition ofTerms A type C definition can be constructed in terms of what the object or phenomenon being defined looks like that is what constitutes its static properties. Thus, an intelligent student can be defined for instance as a person who has a good memory, large vocabulary, good reasoning ability, good mathematical skills, etc.
  • 46.
    5. Definition ofTerms Ideally, the operational definition should contain three parts. The first part is its universal meaning. The second part is how it is being used in the study. The third is how it is being measured.
  • 47.
    6. Importance ofthe Study It is at this point that the researcher described who will benefit and what benefits can be derived from the findings of the study. The writer, under this section, tries to sell its importance to the panel or to the funding agency.
  • 48.
    7. Scope andlimitations of the Study This tells the specific boundaries of the study by describing the place or venue of the study, the population, subjects/respondents, time frame, the variables and their indicators. Any weakness of the study such as failure to use a more precise data gathering or measuring instrument or failure to execute an important procedure due to certain circumstances beyond the researcher’s control form part of the study’s limitations.
  • 49.
    Learner’s Output: List ofRelated Literature
  • 50.
    LITERATURE REVIEW A literaturereview is a re- view of something that has already been written
  • 51.
    STEP 1a: LiteratureReview: The Research Powerhouse • Generativity is one of the hallmarks of scholarship (Shulman, 1999). It is the ability to build on the scholarship and research of those who have come before us. A literature review is an account of what has been published on a topic by accredited scholars and researchers 51
  • 52.
     A literaturereview can be a precursor in the introduction of a research paper  A literature review is a critical and in depth evaluation of previous research. It is a summary and synopsis of a particular area of research, allowing anybody reading the paper to establish why you are pursuing this particular research project. Why do a literature review?
  • 53.
    Tips for Searchingfor Resources on the Internet  Finding related research articles typically requires competence on the internet.  Search through databases that have indexed information on thousands of research articles that have been conducted
  • 54.
    Tips for Searchingfor Resources on the Internet  List the major or key variables/concepts in the study  List synonyms for each variable  Outline the major points to be made in the literature review  Do not limit your search to only studies that examine all of the same variables as your study.  Put key phrases in quotation marks  When searching online, use the limit function to reduce searches that have too many results.  Limit your use of Google  Do not cite wikipedia as a source. Like Google, anybody can edit articles on wikipedia. Therefore, wikipedia should never be used as a source for an academic paper.  Use the resources you have to find additional resources.
  • 55.
    Tips for Searchingfor Resources on the Internet Boolean logic is the way to put terms together in a search by using AND, OR, NOT
  • 56.
    Using AND  Whenyou use AND you will be looking for articles containing two or more words within each article. For example, employee AND motivation would retrieve articles with both words in the article. Use AND when you are searching for concepts and want to be more specific in your search (to narrow it down).
  • 57.
    Using OR When youuse OR you will be looking for articles containing either one word or the other word. For Example, employee OR personnel OR staff. You would use OR for similar concepts and alternative words or synonyms (to broaden out your search).
  • 58.
    Using NOT When youuse NOT you will be looking for one term but not the other. For example, you might search for broadband NOT wireless. You would use NOT to exclude irrelevant results (to narrow down your search).
  • 59.
    Table 1 Writingstyles – opening sentence Good opening style Opening style to avoid Early work by Thomas (1996) shows that … Another study on the topic by Brown (2000) asserts that … The latest research (Smith, 2003) show … Thomas (1996) said … Brown said (2000) … Smith (2003) wrote ….
  • 60.
    Table 2 Verbsand synonyms, to use in writing about text and making an argument Account for Clarify Describe Exemplify Investigate Recognize Analyze Argues Assess Assert Assume Claim Compare & contrast Conclude Criticize Debate Defend Define Demonstrat e Determine Discuss Distinguish Differentiate Evaluate Emphasize Examine Expand Explain Exhibit Identify Illustrate Imply Indicate Judge Justify Narrate Outline Persuade Propose Question Reflect Refer to Relate to Report Review Suggest Summarize
  • 61.
    Table 3. Formingcritical sentences using signaling words As a consequence of x then y Consequently, … Hence … Therefore, … Thus … In short … In effect …/ It follows that … This indicates that … This suggests that … This points to the conclusion that … This most obvious explanation is … This means that … Finally, … Source: Brown and Keeley (2004)
  • 62.
  • 63.
    Rule 1: Statethe theory Suggested Sentence Stems The theoretical basis of this paper is This paper is theoretically anchored on This paper is premised on The theory of ______ underpins this study We draw on ___________ to (state the objective of the paper) Rule 2: Explain the theory Rule 3: Contextualize the theory Writing the Theoretical Background (The SEC Approach) LITERATURE REVIEW
  • 64.
    Rule 1: SynopticDimension  Defining what the construct is all about  Stating what has been said about the variable (relationship, effect, difference) or it historical development Rule 2: Argumentative Dimension  Build arguments either through sentence of problematising (SOP) or the need for the study (NFS)
  • 65.
    Variable: Teaching Beliefs Literature1 Literature 2 Literature 3 Literature 4 Literature 5 Literature 6 Literature 7 Claim 1 Claim 2 Claim 3 Evidence Evidence Evidence How do the findings relate? How do the findings differ? From these similarities and differences, what can we possibly claim? Cite specific studies from your literature review that will support the claims made in frame 2 Indicate the findings of each of the literature reviewed
  • 66.
    The Need for Dendrogramming Literature1 Finding 1 Finding 2 Finding 3 Literature 2 Finding 1 Finding 2 Finding 3 Finding 4 Literature 3 Finding 1 Finding 2 Finding 3 Literature 4 Finding 1 Finding 2 Finding 3 Literature 5 Finding 1 Finding 2 Finding 3 Finding 4 Finding 5
  • 67.
    Example write-up (CF) Theconceptual framework underlying this study is anchored on the concepts of research capability, workload, and research productivity. Research Capability Research capability is simply the capability of the faculty to undertake research. All the resources or inputs which enable the faculty member to conduct research are considered as components of research capability (Deza, 1999; Banaag, 1994). Salazar- Clemena and Almonte-Acosta (2007) enumerated indicators of research capability which include budget for research, the ability to obtain research grants, the provision of research infrastructure, the ability to collaborate with and access to research professionals, and the presence of rules and procedure on the granting of rewards for research.
  • 68.
     In thisstudy, research capability is described in terms of technical skills in doing research, skills in conceptualizing a research problem, knowledge and skills in designing the research plan, knowledge and skills on research data processing, and knowledge and skills in writing the research paper. Technical skills include written communication (expressing one’s ideas and arguments using language rules, presenting and packaging ideas effectively); oral communication (expressing one’s ideas and arguments using language rules, presenting and packaging ideas effectively); critical /analytical thinking (evaluating ideas, analyzing the arguments of others); problem- solving; research organization (parts, format of a research paper); online search , use of electronic resources, databases & search engines; use of computer commands/programs/ software; and acknowledging or citing sources/ cross-referencing. Example write-up (CF)
  • 69.
    Determinants of ResearchProductivity  Previous foreign and local studies have revealed that the reasons for low research productivity among faculty members are poor or lack of research skills (Anunobi & Emerole, 2008; Iqbal, 2011); lack of research funds (Anunobi & Emerole, 2008; Iqbal, 2011; Mahilum, 2010); and heavy workload or teaching overload (Iqbal, 2011; Mahilum, 2010; Mordeno, 2002). Iqbal (2011) added performance of administrative duties along with academic duties, nonexistence of research leave, negative attitude of the faculty towards research and absence of professional journals while Anunobi & Emerole (2008) included time constraints as impediments to research publication. Example write-up (CF)
  • 70.
    Determinants of ResearchProductivity  Predictors of research productivity include teachers training or having research orientation (Finkelstein, 1984, Banaag, 1994, Mordeno, 2002); academic rank (Flanigan, et al.,1988; Banaag, 1994); highest educational attainment (Finkelstein, 1984; Flanigan, et al.,1988; Banaag, 1994);and sufficient time allocated to research (Finkelstein, 1984). Example write-up (CF)
  • 71.
    While several studieshave been made to investigate correlates of research productivity, studies on research capability in terms of specific research skills of teachers were lacking. In this end, the researchers were motivated to conduct this research that explored the levels of proficiency of teachers on different skills that determine their capability in doing research and how this capability can be associated to research productivity. Workload in terms of hours of work and number of teaching preparations was also investigated to verify its impact on faculty productivity in research. In the end, it is aimed that this research may contribute to the existing literatures on determinants of research productivity. Example write-up (CF)
  • 72.
    Remember!  Read enoughbackground material to discuss the research and the theory giving a reasonably complete account of our knowledge of the topic  Present data that are based on data and theory, including conflicting views of different researchers.  Make it easy for the reader to understand how all of the studies interrelate.
  • 73.
    Writing the Introduction (TheTIOC Approach) Pointers: The TIOC Approach • Highlight then trend/s in the field • Pinpoint the issues underlying the trend/s • State the overall objective/intent of the paper in the light of the gap identified • Discuss the possible contribution of the research attempt to advancing/improving disciplinal theory, research, practice and policy • (cross-reference to strengthen claims Source: De Guzamn (2012). Writing for Intl Publication
  • 74.
    Some Approaches toStarting the Introduction  Make a compelling statement about an important issue There is a strong evidence that computer games are hugely popular. For example, as of 2002, more money was spent on computer games in the United States- 6.9billion dollars- than on box-office movies, and approximately 145 million Americans (or about 60% of the population over age 6) regularly played computer games (Lee, Park, & Jin, 2006). Advocates of educational gaming have proposed that educators should harness the appeal of computer games as a vehicle for fostering student learning, but reviews of the research literature have not yielded strong support for the instructional effectiveness of computer games (Adams, Mayer, McNamara, Koenig, & Wainess, 2011).
  • 75.
    Some Approaches toStarting the Introduction  Identifying the Scope of Previous Research The literature on suicide and suicide risk factors is extensive. The research includes clinical reports, intervention strategies, identification of individual risk factors, demographic patterns of suicide, and estimates of base rates in different ages and culture. A subset of this literature has examined suicide in college students. College students suicide research is longstanding and an increasing number of articles address the topic each year (Stephenson, Belesis, & Balliet, 2005)
  • 76.
    Some Approaches toStarting the Introduction  Presenting a Statistics Health outcomes are increasingly recognized as socially patterned, In 2001- 2002, the leading causes of death were heart disease, cancer and stroke (Jackson, Kubzansky, & Wright, 2006).
  • 77.
    Some Approaches toStarting the Introduction  Describing common occurrences For traditionally male jobs,.. Women are less likely to be hired than men. They are also paid less, given less authority, and promoted less often. ..Conversely, male applicants are discriminated against for jobs that are considered feminine (Ulhmann & Cohen, 2005),
  • 78.
    Plagiarism “Authors do notpresent the work of another as if it were their own work”. Whether paraphrasing, quoting an author directly, or describing an idea that influenced your work, you must credit the source. To avoid charges of plagiarism, take careful notes as you research to keep track of your sources and cite those sources according to the guidelines.
  • 79.
    Table 6.1. BasicCitation Styles Type of citation First citation in text Subsequent citations in text Parenthetical format, first citation in text Parenthetical format, subsequent citations in text One work by one author Walker (2007) Walker (2007) (Walker, 2007) (Walker, 2007) One work by two authors Walker and Allen (2004) Walker and Allen (2004) (Walker & Allen, 2004) (Walker & Allen, 2004) One work by three authors Bradley, Ramirez, and Soo (1999) Bradley et al. (1999) (Bradley, Ramirez & Soo, 1999) (Bradley et al., 1999) One work by four authors Bradley, Ramirez, Soo and Walsh (2006) Bradley et al. (2006) (Bradley, Ramirez, Soo & Walsh, 2006) (Bradley et al., 2006)
  • 80.
    Type of citationFirst citation in text Subsequent citations in text Parenthetical format, first citation in text Parenthetical format, subsequent citations in text One work by five authors Walker, Allen, Bradley, Ramirez, and Soo (2008) Walker et al. (2008) (Walker, Allen, Bradley, Ramirez, & Soo, 2008) (Walker et al., 2008) One work by six or more authors Wasserstein et al. (2005) Wasserstein et al. (2005) (Wasserstein et al., 2005) (Wasserstein et al., 2005) Groups (readily identified through abbreviation) as authors National Institute of Mental Health (NIMH, 2003) NIMH (2003) (National Institute of Mental Health [NIMH], 2003) (NIMH, 2003) Groups (no abbreviaton) as authors University of Pittsburgh (2005) University of Pittsburgh (2005) (University of Pittsburgh, 2005) (University of Pittsburgh, 2005)
  • 81.
    References  Beins, B.C.APA simplified style: Writing in psychology, nursing, education, and sociology. USA: John Wiley & Sons, Inc.  De Guzman, A.B. Writing for international publication. Presented in a seminar- workshop 2012  explorable.com/what-is-a-literature- review  Korb, K. (2015). Conducting educational research: Search the Research Literature
  • 82.
    Understanding Ways toCollect Data 1. Research Design A research design is a plan or strategy in order to answer the research problem and control (variance) for validity. This is the over-all plan for the conduct of the investigation. Hence, substantially a design is intended to answer the problem; and, technically it provides control for validity.
  • 83.
    Understanding Ways toCollect Data 1. Research Design Essentially, research designs may be classified only in two (2) categories on the basis of maximum control for validity: 1. non-design or non-experimental (descriptive) 2. True Design or experimental design
  • 84.
    Understanding Ways toCollect Data 1. Research Design EXPERIMENTAL RESEARCH A. Pre-experimental design (non-design) Not recommended for use -designs which do not control adequate against sources of internal validity 1. One shot case study 2. One-group pre-test-post-test design B. Quasi-experimental design C. True Experimental Design
  • 85.
    Understanding Ways toCollect Data 1. Research Design EXPERIMENTAL RESEARCH A. Pre-experimental design (non-design) B. Quasi-experimental design -this design controls some but not all sources of internal invalidity due to existing conditions by which experimental control is difficult if not impossible. C. True Experimental Design
  • 86.
    Understanding Ways toCollect Data 1. Research Design EXPERIMENTAL RESEARCH A. Pre-experimental design (non-design) B. Quasi-experimental design 1. Expost facto design – This is the study in which the researcher examine the effects of naturalistically occurring treatment after that treatment has occurred rather than creating the treatment itself. The researcher attempts to rotate this after the fact. 2. Co-relational standard C. True Experimental Design
  • 87.
    Understanding Ways toCollect Data 1. Research Design EXPERIMENTAL RESEARCH A. Pre-experimental design (non-design) B. Quasi-experimental design 1. Expost facto design 2. Co-relational standard – this involves two or more sets of data from a group of subjects with an attempt to determine the subsequent relation between those sets of data. C. True Experimental Design
  • 88.
    Understanding Ways toCollect Data 1. Research Design EXPERIMENTAL RESEARCH A. Pre-experimental design (non-design) B. Quasi-experimental design 1. Expost facto design 2. Co-relational standard – serve as useful purpose in determining the relationship among measures and suggesting possible bases for causality, while correlation does not necessarily imply causation. C. True Experimental Design
  • 89.
    Understanding Ways toCollect Data 1. Research Design EXPERIMENTAL RESEARCH A. Pre-experimental design (non-design) B. Quasi-experimental design C. True Experimental Design – provide complete adequate controls for all sources of internal invalidity (only possible for non-human subjects 1. Post-only control group design 2. Pretest-post test control group design
  • 90.
    Experimental Research  Mostpowerful design  Used to establish cause and effect by manipulating (influencing) an IV (independent variable, aka treatment or experimental variable) to see its effect on a DV (dependent variable ,aka criterion or outcome variable)  Goes beyond description and prediction
  • 91.
    Experimental Research  Comparisonof groups (at least two groups of subjects, called treatment and control groups)  Manipulation of the IV (experimenter changes something for the treatment group that’s different than the control group)  Randomization (true experiments require random assignment into treatment/control conditions…after random selection of subjects to participate in study)  Assignment takes place at start of experiment
  • 92.
    Experimental Research  Donot use already formed groups  Groups should be equivalent (any differences due to chance)  Randomization eliminates threats from extraneous variables  Groups must be sufficiently large to be equivalent
  • 93.
    Experimental Research  Allextraneous variables must be controlled to eliminate threats to validity/rival hypotheses  Ensure groups are equivalent to begin using randomization  Hold certain variables constant (i.e. age, IQ) or build them into to the design
  • 94.
    Experimental Research  Usematching when necessary  Use subjects as their own controls (treat same group first in control condition then in treatment OR use pre-test/posttest on same group)  Use analysis of covariance to statistically equate unequivalent groups
  • 95.
    Experimental Research (Group Designs) Weak Designs(Pre experimental Designs)  True Experimental Designs  Quasi Experimental Designs
  • 96.
    Pre-Experimental Designs  Donot adequately control for the problems associated with loss of external or internal validity  Cannot be classified as true experiments  Often used in exploratory research  Three Examples of Pre-Experimental Designs ◦ One-Shot Design ◦ One-Group Pretest-Posttest Design ◦ Static Group Design
  • 97.
    One-Shot Design  A.K.A.– after-only design  A single measure is recorded after the treatment is administered  Study lacks any comparison or control of extraneous influences  No measure of test units not exposed to the experimental treatment  May be the only viable choice in taste tests  Diagrammed as: X O1
  • 98.
    One-Group Pretest-Posttest Design  Subjectsin the experimental group are measured before and after the treatment is administered.  No control group  Offers comparison of the same individuals before and after the treatment (e.g., training)  If time between 1st & 2nd measurements is extended, may suffer maturation  Can also suffer from history, mortality, and testing effects  Diagrammed as O1 X O2
  • 99.
    Static Group Design A.K.A., after-only design with control group  Experimental group is measured after being exposed to the experimental treatment  Control group is measured without having been exposed to the experimental treatment  No pre-measure is taken  Major weakness is lack of assurance that the groups were equal on variables of interest prior to the treatment  Diagrammed as: Experimental Group X O1 Control Group O2
  • 100.
    Pretest-Posttest Control Group Design A.K.A., Before-After with Control  True experimental design  Experimental group tested before and after treatment exposure  Control group tested at same two times without exposure to experimental treatment  Includes random assignment to groups  Effect of all extraneous variables assumed to be the same on both groups  Do run the risk of a testing effect
  • 101.
    Pretest-Posttest Control Group Design Diagrammed as ◦ Experimental Group: O1 X O2 ◦ Control Group: O3 O4  Effect of the experimental treatment equals (O2 – O1) -- (O4 – O3) R R
  • 102.
    Posttest-Only Control Group Design A.K.A., After-Only with Control  True experimental design  Experimental group tested after treatment exposure  Control group tested at same time without exposure to experimental treatment  Includes random assignment to groups  Effect of all extraneous variables assumed to be the same on both groups  Do not run the risk of a testing effect  Use in situations when cannot pretest
  • 103.
    Posttest-Only Control Group Design Diagrammed as ◦ Experimental Group: X O1 ◦ Control Group: O2  Effect of the experimental treatment equals (O2 – O1)  Example ◦ Assume you manufacture an athlete’s foot remedy ◦ Want to demonstrate your product is better than the competition ◦ Can’t really pretest the effectiveness of the remedy R R
  • 104.
    Solomon Four-Group Design True experimental design  Combines pretest-posttest with control group design and the posttest-only with control group design  Provides means for controlling the interactive testing effect and other sources of extraneous variation  Does include random assignment
  • 105.
    Solomon Four-Group Design Diagrammed as ◦ Experimental Group 1: O1 X O2 ◦ Control Group 1: O3 O4 ◦ Experimental Group 2: X O5 ◦ Control Group 2: O6  Effect of independent variable (O2 – O4) & (O5 – O6)  Effect of pretesting (O4 – O6)  Effect of pretesting & measuring (O2 – O5)  Effect of random assignment (O1 – O3) R R R R
  • 106.
    Quasi-Experimental Designs  Morerealistic than true experiments  Researchers lacks full control over the scheduling of experimental treatments or  They are unable to randomize  Includes ◦ Time Series Design ◦ Multiple Time Series Design  Same as Time Series Design except that a control group is added
  • 107.
    Time Series Design Involves periodic measurements on the dependent variable for a group of test units  After multiple measurements, experimental treatment is administered (or occurs naturally)  After the treatment, periodic measurements are continued in order to determine the treatment effect  Diagrammed as: O1 O2 O3 O4 X O5 O6 O7 O8
  • 108.
    Experimenter Bias Effect The intentional or unintentional influence that an experimenter (researcher) may exert on a study
  • 109.
    Correlation Research (Predicting OutcomesThrough Association)  Correlational research involves study of existing relationships between two variables  Descriptive in nature  Often a precursor to experimental research  Positive correlation is Hi/Hi and Lo/Lo (coeff. +r)  Negative correlation is Hi/Lo and Lo/Hi (-r)  Purpose is to explain relationships or to predict outcomes
  • 110.
    Correlation Research (Predicting Outcomes ThroughAssociation)  Explanatory studies examine relationship to identify possible cause/effect  Relationship might or MIGHT NOT mean causation  For causation: 1) A before B; 2) A and B related; 3) Rule out other causes of B (need experiment)  Prediction studies identify predictors of criterions (i.e. HS GPA and College GPA)  The stronger the correlation the better the prediction
  • 111.
    Correlation Research (Predicting OutcomesThrough Association)  Complex Correlation Techniques, such as multiple regression allow use of several predictors for one criterion  Coefficient of multiple correlation (R) gives strength of correlation between predictors and criterion  Coefficient of determination (r2) is amount x and y vary together  Descriminant function analysis is for non-quantitative criterion (predict which group someone will be in)  Other techniques also used (factor analysis, path analysis, structural modeling)
  • 112.
    Correlation Research (Predicting OutcomesThrough Association)  Problem selection – usually it’s are x and y related or how well does p predict c  Sample – random selection of at least 30  Measurement – need quantitative data  Design/Procedures – need two measures on each subject  Data collection – usually both measures close in time  Data analysis – correlation coefficient, r, and plot (r is -1 to +1, and the closer to plus or minus 1, the stronger the relationship)
  • 113.
    Correlation Research  Generalguidelines: +.75 to +1.0 Very strong relationship +.50 to +.75 Moderate strong relationship +.25 to +.50 Weak relationship +.00 to +.25 Low to no relationship  Need .5 or better for prediction of any use, and .65 for accurate predictions  Reliability coefficients should be .7 up  Validity coefficients should be .5 up
  • 114.
    Correlation Research  Remembercorrelation is not causation (lurking variables)  Subject characteristics – may get different correl w/ different ability levels, gender, etc. (can control with partial correlation)  Location – testing conditions can impact results  Instrumentation problems – helps to standardize instrument and data collection for both groups
  • 115.
    Correlation Research  Whatfactors could affect the variables being studied?  Does any factor affect BOTH variables? (this is where threats occur)  Figure a way to control any lurking variables
  • 116.
    Causal Comparative Research (ExPost Facto)  Determines cause (or effect) that has occurred and looks for effect (or cause) from it  Start w/ differences in groups and examine them  Examples: Difference in math abilities of male/female students  No random assignment to treatment (it already occurred)  Associational like correlation but primarily interested in cause/effect  IV either cannot (ethnicity) or should not (smoking) be manipulated
  • 117.
    Causal Comparative versus CorrelationalResearch  Often an alternative to experimental (faster and cheaper)  Serious limitation is lack of control over threats to internal validity  Need to remember the cause may be the effect; they may only be related and there is some other variable that is the cause (lurker)
  • 118.
    Causal Comparative versus CorrelationalResearch  Both are associational (looking for relationship)  Both are often prelude to experiments  Neither involves manipulation of variables  Causal Comparative works with different groups; correlation examines one group on different variables  Correlation is measured w/ coefficient while Causal comparative compares means/medians/percents of group members
  • 119.
    Causal Comparative Research versusExperimental Research  Both compare group scores of some type  In experimental the IV is manipulated, but not in CC (already took place)  CC does not provide as strong evidence as experimental for cause and effect
  • 120.
    Causal Comparative Research (Steps) Problem formation – identify phenomena and look for causes or consequences of it  Sometimes several alternate hypotheses investigated  Sample – define (operationally) characteristics of study carefully, then select individuals who possess  Groups should be homogeneous in regard to several important variables (to control for them as causes) then match control/experimental groups on one or more variables  Instruments – use any type to compare the groups  Design – basic CC involves 2 or more groups that differ on variable of interest (basic design is one group possesses trait (athlete) other doesn’t compare DV (GPA)
  • 121.
    Causal Comparative Research (Threatsto Internal Validity)  Subject characteristics – since don’t select subjects and form groups, there may be unidentified lurking variables  Can use matching to control for any identified differences, but limits samples size  Can find or create homogeneous groups (for example compare only high GPA students to other high GPA students) on attitudes toward x  Statistical matching – adjusts posttest scores based on some initial difference  Other threats – location, instrument, history, maturation, loss of subjects can be concerns  Need to control as many as possible to eliminate alternate hypotheses
  • 122.
    Survey Research (Used todescribe what people think/do/believe) Types  Cross sectional provide a snapshot in time  Longitudinal collect data at different points in time to study changes over time  Trend study - random sample each year on same topic  Cohort study - sample from same cohort members year after year  Panel study - same individuals surveyed year after year (mortality a problem over long time periods)  Often surveys are the data collection instrument in correlation (or cc/exp’l) studies
  • 123.
    Steps to conductSurvey Research  Define the problem Needs to be important enough respondents will invest their time to complete it Must be based on clear objectives  Identify the target population Defined by sample unit or unit of analysis Unit can be a person, school, classroom, district, etc.) Survey a sample or do a census of the population
  • 124.
    Survey Research (Steps toconduct survey research) Methods of data collection Direct administration to a group (such as at a meeting) - good response rate, limited generalize. Mail survey (inexpensive way to get large amount of data from widespread pop) - lower response rates, not in-depth info, illiterate missed Telephone survey (cheap/fast) - response rates higher due to encouragement (“I’m not selling…”); miss some pop members, interviewer bias possible Personal interviews (face-to-face has good response rate but time and cost high) - lack anonymity, interviewer bias
  • 125.
    Survey Research (Steps toconduct survey research)  Select the sample (randomly, but check to see respondents are qualified to answer) Pilot test can indicate likely response rate and problems with data collection or sample  Prepare instrument (questionnaire and interview schedule)  Appearance important - look short and easy  Clarity in questions is essential
  • 126.
    Survey Research (Steps toconduct survey research)  Question types (same questions need to be asked of all respondents)  Closed ended (multiple choice) - easier to complete, score, analyze  Categories must be all inclusive, mutually exclusive  Open ended - easy to write, hard to analyze and hard on respondents
  • 127.
    Population This describes thepopulation of the study and the method of getting the representative sample (of the population). The total population of interest and the number of the sample subjects of the study are given and embodied in a table.
  • 128.
     Sample –any group on which info is obtained  Population – group that researcher is trying to represent  Population must be defined first; more closely defined, easier to do, but less generalizable  Study a subset of the population because it is cheaper, faster, easier, and if done right, get same results as a census (study of whole population)  Accessible population – the group you are able to realistically generalize to…may differ from target population Sample and Population
  • 129.
  • 130.
     Random –every population element has an equal and independent chance to participate Uses names in a hat or table or random numbers Elimination of bias in selecting the sample is most important (meaning the researcher does not influence who gets selected) Ensuring sufficient sample size is second most important Random v. Nonrandom Sampling
  • 131.
     Nonrandom/purposive -troubles with representativeness/generalizing Random v. Nonrandom Sampling
  • 132.
    Names in ahat or table of random numbers Larger samples more likely to represent population. Any difference between population and sample is random and small (called random sampling error) Simple Random Sampling
  • 133.
     Ensures smallsubgroups (strata) are represented  Normally proportional to their part of population  Break population into strata, then randomly select w/in strata  Multistage sampling Stratified random sampling
  • 134.
     Select groupsas sample units rather than individuals  REQUIRES a large number of groups/clusters  Multistage sampling Cluster Random Sampling
  • 135.
     Considered randomis list if randomly ordered or nonrandom if systematic w/ random starting point  Divide population size by sample size to get N (ps/ss=N)  Systematic can be nonrandom if list is ordered Systematic (Nth) Sampling
  • 136.
     Using groupthat is handy/available (or volunteers)  Avoid, if possible, since tend not to be representative due to homogeneity of groups  Report large number of demographic factors to see likeliness of representativeness Convenience Sampling
  • 137.
     Using personaljudgment to select sample that should be representative (i.e., this faculty seems to represent all teachers) OR selecting those who are known to have needed info (interested in talking only to those in power)  Snowball is a type (used with hard to identify groups such as addicts) Purposive Sampling
  • 138.
    Sample size affectsaccuracy of representation  Larger sample means less chance of error  Minimum is 30; upper limit is 1,000 (see table) Sampling
  • 139.
    Representative sample isrequired (not the same thing as variety in a sample)  High participation rate is needed  Multiple replications enhance generalization when nonrandom sampling is used  Ecological generalization (generalizable to other settings/conditions, such as using a method tested in math for English class) Sampling
  • 140.
  • 141.
    Data Collection Procedure Thisrepresents the logical procedure in collecting and treating data to answer the research question and the hypothesis: The usual order of presentation of this section is chronological, for instance: 1) Requesting permission from the concerned authorities to conduct the investigation and to administer the research instruments to the subjects, including its approval thereof attached as an appendix;
  • 142.
    Data Collection Procedure 2)Orientation and actual administration or mailing of the research instrument; 3) Follow-ups of those who failed to return the instrument before the deadline set; 4) Gathering of the duly accomplished research instrument. This section tells the reader what you did and how you did it. Any errors or weaknesses in the procedures that have been discovered during the conduct of the research should be pointed out, and any consequent limitations upon the research should be fully noted.
  • 143.
    Instrumentation (Measurement) • Data –information researchers obtain about subjects ◦ Demographic data are characteristics of subjects such as age, gender, education level, etc. ◦ Assessment data are scores on tests, observations, etc. (the device used to measure these is called the measurement instrument)
  • 144.
    Instrumentation • Validity –measures what it is supposed to (accurate) • Reliability – a measure that consistently gives same readings (repeatable)
  • 145.
    Instrumentation • Objectivity –absence of subjective judgments (need to eliminate subjectivity in measuring) • Usability of instruments ◦ Consider ease of administration; time to administer; clarity of directions; ease of scoring; cost; reliability/validity data availability
  • 146.
    Instrumentation (Classifying Data Collection Instruments) •By the group providing the data ◦ Researcher instruments (researchers observes student performance and records) ◦ Subject instruments (subjects record data about themselves, such as taking test) ◦ Others/Informants (3rd party reports about subjects such as teacher rates students)
  • 147.
    • By whereinstrument came from ◦ Preference is for existing ◦ Can develop your own (requires time, effort, skill, testing; • By response type ◦ Written response – preferred – objective tests, rating checklist ◦ Performance instruments – measure procedure, product Instrumentation (Classifying Data Collection Instruments)
  • 148.
    Instrumentation(Examples of Data CollectionInstruments) • Researcher Completed Instruments ◦ Rating scales (mark a place on a continuum for example numeric rating 1=poor to 5= excellent) ◦ Interview schedules (complete scales as interview takes place; use precoding; beware of dishonesty)
  • 149.
    Instrumentation(Examples of Data CollectionInstruments) • Researcher Completed Instruments ◦ Tally sheets (for counting/recording frequency of behavior, remarks, activities, etc.) ◦ Flow charts (to record interactions in a room) ◦ Anecdotal records (need to be specific and factual) ◦ Time/Motion logs (record what took place and when)
  • 150.
    Instrumentation • Item Formats ◦Selection items or closed response (T/F; Yes/No; Right/Wrong; Multiple choice) ◦ Supply items or open ended (short answer; essay) ◦ Unobtrusive measures (no intrusion into event… usually direct observation and recording)
  • 151.
    Instrumentation • Types ofScores ◦ Raw scores (initial score or count obtained…w/out context) ◦ Derived scores (raw scores translated to meaningful usage with standardized process)  Age/Grade equivalence; Percentile ranks; Standard scores (how far a score is from a given reference point, i.e. z and T scores);  Which to use depends on the purpose; usually standard scores used
  • 152.
    Instrumentation • Norm Referencedv. Criterion Referenced Tests • Norm referenced scores give a score relative to a reference group (the norm group) ◦ Criterion referenced scores determine if a criterion has been mastered ◦ These are used to improve instruction since they indicate what students can or cannot do or do or do not know
  • 153.
    Instrumentation (Measurement Scales) • Nominal(in name only) ◦ Numbers are only name tags, they have no mathematical value (gender: 1=male and 2= female OR race: 1= Blk, 2=Wht, 3=other) • Ordinal (in name, plus relative order) ◦ Numbers show relative position, but not quantity (grade level, finishing place in a race)
  • 154.
    Instrumentation (Measurement Scales) • Interval(in name w/ order AND equal distance) ◦ Numbers show quantity in equal intervals, but an arbitrary zero (can have negative numbers; degrees C or F) • Ratio (in name, w/ order, eq. distance AND absolute zero) ◦ Numbers show quantity with base of zero where zero means the construct is absent • Higher levels more precise…collect data at highest level possible; some statistics only work with higher level data
  • 155.
    Instrumentation (Preparing for DataAnalysis) • Scoring data – use exact same format for each test and describe scoring method in text • Tabulating and Coding – carefully transfer data from source documents to computer ◦ Give each test an ID number ◦ Any words must be coded with numerical values ◦ Report codes in text of research report
  • 156.
    Measurement Instruments  Typesof instruments ◦ Cognitive – measuring intellectual processes such as thinking, memorizing, problem solving, analyzing, or reasoning ◦ Achievement – measuring what students already know ◦ Aptitude – measuring general mental ability, usually for predicting future performance
  • 157.
    Measurement Instruments  Typesof instruments (continued) ◦ Affective – assessing individuals’ feelings, values, attitudes, beliefs, etc.  Typical affective characteristics of interest ◦ Values – deeply held beliefs about ideas, persons, or objects ◦ Attitudes – dispositions that are favorable or unfavorable toward things ◦ Interests – inclinations to seek out or participate in particular activities, objects, ideas, etc. ◦ Personality – characteristics that represent a person’s typical behaviors
  • 158.
    Measurement Instruments  Typesof instruments (continued) ◦ Affective (continued)  Scales used for responding to items on affective tests ◦ Likert  Positive or negative statements to which subjects respond on scales such as strongly disagree, disagree, neutral, agree, or strongly agree ◦ Semantic differential  Bipolar adjectives (i.e., two opposite adjectives) with a scale between each adjective  Dislike: ___ ___ ___ ___ ___ :Like ◦ Rating scales – rankings based on how a subject would rate the trait of interest Obj. 5.1
  • 159.
    Measurement Instruments  Typesof instruments (continued) ◦ Affective (continued)  Scales used for responding to items on affective tests (continued) ◦ Thurstone – statements related to the trait of interest to which subjects agree or disagree ◦ Guttman – statements representing a uni-dimensional trait Obj. 5.1
  • 160.
    Measurement Instruments  Issuesfor cognitive, aptitude, or affective tests ◦ Problems inherent in the use of self-report measures  Bias – distortions of a respondent’s performance or responses based on ethnicity, race, gender, language, etc.  Responses to affective test items ◦ Socially acceptable responses ◦ Accuracy of responses ◦ Response sets ◦ Alternatives include the use of projective tests
  • 161.
    Finding the Answersto the Research Question 1. Interpretation of Data
  • 162.
  • 163.
    Descriptive Statistics  Fordescriptive problems that require finding out “what is,” as the term implies, descriptive statistical analysis can be used to describe the data. The mean, median, mode and standard deviation are the main descriptive statistical treatment applicable. The mean or median is used to indicate the average while the standard deviation provides the variability of the data/scores in the sample.
  • 164.
    Sample of ComputerOutput N Min Max Mean SD TEST THIRDQ FOURTHQ Valid N (listwise) 56 56 56 56 1.0 2.0 5.0 2.0 46.0 7.0 1.5 21.8 24.3 0.5 17.6 7.4
  • 165.
    Sample Frequencies Frequency PercentPercent Cum. Valid Percent Female Male Total 216 258 474 45.6 54.4 100.0 45.6 54.4 100.0 45.6 100.0
  • 166.
    Illustration: Characteristic Profile A. Gender F% Male Female Total 216 258 474 45.6 54.4 100.0
  • 167.
    Sample Interpretation  asto gender, the respondents were mostly female (since the modal class is female).
  • 168.
    Illustration 2. Age F % 30-32 5 6.25  27-29 43 53.75  24-26 29 36.25  21-23 3 3.75  Total 80 100
  • 169.
    Interpretation ◦ Results onthe table show that most of the respondents were within the age range of 27-39 (43 or 53.75%). However it could be seen that the combined ranges from 24-26 to 27-39 composed almost 90% of the respondents. ◦ From this, it could be said that most of the respondents were young adults.
  • 170.
    Descriptive Statistics Usedin Evaluation Studies
  • 171.
  • 172.
    EVALUATION OF THECONTEXTUAL TEACHING MATERIALS BY EXPERTS Contents Mean Verbal Des.  Concept definition 4.6 Excellent  Presentation of concepts 4.6 Excellent  Sufficiency of Problem scenarios and examples 5.0 Excellent  Sufficiency of questions to ignite the critical thinking 4.8 Excellent  Writing of the topics within to the level of the student’s understanding 4.8 Excellent
  • 173.
    Interpret results onthe context of the study  The concepts in the CTL were presented in real situations that are familiar to the students (X=4.6). This is the basic principle strictly adhered to in a contextual teaching approach, thus, if the materials fail in this aspect, there is no contextual approach. Since the experts judged the criterion as excellent, it only means that the CTL materials were successful in translating the concepts to true-to-life experiences.
  • 174.
  • 175.
  • 176.
     Bivariate Analysis IntervalData Pearson’s r Ranked Data Spearman rho Kendall Tau Nominal data Chi square
  • 177.
  • 178.
     2 GroupsT-test of Difference between means of Independent Data  2 sets of scores of 1 group (ie Comparison of Pre & Posttest) T-test of Difference Between Means of Correlated Data Comparison of 3 or more Groups – Analysis of Variance.
  • 179.
    Sample of aCorrelation Matrix # of Childrn Age Incom Yrs inSch Educ # of Childrn r 1.0 .404 -.018 -.237 -.172 2-t sig . .000 .489 .000 .000 Age r .4041 1 -.047 -.250 .149 2-t sig .000 .070 . .000 .000 Incom r -.018 .047 1 .361 .360 2-t sig .489 .070 . 000 . .000 Yrs inSch r -.237 -.259 .361 1 .864 2-t sig .000 .000 .000 . .000
  • 180.
    Interpreting correlation coefficient  Positivecorrelation: X Y X Y  Negative correlation: X Y X Y
  • 181.
    Illustration  Subjects beingPearson’s r Significance Related Mathvs.MathNEAT 0.77095 significant Sci vs.Sci(NEAT) 0.79908 significant Eng vs.Eng(NEAT) 0.69801 significant HEKASI vs HEKASI 0.23142 not sig.
  • 182.
     It isnecessary to explore the statistical significance by using the critical value, however, it is much better to determine whether the computed Pearson's r denotes a high correlation between the variable concerned because statistical significance may only be negligible or too low to consider. Computer statistical outputs provide the probability of alpha which may indicate the percent of occurrence of the error to reject the null hypothesis when it is true.
  • 183.
    Sample Interpretation  Asshown in the table, math achievement is significantly related to the result of the NEAT in mathematics (r=.77). This means that the NEAT results in mathematics relate to the math achievement of the students in school. If a pupil performs well in school mathematics, he is likely to get high in the NEAT.
  • 184.
  • 185.
    The Pretest/Posttest control groupDesign  Experimental grp. R O1 X O2  Control grp. R O3 O4 where: 01 and 03 are pretests 02 and 04 are posttest
  • 186.
    Possible Results ofthe design  O2 = O4; The traditional and experimental approach have the same results.  O2 > O4; The experimental group have better results.  O2 < O4: The control group have better results.
  • 187.
    Sample of T-testOutput One-Sample Statistics N Mean Std. Dev Std. Error of the mean Pre Post 29 29 6.50 40.20 1.60 4.00 .29 .74 t – Value = 0.8972 (Probability of t = 0.4831)
  • 188.
    T Stat continued Paired Difference Std. Dev tdf Sig. (2- tailed) Pair 1 PRE POST 33.70 2.90 61.05 28 .000
  • 189.
    Sample of T-testOutput Independent samples Group Statistics N Mean Std. Dev Std. Error of the mean Post Exp Grp Control 15 4 40.4 40.0 4.3 3.8 1.14 1.01
  • 190.
    T Stat continued T-TEST FOR= of Means Std. Error t df Sig. (2- tailed) Equal variances assumed .232 1.5 .264 27 .794
  • 191.
    Sample result for Experimental Designand Group Comparison By T- test
  • 192.
    Difference Between 2Groups  Difference Between the Experimental & Control groups in the pre-test Statistics Experimental Control Group  Mean 7.6 7.4  SD 11.1 6.0  N 50 50  t – Value = 0.8972  (Probability of t = 0.4831)
  • 193.
    Interpretation ◦ The computedt-value for the difference between the pretest scores of the control and experimental groups shows no significant difference since the probability of error (.4831) is more than the target level (.05). ◦ The two groups are equally prepared for the experimentation as indicated by the very close means of the control (7.6) and experimental groups(7.4).
  • 194.
    Comparing 3 or MoreGroups By Analysis of Variance
  • 195.
    Illustrating an ANOVATable ANOVA Statistics for Weight Difference of Three Groups of Broilers Source of Var. df SS MS F Prob. of F  Between G 2 0.0932 0.046 2.84 0.0429  Within G 9 0.1479 0.016  Total 11 0.2411
  • 196.
  • 197.
    Analysis of Variancefor the Three Groups  The ANOVA table shows that the computed F is significant at 0.04 level. The difference was significant among the groups concerned. At 0.05 level, the null hypothesis, which states that no difference exists among the groups, was rejected. It means that the three groups of broilers were significantly different in terms of feed conversion.  (It is necessary to show the basis of the difference, thus, the researcher must present next the means of the three groups.
  • 198.
    Tell the differenceby the means Groups Mean  Group A 18.5  Group B 15.2  Group C 15.4
  • 199.
    Explain the reason The difference was explicit on the weight of the broilers. The broilers mixed fed with corn were heavier than the rest. The two groups, those mixed fed with grass and camote tops had almost similar mean weights. This shows that corn mixed in feeds resulted to heavier chicken because of the high protein carbohydrate content of corn compared to those mixed fed with plant products.
  • 200.
  • 201.
    Two-Way ANOVA  Tofind Difference Among Groups Mean1=Mean2=Mean3=…=Mean4  To find Interaction Between Variables MeanB11=MeanB12=MeanB13…=MeanBij
  • 202.
    Illustration 1 Problem: Isconstructivism strategy effective in teaching Analytic Geometry? One Solution: Test it between groups  1 group given the constructivist Strategy  1 group given the traditional approach
  • 203.
     Is therean interaction between method of teaching and the ability of the students? Solution  Use two-way ANOVA to compare between groups and determine interaction between variables. Illustration 2
  • 204.
     Is ConstructivistStrategy In Teaching Effective?  Is there an interaction between This Method and the ability of the students? Sample Problem
  • 205.
  • 206.
    Performance in AnalyticGeometry by treatment group & Mathematical Background Group Mathematical Background High Average Low Total T1 18.60 15.20 17.20 51 T2E 20.00 21.70 19.00 60.7 T3 14.50 17.10 15.00 46.6 T4E 19.20 19.60 13.90 52.7 72.30 73.60 65.10 211.0
  • 207.
    Analyze mean performancesand try to find out the highest and the lowest.  Observe that for those with high math ability group the highest mean was for the T2 group.  For the Average and Low Math ability groups, the highest means were also recorded for the T2 Group.  Among the three math ability groups, the highest recorded performance was for the average math ability group.
  • 208.
    Two-Way ANOVA Statistics SVSS df X2 F F Prob  Group 115.70 3 38.56 6.17 0.029  Math Bck 35.00 2 17.50 2.80 0.115  Interaction 7.10 6 12.85 2.05 0.045  Error 150.10 24 6.25  Total 377.90 35
  • 209.
     To interpretthe results, observe the probability of alpha (p-value). This will indicate whether the result is significant or not. Since alpha is the probability of rejecting the Ho when it is true, its value must be less than the targeted alpha.  Thus, the table shows that the interaction is significant. This will be the basis for answering the problem. If it is not significant, it follows that the researcher should examine the significance of the row or column differences between the means.
  • 210.
     Since theInteraction effect is significant, the researcher could pinpoint in the conclusion the observe differences. The higher means could be used as basis for the conclusions.  Since the highest mean was observed for the average mathematics ability group, it could be said that the constructivist method worked well with them.  T2 had the higher mean score compared to T4 which is also an experimental group. Compared to the control groups, both experimental groups had high mean performances.
  • 211.
  • 212.
    2. Conceptual Framework Thisdeals with the key concepts and related literature underlying the framework that guides the study. The purpose of this is: 1. To expand the context and background of the study 2. To help further define the problem 3. To provide an empirical basis for the subsequent development/formulation of hypothesis.
  • 213.
  • 214.
  • 215.
  • 216.
  • 217.
  • 218.
    Draft Written ResearchReport for Oral Presentation
  • 219.
    Final Written ResearchReport for Submission