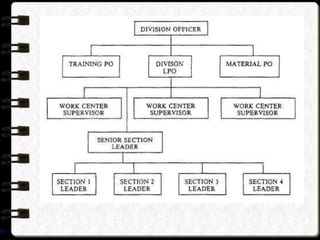
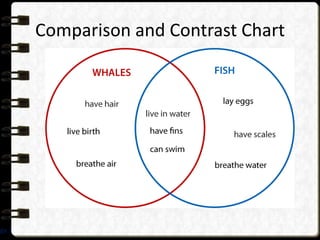
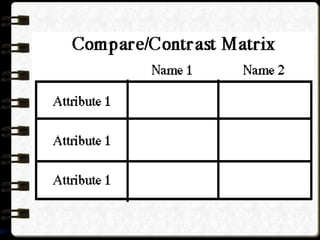
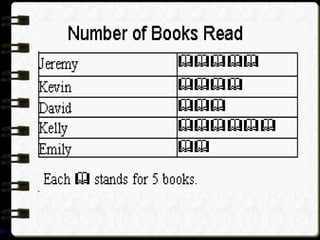
Lesson 13:


           Teaching with
               Visual Symbols


ogy 1
Visual symbols
        - are representations of direct reality, which
        comes in the form of signs and symbols. The
        following is a detailed discussion on the
        different kinds of visual symbols, which are
        drawings, sketches, cartoons, comics or strip
        drawing,       diagrams,     charts       and
        graphs, maps, and posters.


ogy 1
Kinds of
        Visual Symbols


ogy 1
A. DRAWINGS

        - Concrete visual or a representation of
        a real thing. It helps illustrating our
        lecture through freehand sketching in a
        chalkboard.


ogy 1
Samples


ogy 1
B. CARTOONS
    - Another kind of visual symbol. It tells
    its story metaphorically. The perfect
    cartoon needs no caption. The
    symbolism conveys the message.

         -It could also be used as a
    springboard for a lesson or a concluding
    activity.
ogy 1
SAMPLES


ogy 1
C. STRIP DRAWINGS
            -commonly called comics or
        comic strip. It is educational and
        entertaining at the same time.
             - it could also serve as
        motivation and a starter of a lesson.
        It can also be given as an activity for
        students to express insights gained at
        he conclusion of a lesson.
ogy 1
D. DIAGRAMS

     - Any line drawing that shows
arrangement and relations as of parts to the
whole, relative values, origins and development,
chronological fluctuations, distributions, etc. –
DALE

      The word GRAPH is sometimes used as
a synonym for diagram.
Types of a Diagram


ogy 1
•Affinity Diagram

            - used to cluster complex apparently
        unrelated data into natural and
        meaningful groups.

             - is a tool that gathers large amounts
        of language data (ideas, opinions, issues)
        and organizes them into groupings based
        on their natural relationships .
ogy 1
ogy 1
Tree Diagram

        - Used to chart out, in increasing
        details, the various tasks that must be
        accomplished to complete a project or
        achieve a specific objective.


ogy 1
ogy 1
Fishbone Diagram
        - Also called cause-and-effect diagram.
        It is a structured form of brainstorming
        that graphically shows the relationship
        of possible causes and sub causes directly
        related to an identified effect/problem.
        It is most commonly used to analyze
        work-related problems.

ogy 1
ogy 1
E. CHARTS
             - diagrammatic representation of
        relationships within an organizations.

        • Time Chart
        • Tree or Stream Chart
        • Flow Chart
        • Organizational Chart
        • Comparison and Contrast Chart
        • Pareto Chart
        • Run Chart or Trend Chart
ogy 1
Time Chart
            - tabular time chart that
        presents data in ordinal sequence.


ogy 1
ogy 1
Tree or Stream Chart

           -depicts development, growth
        and change by beginning with a
        simple course with spread outs into
        many branches.


ogy 1
ogy 1
Flowchart
    - visual way of charting or
showing a process from beginning
to end. It is a means of analyzing a
process. By outlining every step in
a process, you can begin to find
inefficiencies or problems.
Organizational Chart
          - shows how one part of the
        organization relates to other
        parts of the organization.


ogy 1
ogy 1
Comparison and Contrast Chart


ogy 1
ogy 1
Pareto chart
           -      type        of  bar
        chart,       prioritized   in
        descending          order  of
        magnitude or importance
        from left to right.

ogy 1
ogy 1
F. GRAPHS
          - pictures that help us
        understand amounts. These
        amounts are called data.


ogy 1
Circle Graph
           - is shaped like a circle. It is
        divided into fractions that look
        like pieces of pie, so sometimes a
        circle graph is called a pie graph.
        Many times the fractional parts
        are different colors and a key
        explains the colors.
ogy 1
ogy 1
Bar Graph
          - uses bars to show data. The
        bars can be vertical (up and
        down), or horizontal (across). The
        data can be in words or
        numbers.


ogy 1
ogy 1
A Picture Graph
          - uses pictures or symbols to show
        data. One picture often stands for
        more than one vote so a key is
        necessary to understand the
        symbols.


ogy 1
ogy 1
Map
           - is a visual representation of an
        area — a symbolic depiction
        highlighting relationships between
        elements of that space such as
        objects, regions, and themes.


ogy 1
Kinds of Map


ogy 1
Lesson 13 teaching with visual symbols

Lesson 13 teaching with visual symbols

  • 1.
    Lesson 13: Teaching with Visual Symbols ogy 1
  • 2.
    Visual symbols - are representations of direct reality, which comes in the form of signs and symbols. The following is a detailed discussion on the different kinds of visual symbols, which are drawings, sketches, cartoons, comics or strip drawing, diagrams, charts and graphs, maps, and posters. ogy 1
  • 3.
    Kinds of Visual Symbols ogy 1
  • 4.
    A. DRAWINGS - Concrete visual or a representation of a real thing. It helps illustrating our lecture through freehand sketching in a chalkboard. ogy 1
  • 5.
  • 6.
    B. CARTOONS - Another kind of visual symbol. It tells its story metaphorically. The perfect cartoon needs no caption. The symbolism conveys the message. -It could also be used as a springboard for a lesson or a concluding activity. ogy 1
  • 7.
  • 8.
    C. STRIP DRAWINGS -commonly called comics or comic strip. It is educational and entertaining at the same time. - it could also serve as motivation and a starter of a lesson. It can also be given as an activity for students to express insights gained at he conclusion of a lesson. ogy 1
  • 9.
    D. DIAGRAMS - Any line drawing that shows arrangement and relations as of parts to the whole, relative values, origins and development, chronological fluctuations, distributions, etc. – DALE The word GRAPH is sometimes used as a synonym for diagram.
  • 10.
    Types of aDiagram ogy 1
  • 11.
    •Affinity Diagram - used to cluster complex apparently unrelated data into natural and meaningful groups. - is a tool that gathers large amounts of language data (ideas, opinions, issues) and organizes them into groupings based on their natural relationships . ogy 1
  • 12.
  • 13.
    Tree Diagram - Used to chart out, in increasing details, the various tasks that must be accomplished to complete a project or achieve a specific objective. ogy 1
  • 14.
  • 15.
    Fishbone Diagram - Also called cause-and-effect diagram. It is a structured form of brainstorming that graphically shows the relationship of possible causes and sub causes directly related to an identified effect/problem. It is most commonly used to analyze work-related problems. ogy 1
  • 16.
  • 17.
    E. CHARTS - diagrammatic representation of relationships within an organizations. • Time Chart • Tree or Stream Chart • Flow Chart • Organizational Chart • Comparison and Contrast Chart • Pareto Chart • Run Chart or Trend Chart ogy 1
  • 18.
    Time Chart - tabular time chart that presents data in ordinal sequence. ogy 1
  • 19.
  • 20.
    Tree or StreamChart -depicts development, growth and change by beginning with a simple course with spread outs into many branches. ogy 1
  • 21.
  • 22.
    Flowchart - visual way of charting or showing a process from beginning to end. It is a means of analyzing a process. By outlining every step in a process, you can begin to find inefficiencies or problems.
  • 24.
    Organizational Chart - shows how one part of the organization relates to other parts of the organization. ogy 1
  • 25.
  • 26.
  • 27.
  • 28.
    Pareto chart - type of bar chart, prioritized in descending order of magnitude or importance from left to right. ogy 1
  • 29.
  • 30.
    F. GRAPHS - pictures that help us understand amounts. These amounts are called data. ogy 1
  • 31.
    Circle Graph - is shaped like a circle. It is divided into fractions that look like pieces of pie, so sometimes a circle graph is called a pie graph. Many times the fractional parts are different colors and a key explains the colors. ogy 1
  • 32.
  • 33.
    Bar Graph - uses bars to show data. The bars can be vertical (up and down), or horizontal (across). The data can be in words or numbers. ogy 1
  • 34.
  • 35.
    A Picture Graph - uses pictures or symbols to show data. One picture often stands for more than one vote so a key is necessary to understand the symbols. ogy 1
  • 36.
  • 37.
    Map - is a visual representation of an area — a symbolic depiction highlighting relationships between elements of that space such as objects, regions, and themes. ogy 1
  • 38.