Downloaded 753 times


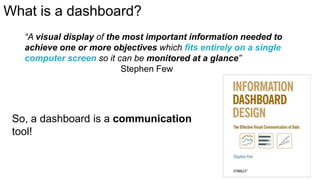

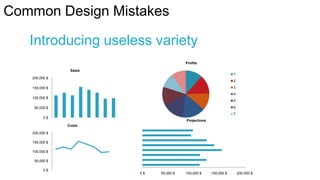
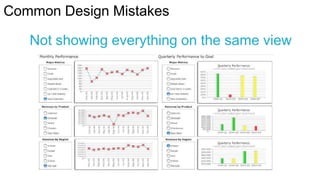
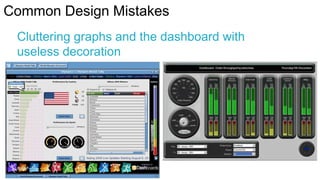
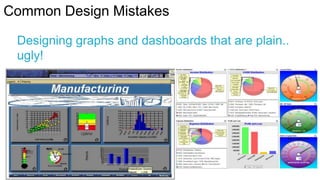
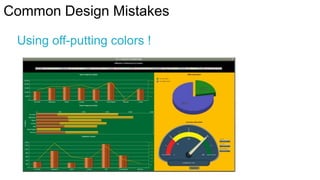
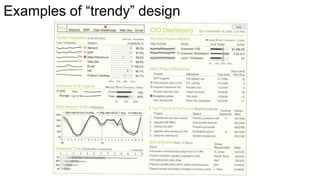
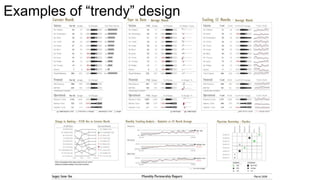
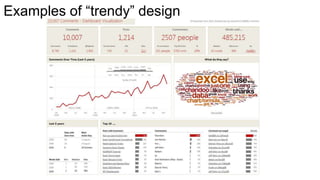


The document is a transcript of a webinar on data visualization and dashboard design led by Jacques Warren, CEO of WAO/Marketing. It emphasizes the importance of clear and efficient data visualization to improve analytics adoption and success, providing foundational principles and practical design guidelines for effective dashboards. The content covers visualization types, the significance of audience consideration, and common design pitfalls to avoid.