Downloaded 119 times
![Analytics to solve problems
Analytics could filter discussions or group learners
18
You have been actively engaged in the
discussions, which is excellent, thank you,
but with more than 23,000 participants it
means that our responses and comments
risk getting lost.
This will be primary school material for
some of you and exactly the opposite for
others. It is just not possible to tailor the
material to each of you […]
Introduction to
Forensic Science:
University of Strathclyde](https://image.slidesharecdn.com/learningdesignandlearninganalytics-150705114037-lva1-app6891/75/Learning-design-and-learning-analytics-18-2048.jpg)
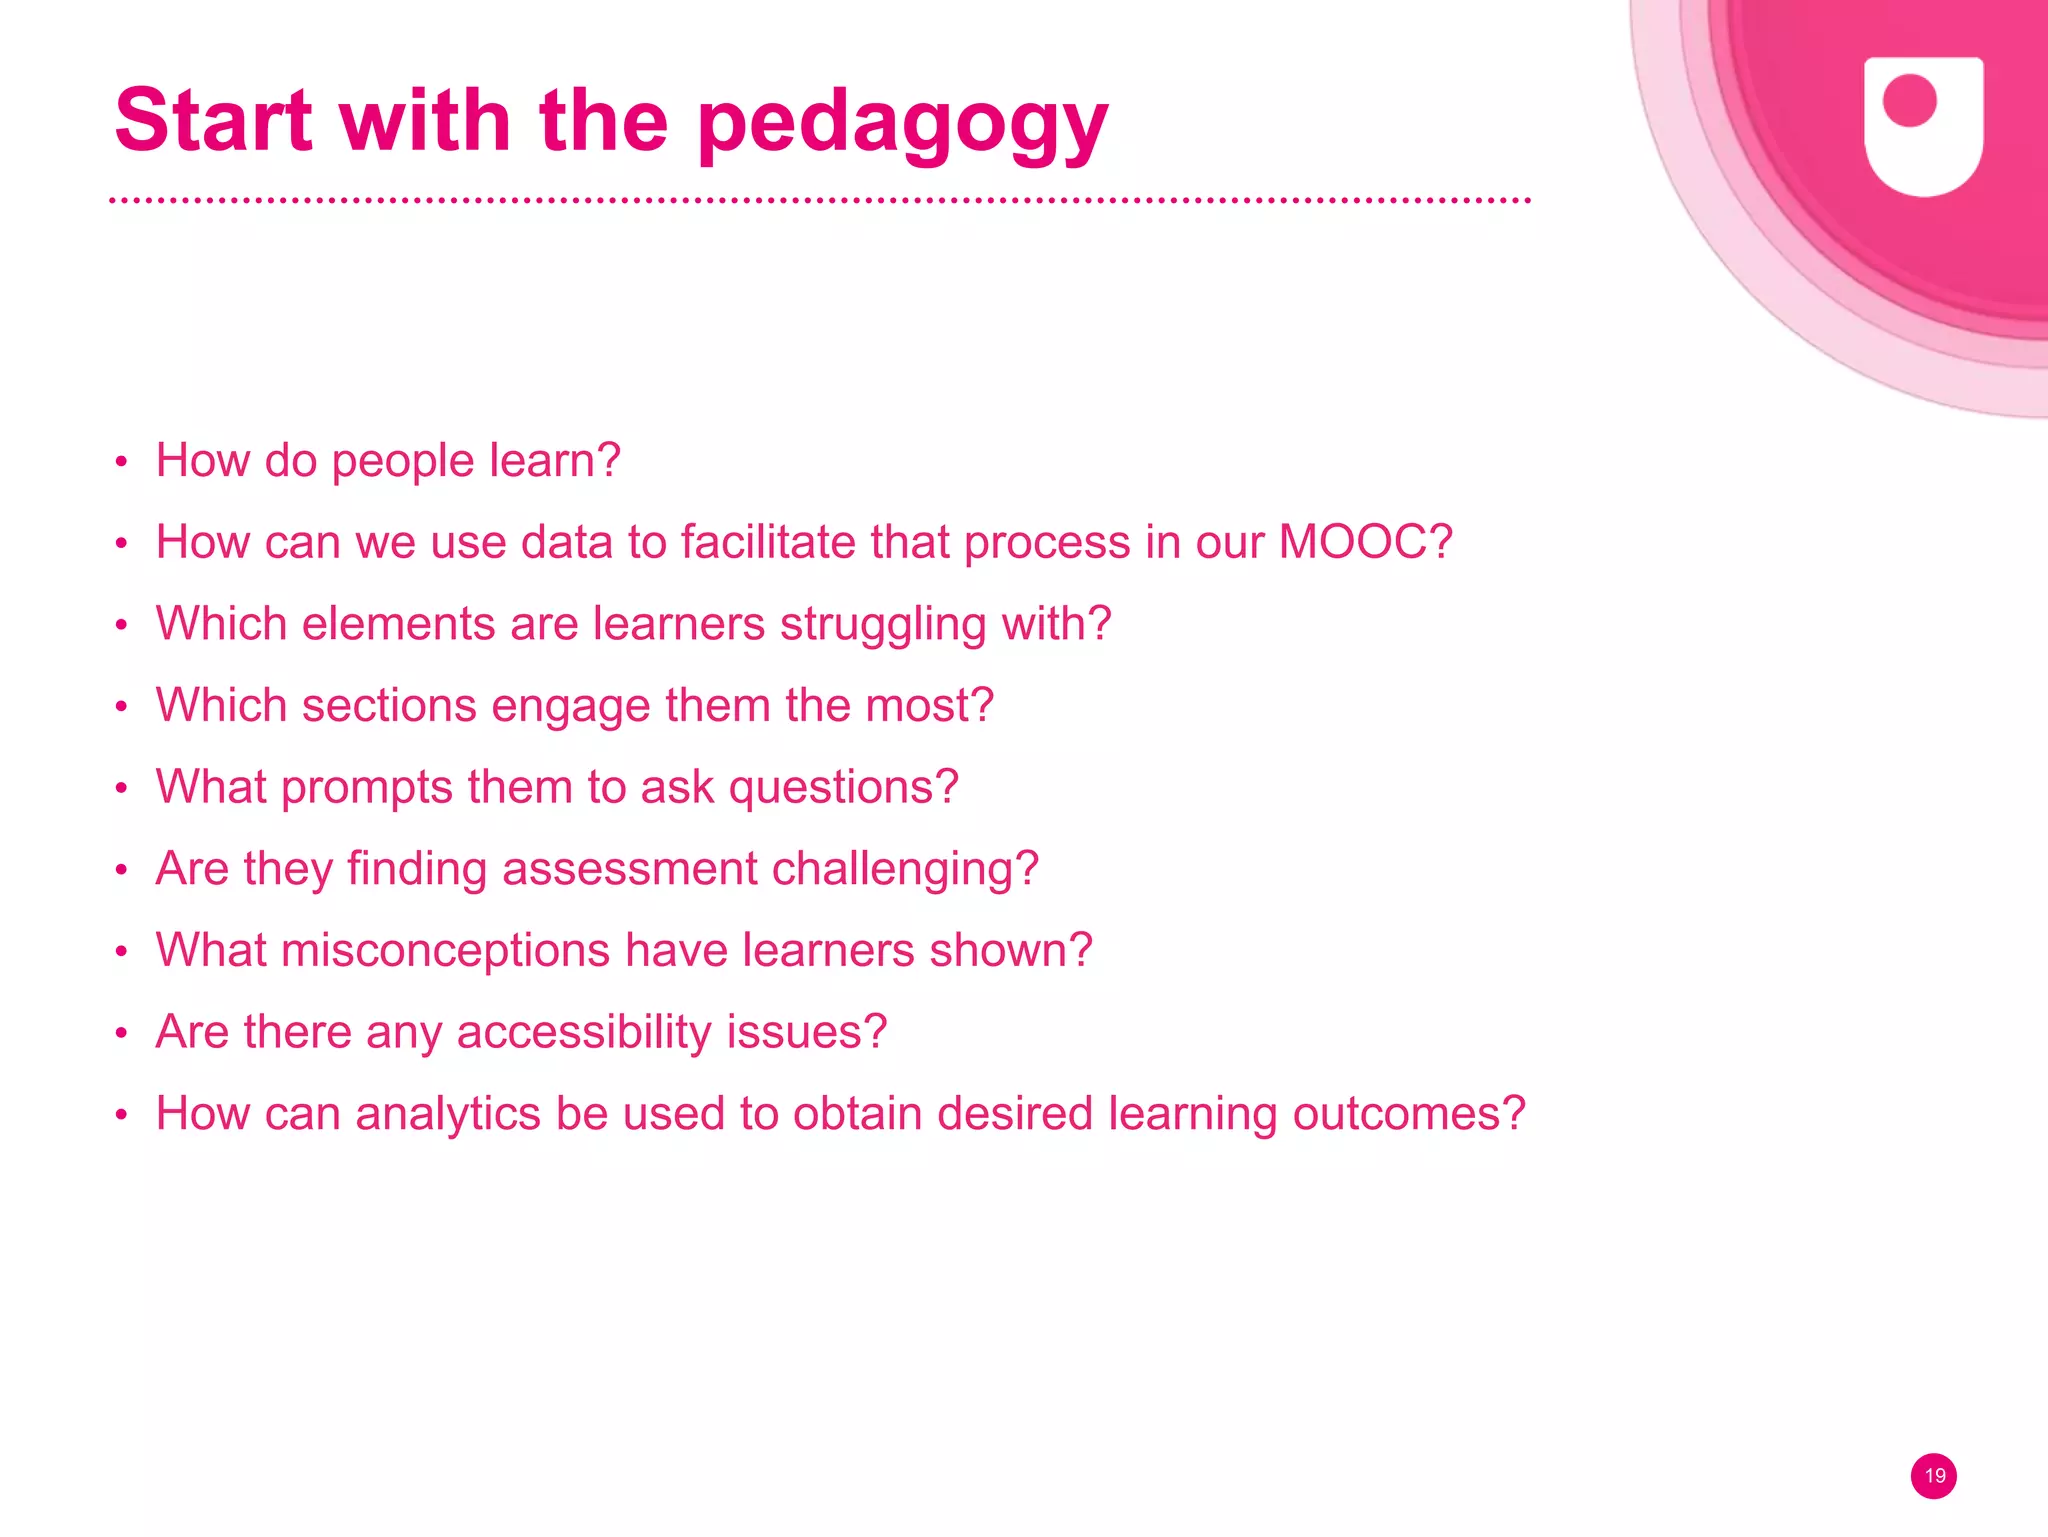
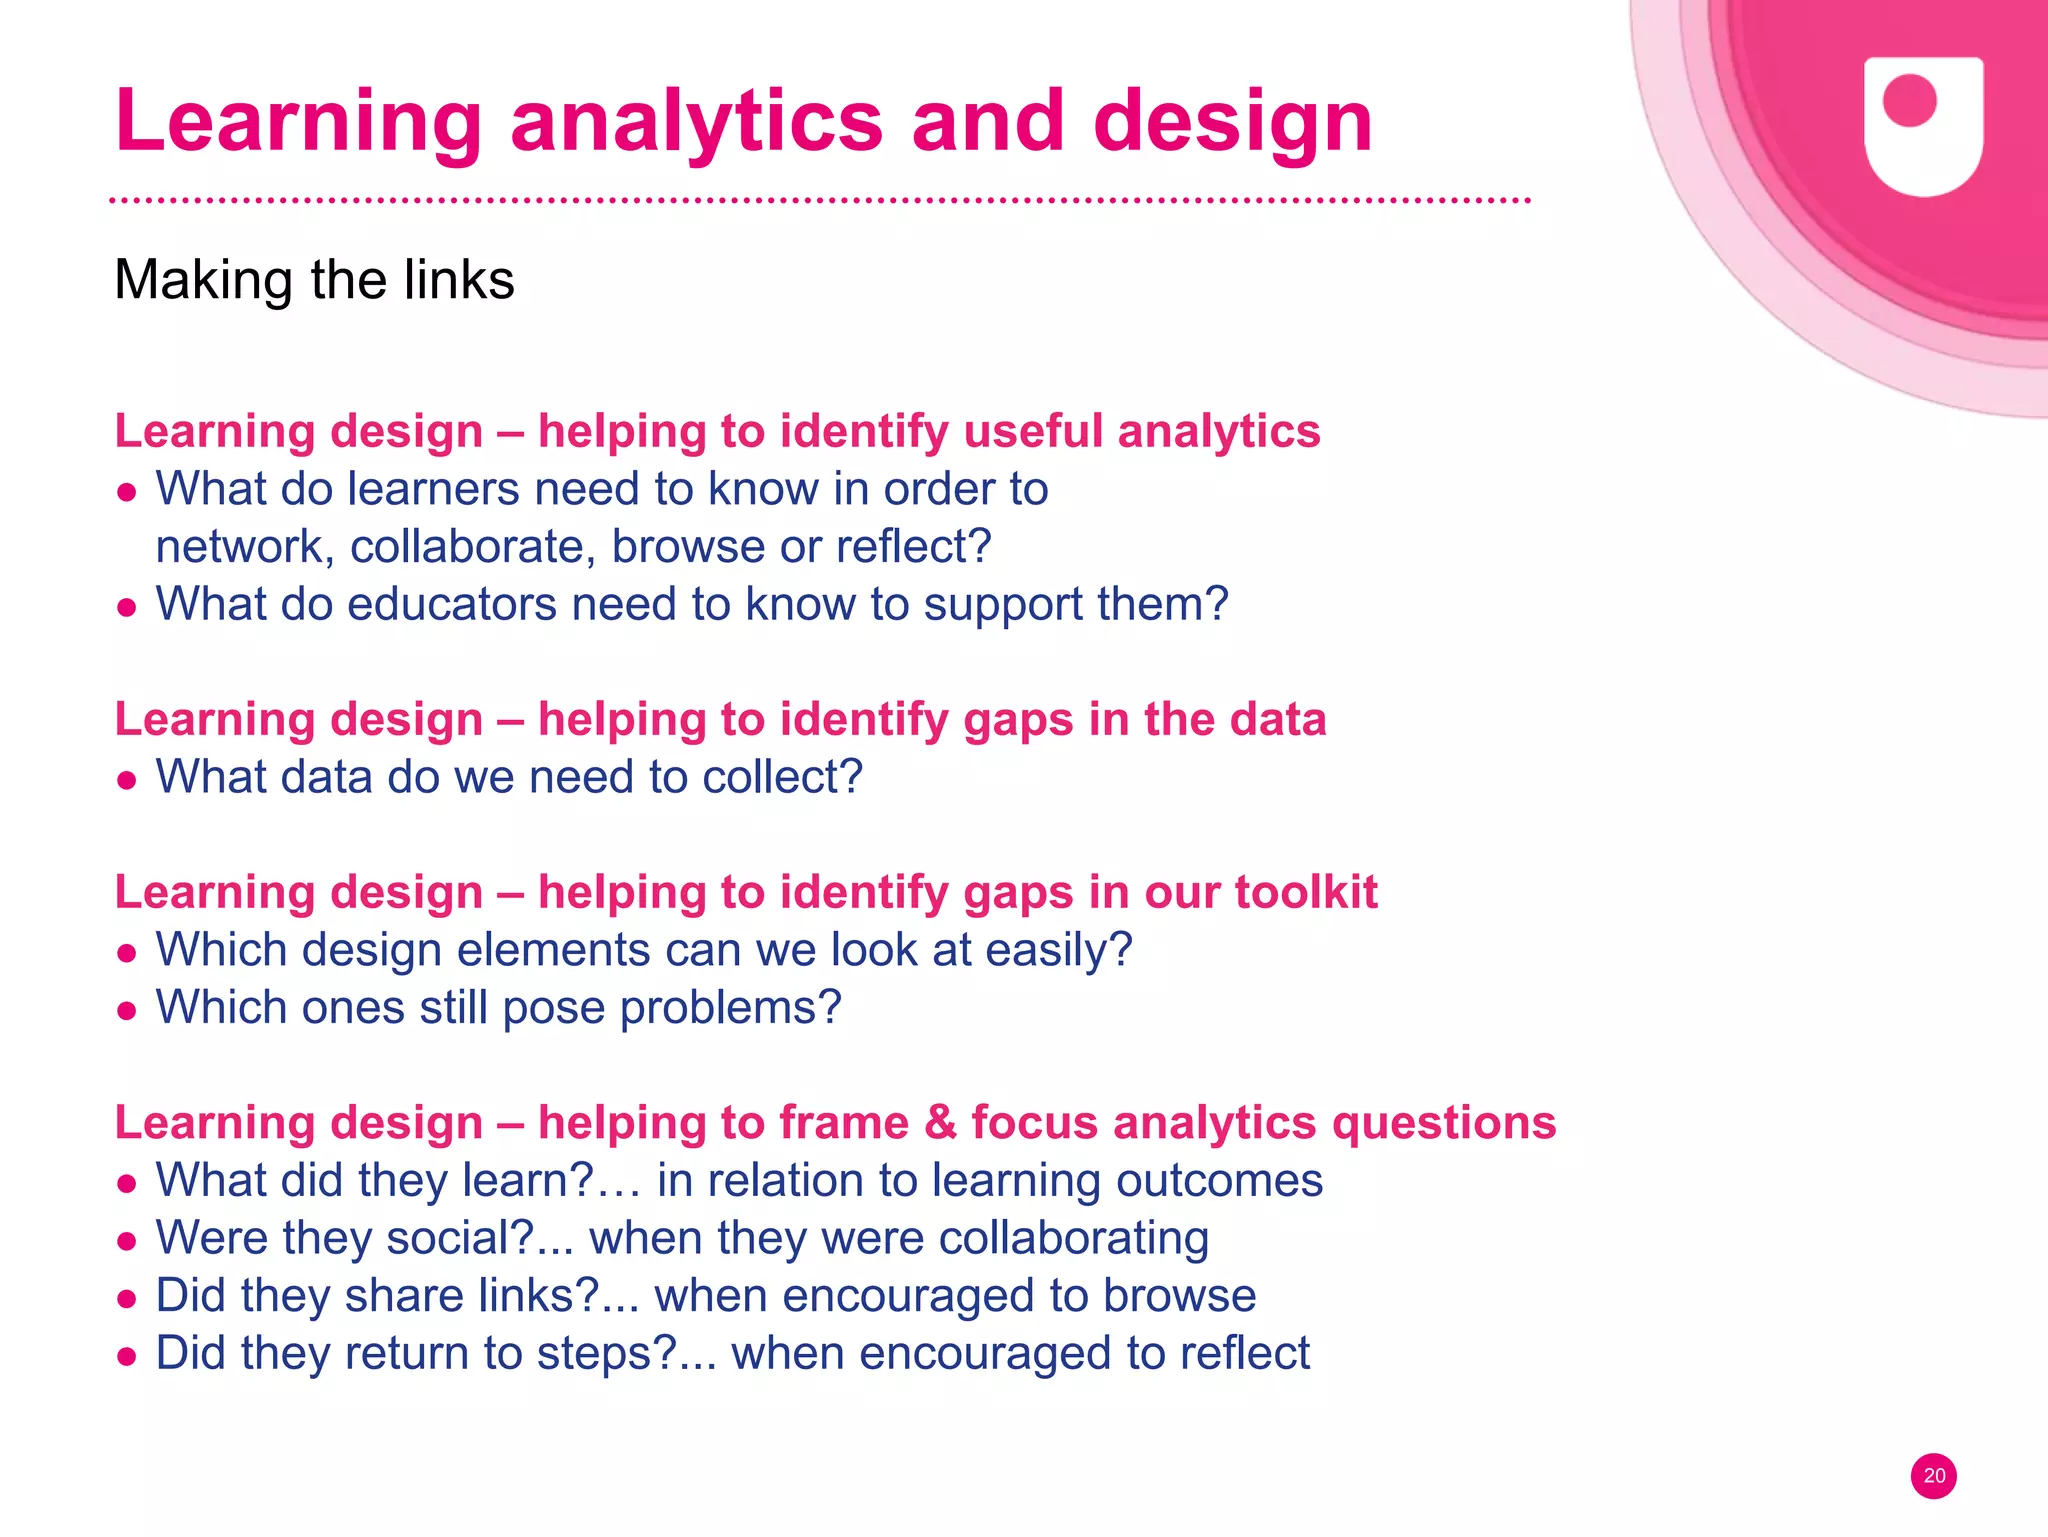
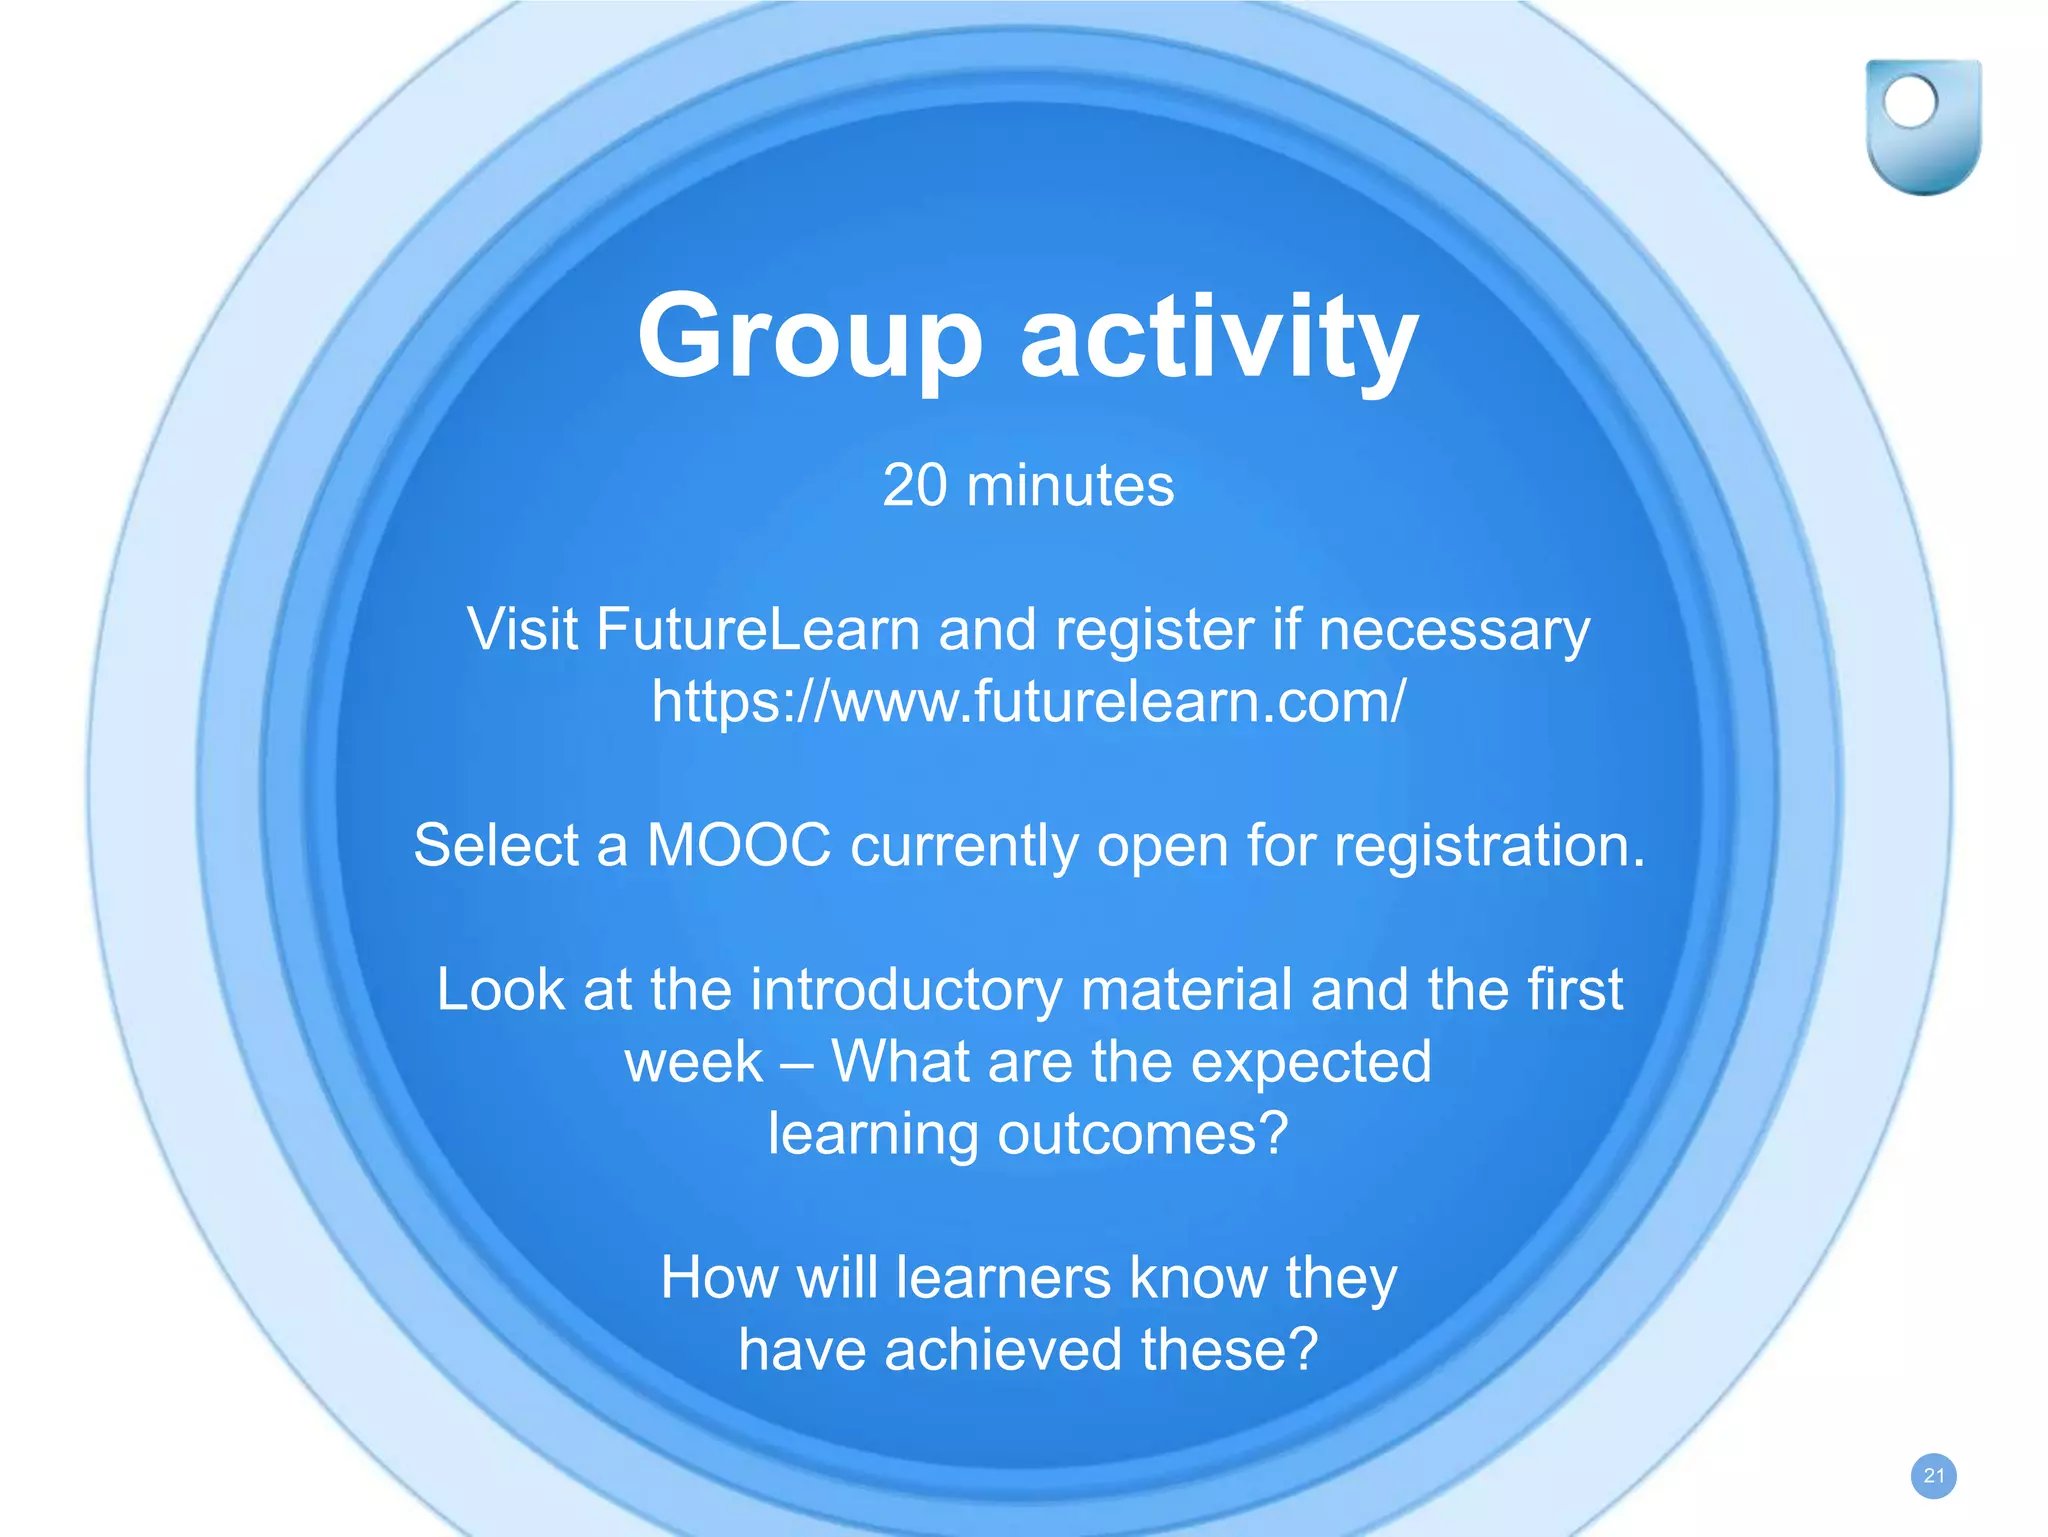

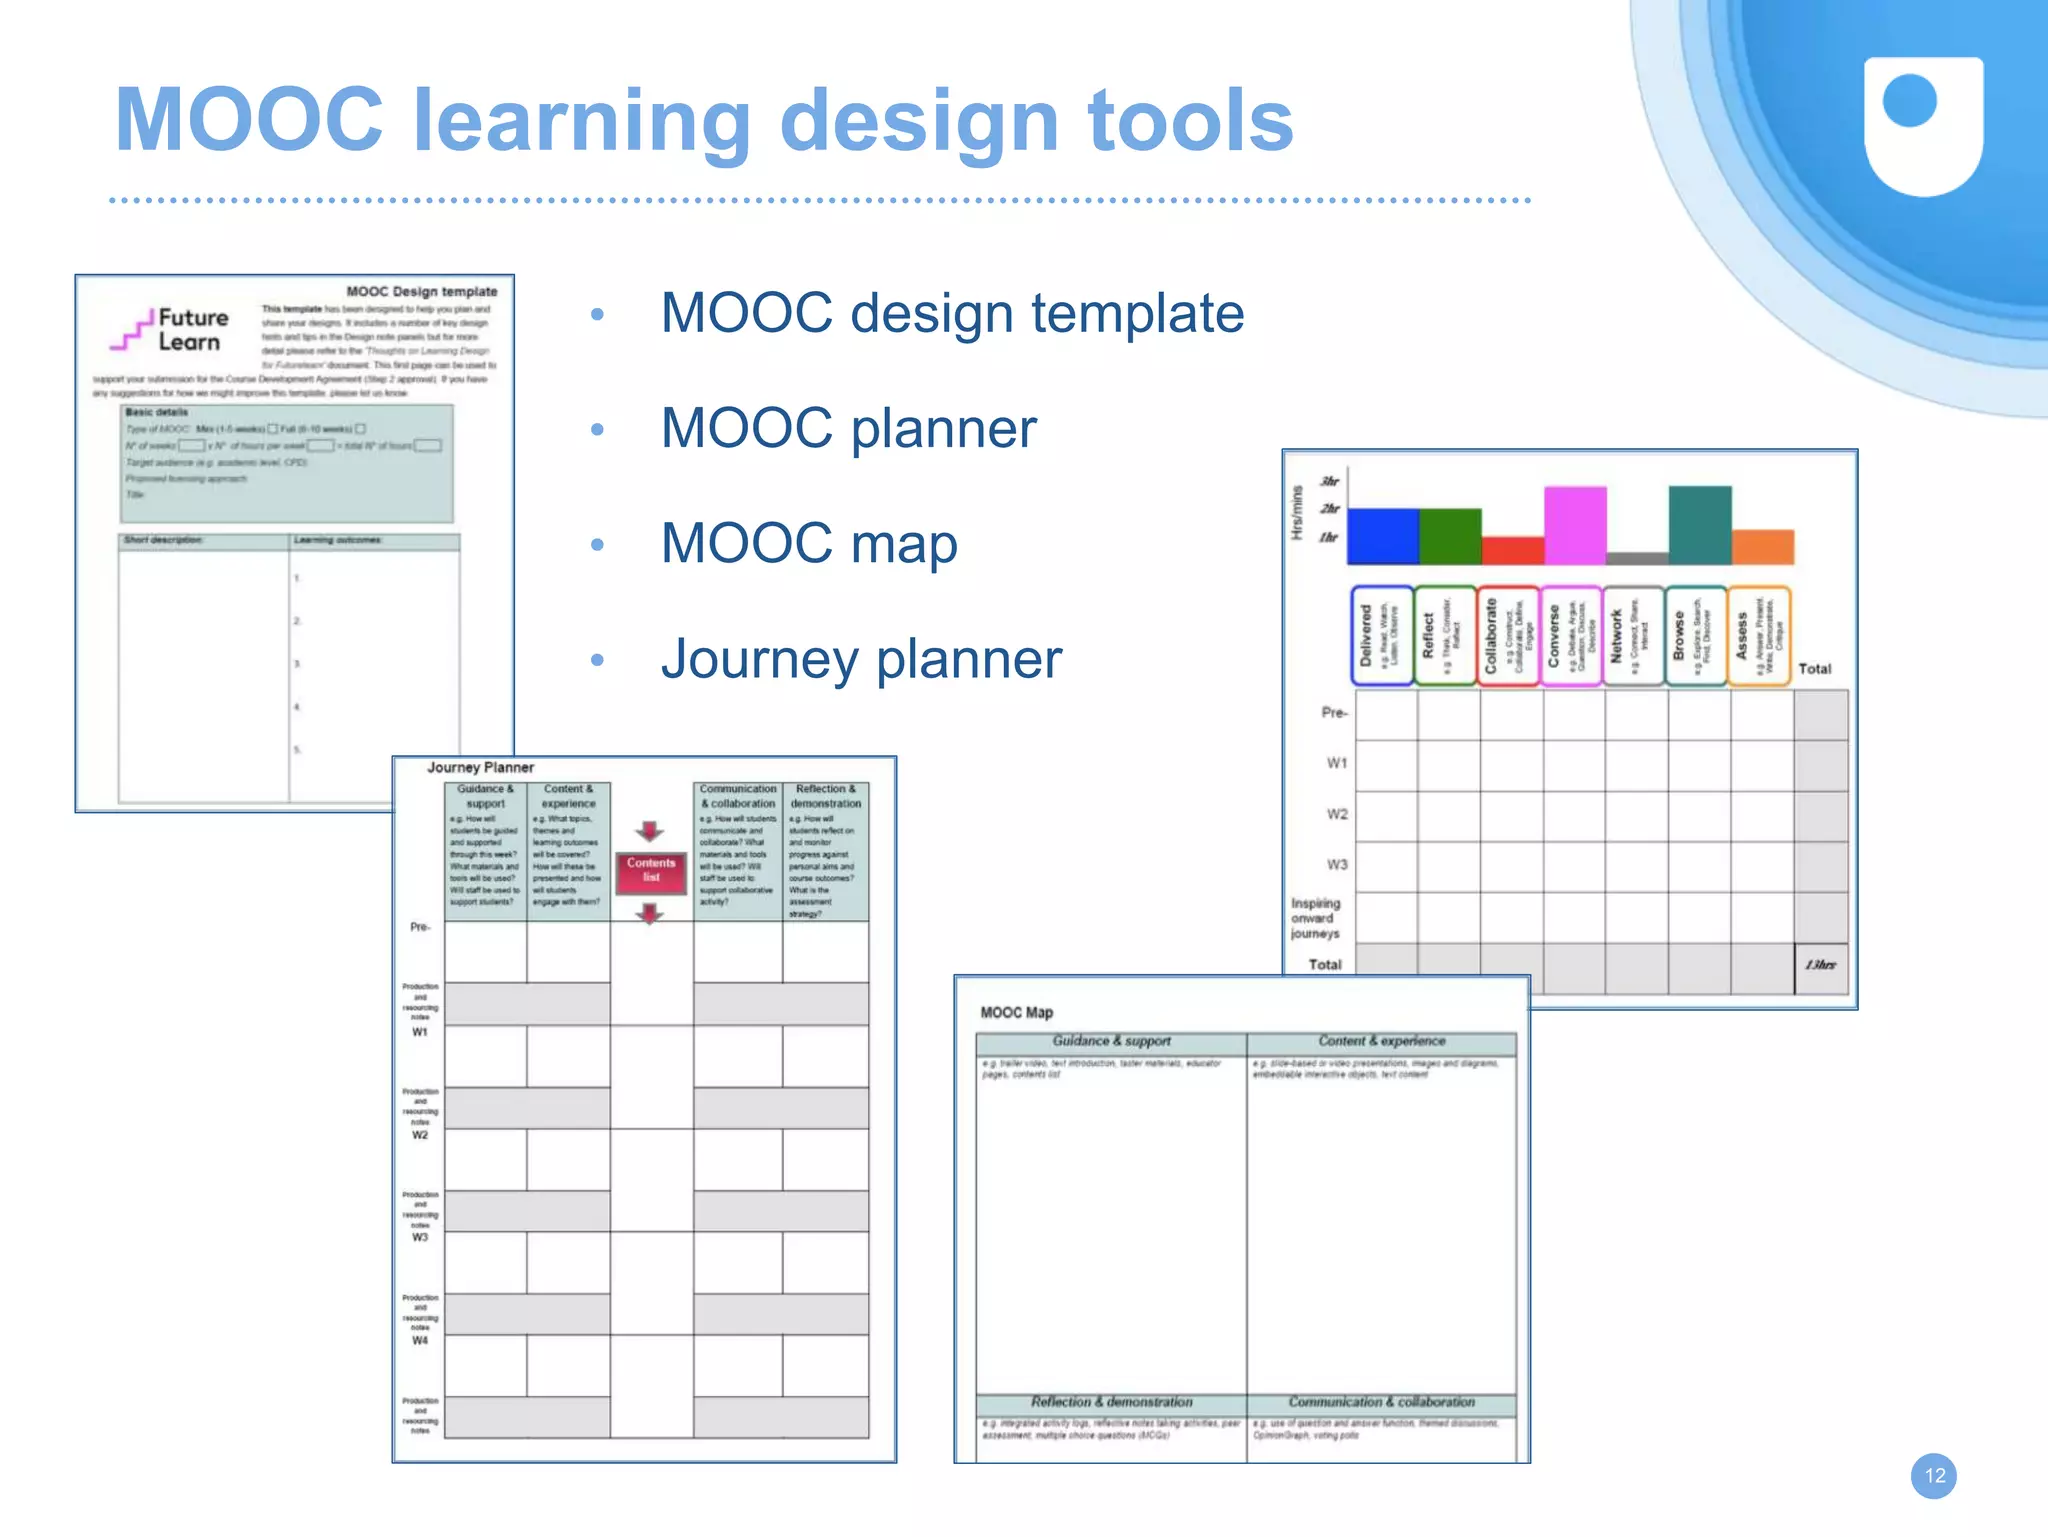
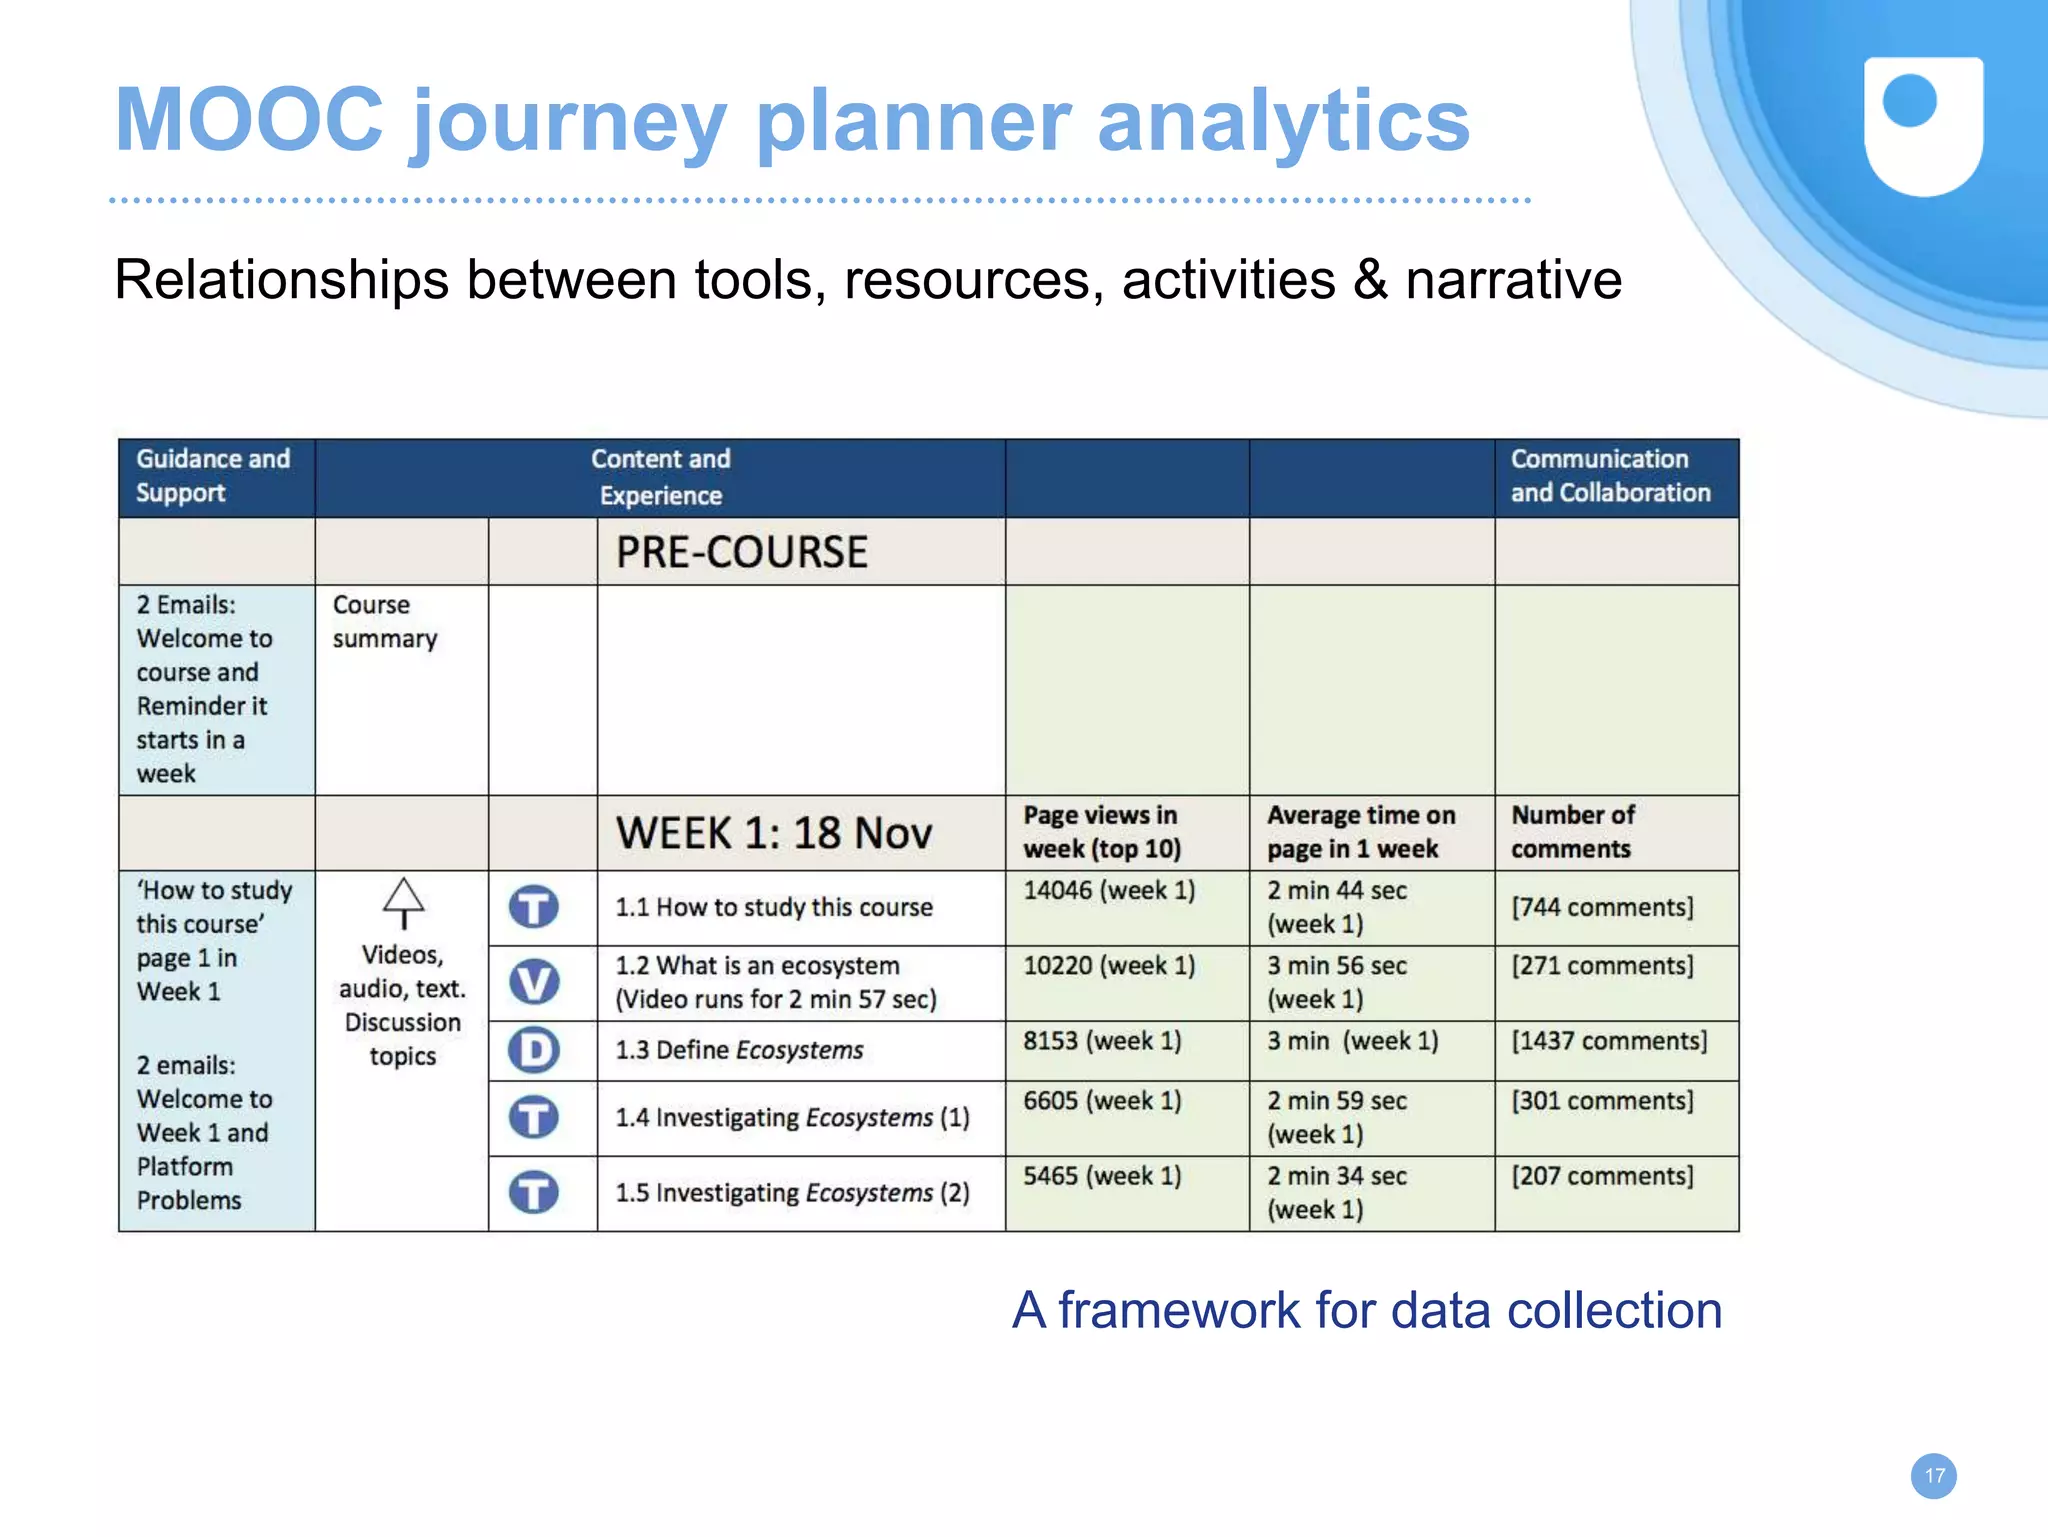
This document summarizes a workshop on linking learning analytics, learning design, and MOOCs. It discusses how learning analytics can provide actionable intelligence for learners and educators. Group activities involved analyzing MOOCs to identify learning outcomes, assessments, and how analytics could support learning. The document suggests learning design tools like templates, planners, and maps can help identify useful analytics and frame analytics questions. The goal is to use analytics to facilitate learning, identify struggles, engagement, and address problems by starting with pedagogy.


![[Extended] Bottom-up growth of learning analytics at two Australian universit...](https://cdn.slidesharecdn.com/ss_thumbnails/bottom-upgrowthofla-160416081432-thumbnail.jpg?width=640&height=640&fit=bounds)


