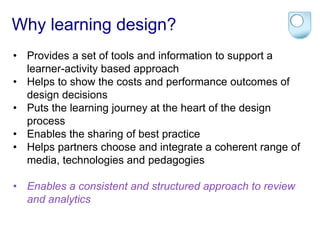
Downloaded 34 times


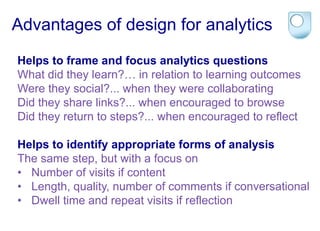
![Patterns of engagement
On an eight-week MOOC
Samplers visit only briefly
[1, 0, 0, 0, 0, 0, 0, 0]
Strong starters do first assessment
[9, 1, 0, 0, 0, 0, 0, 0]
Returners come back in Week 2
[9, 9, 0, 0, 0, 0, 0, 0]
Mid-way Dropouts
[9, 9, 9, 4, 1, 1, 0, 0]
Nearly There drop out near the end
[11, 11, 9, 11, 9, 9, 8, 0]
Late Completers finish
[5, 5, 5, 5, 5, 5, 9, 9, 9]
Keen Completers do almost
everything [11, 11, 9, 9, 11, 11, 9, 9] Patterns vary with pedagogy
and learning design](https://image.slidesharecdn.com/learningdesignandlearninganalytics-141205104458-conversion-gate02/85/Learning-design-and-learning-analytics-10-320.jpg)
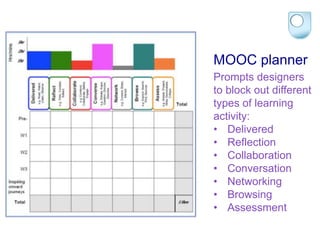
![Short MOOCs
Surgers concentrate their effort after the first week of a three-week
course. They do little in Week 1 other than submit their
assessment late, engage more in Week 2, but still submit their
assessment late (working on it in Week 3), and engage but do not
submit in Week 3. On average, they post one or two comments.
A typical engagement profile for this cluster is: [4, 6, 2]
Improvers fall behind in Week 1, submitting their first assessment
late. However, they engage more in Week 2 and by Week 3 they
are on schedule and submit their assessment on time. They view
the majority of steps on the course and typically post more than
one comment.
A typical engagement profile for this cluster is: [5, 6, 9]](https://image.slidesharecdn.com/learningdesignandlearninganalytics-141205104458-conversion-gate02/85/Learning-design-and-learning-analytics-11-320.jpg)


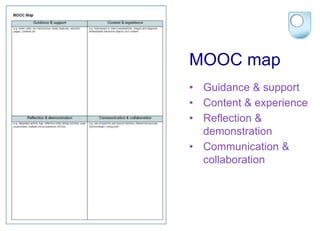
This document discusses the relationship between learning design and learning analytics. It argues that learning design provides context that helps frame analytics questions and identify appropriate analysis. A MOOC planner is presented that prompts designers to plan different activity types like delivered content, reflection, collaboration, and assessment. Analytics can then provide insight into how learners engaged with those different activities. The document also discusses clustering analysis of learner engagement patterns in MOOCs, like samplers, strong starters, mid-way dropouts, and keen completers. Engagement patterns can vary based on pedagogy and learning design.


