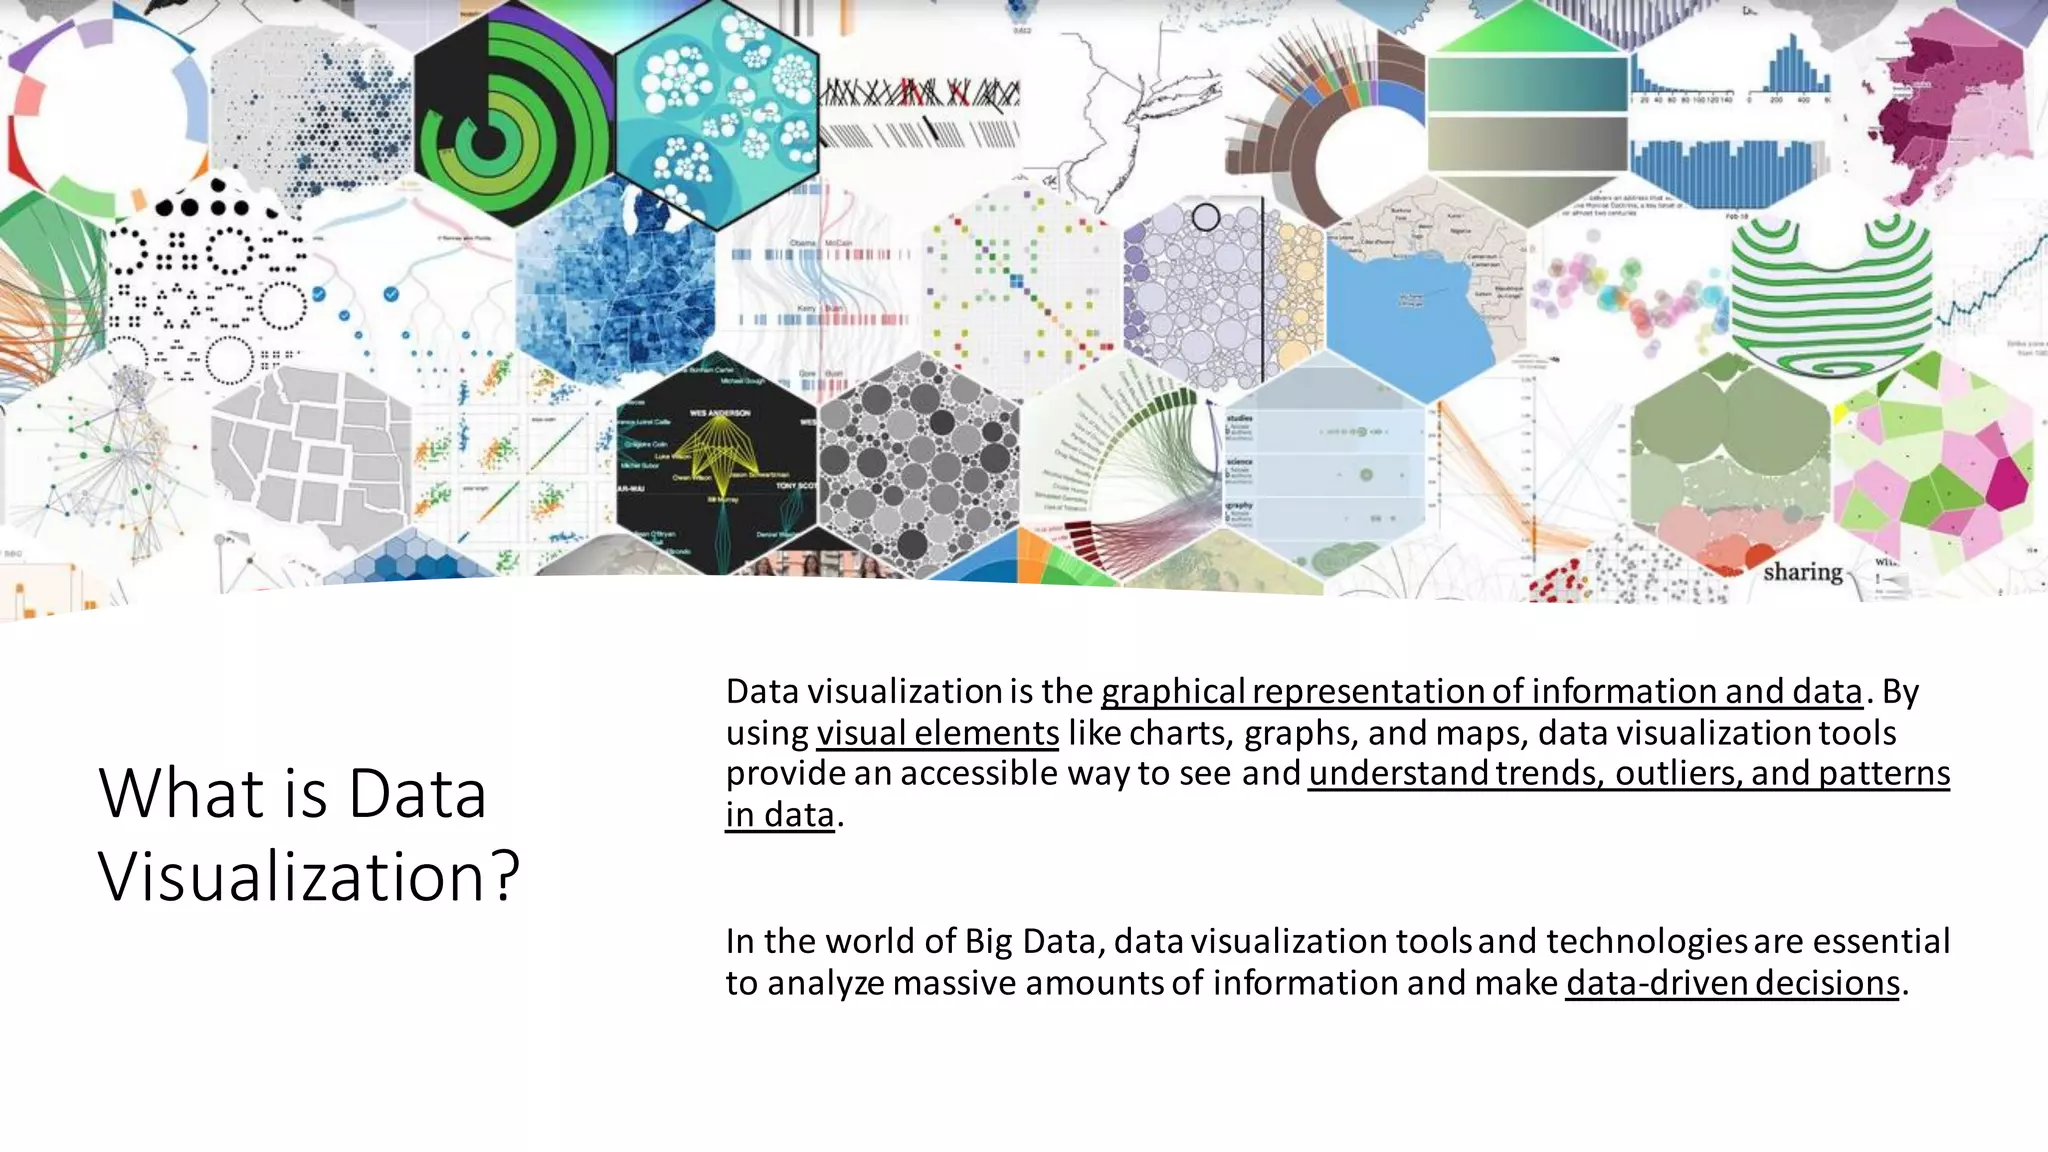
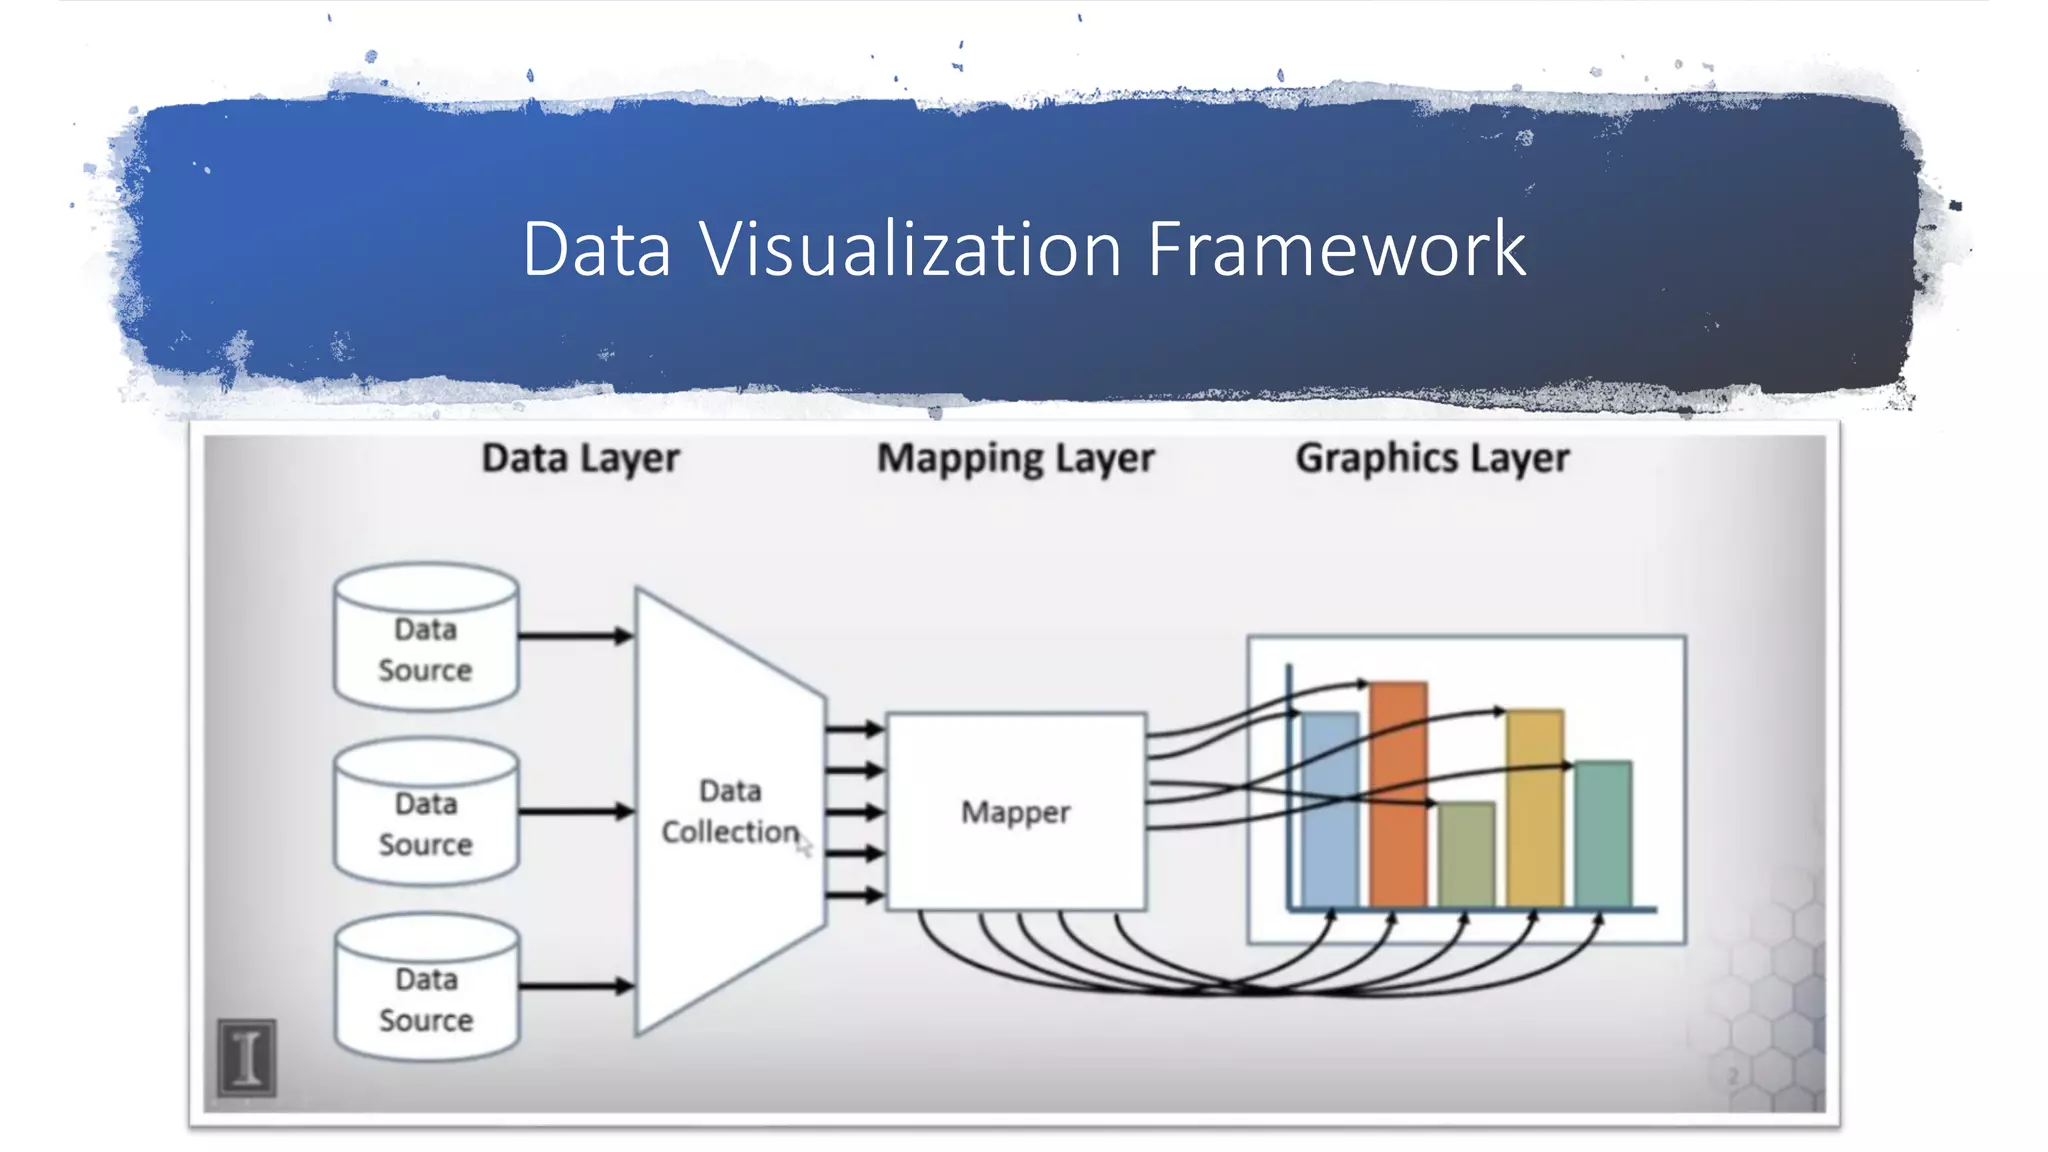
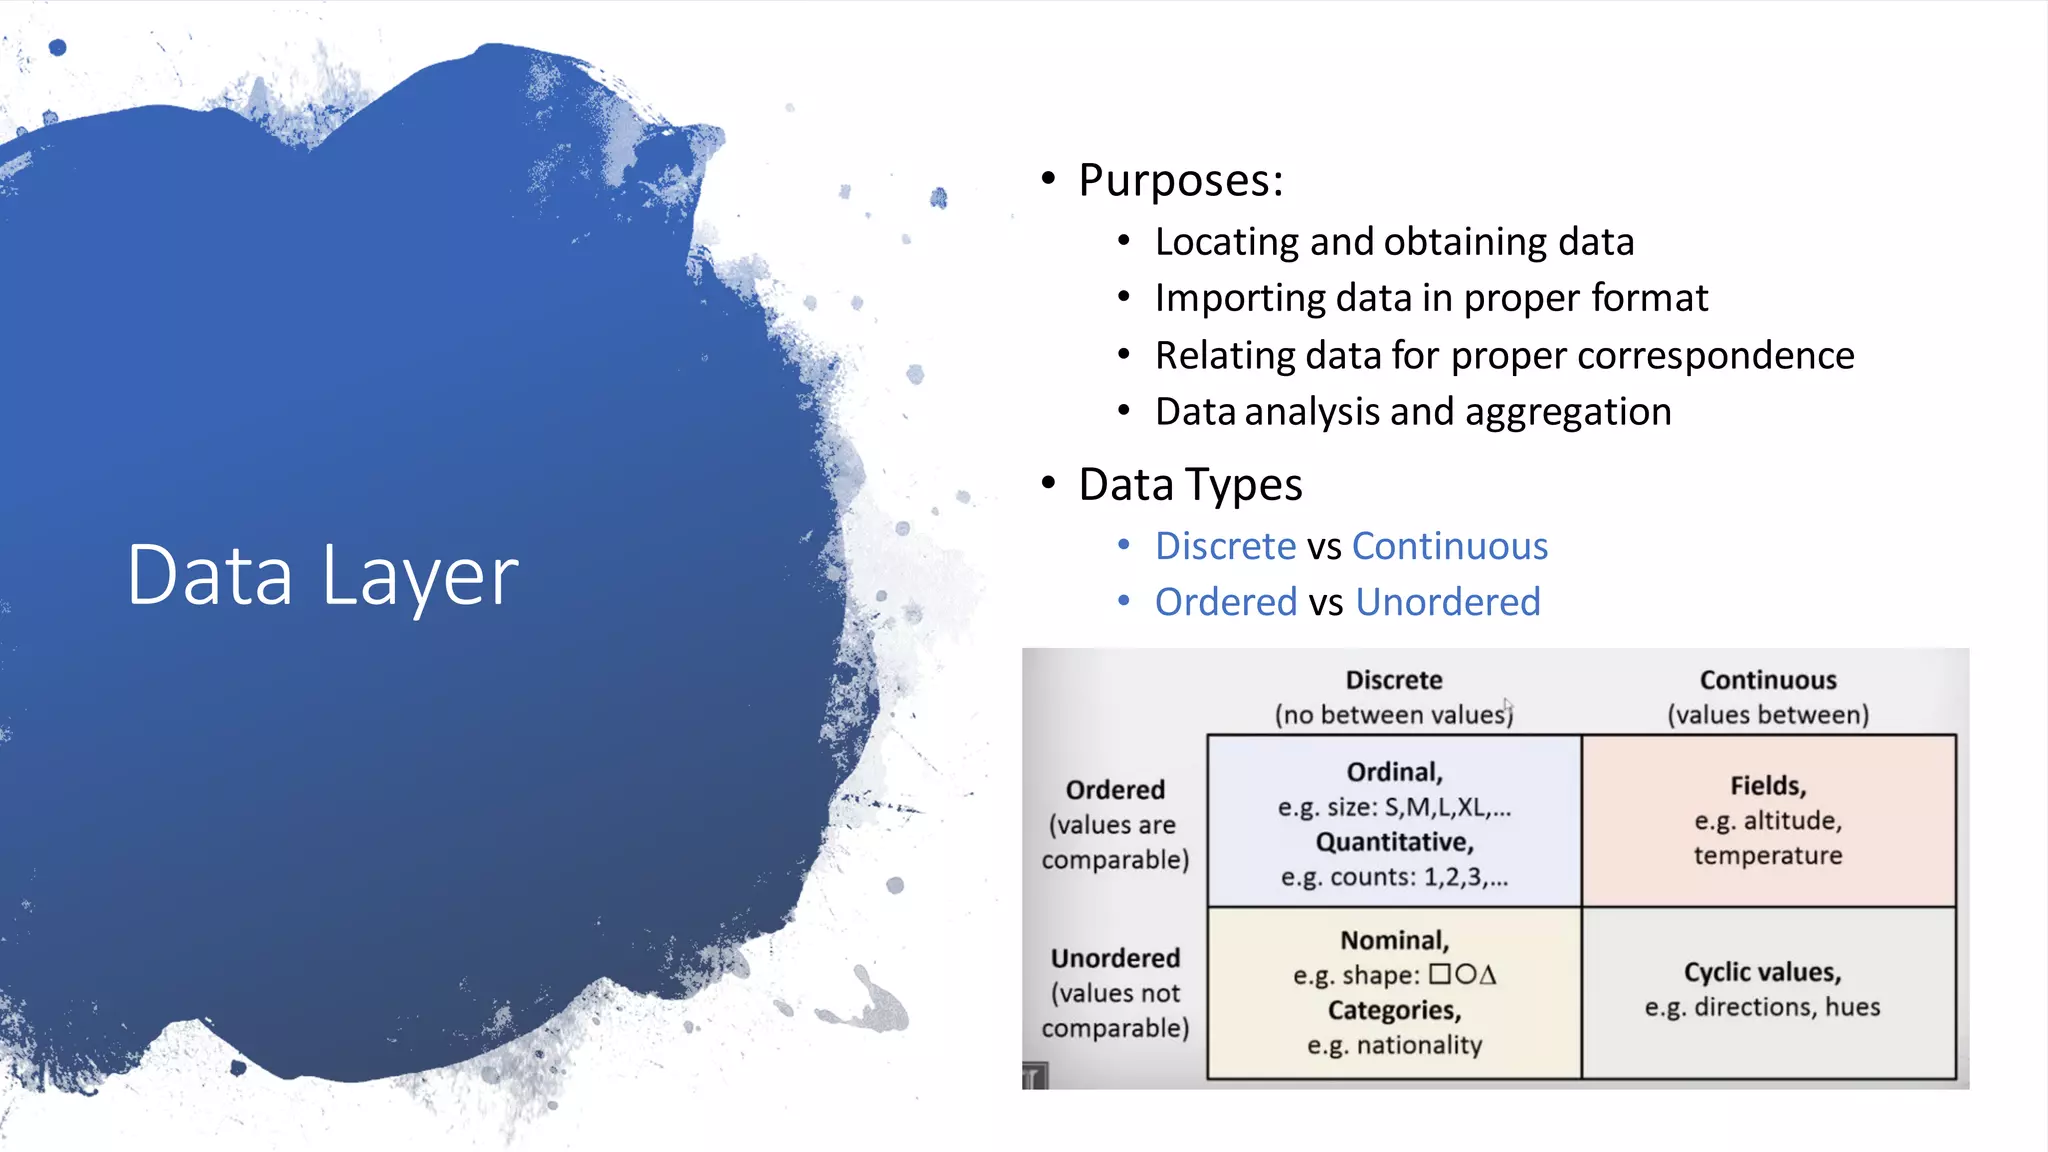
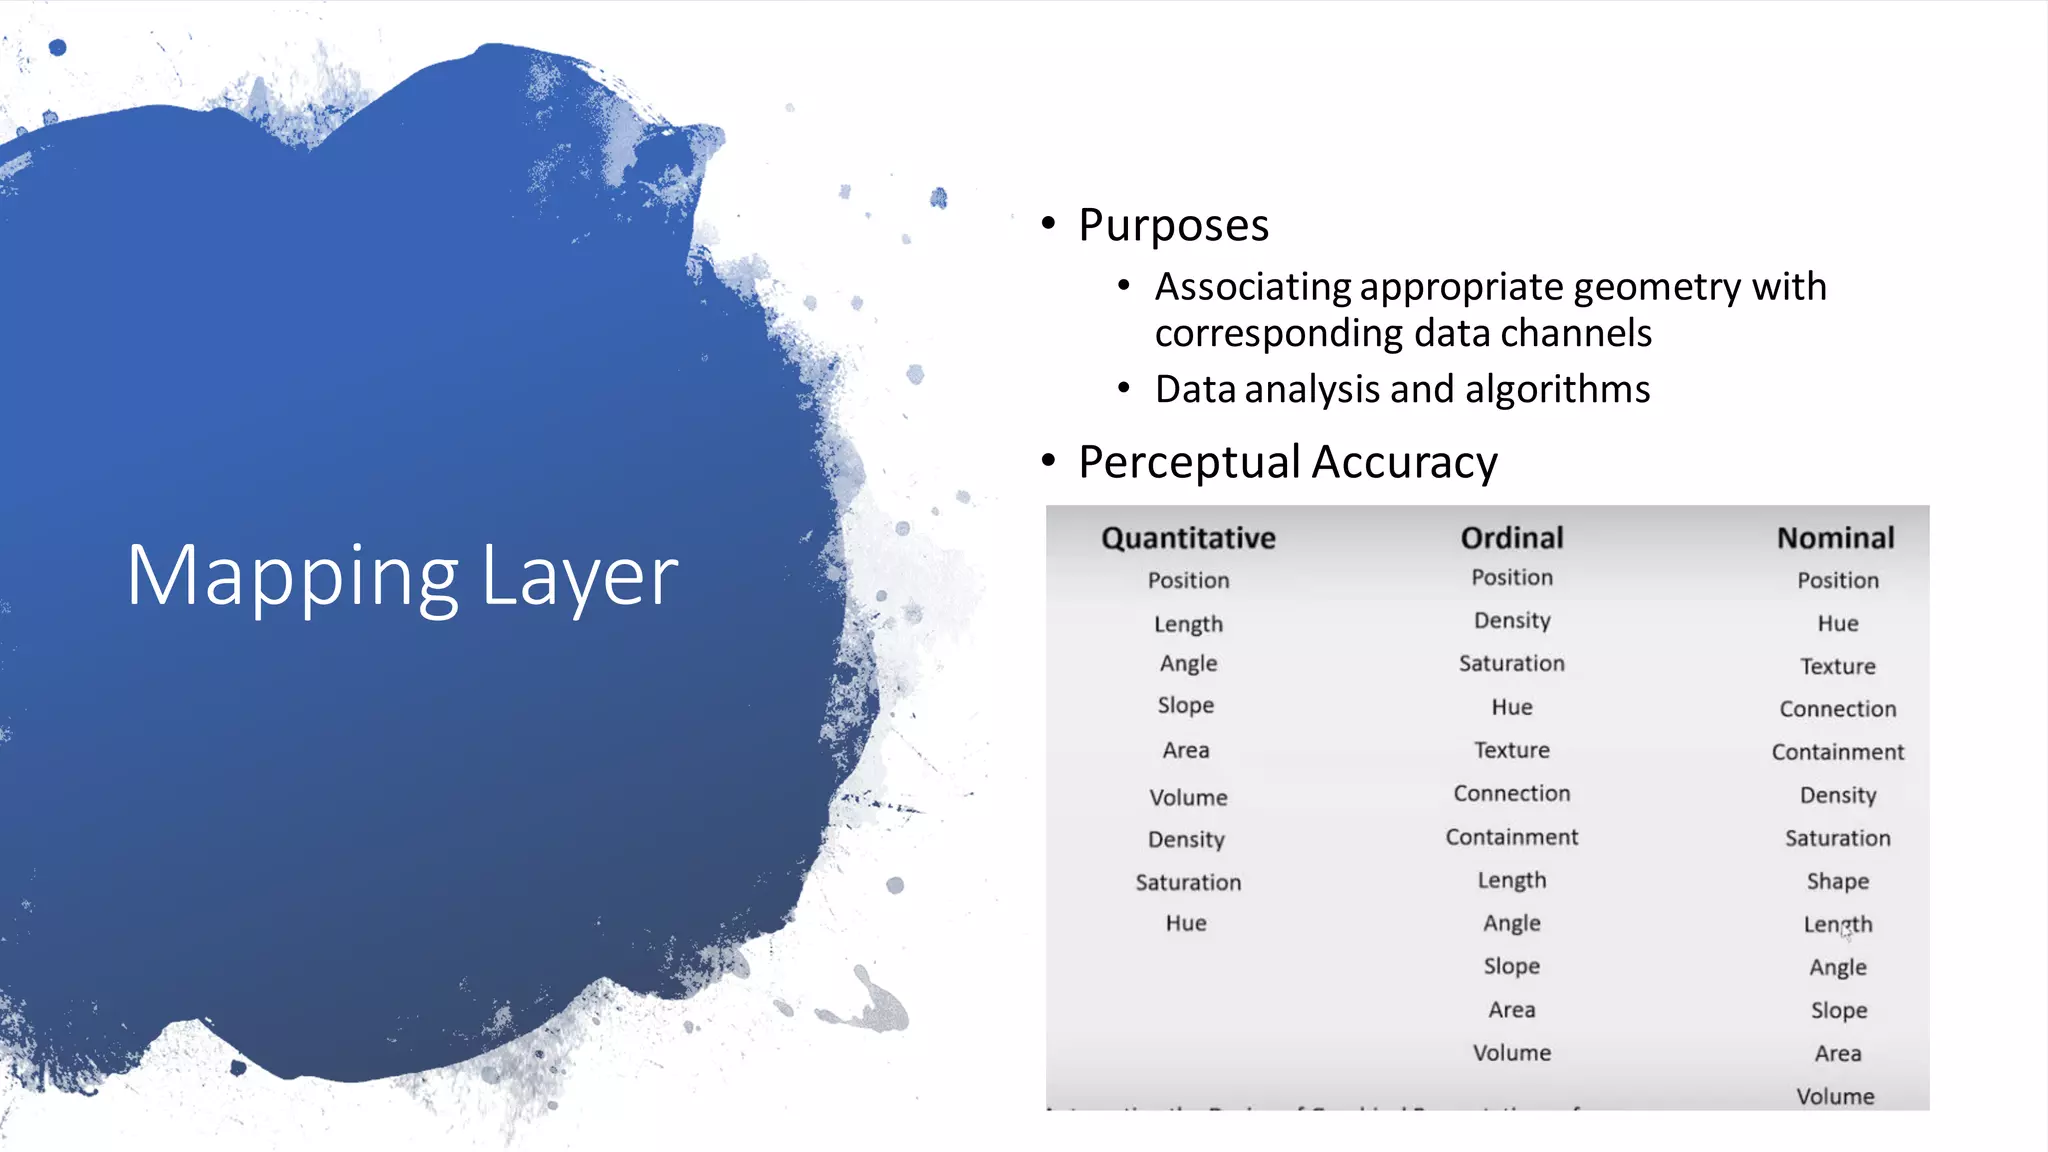
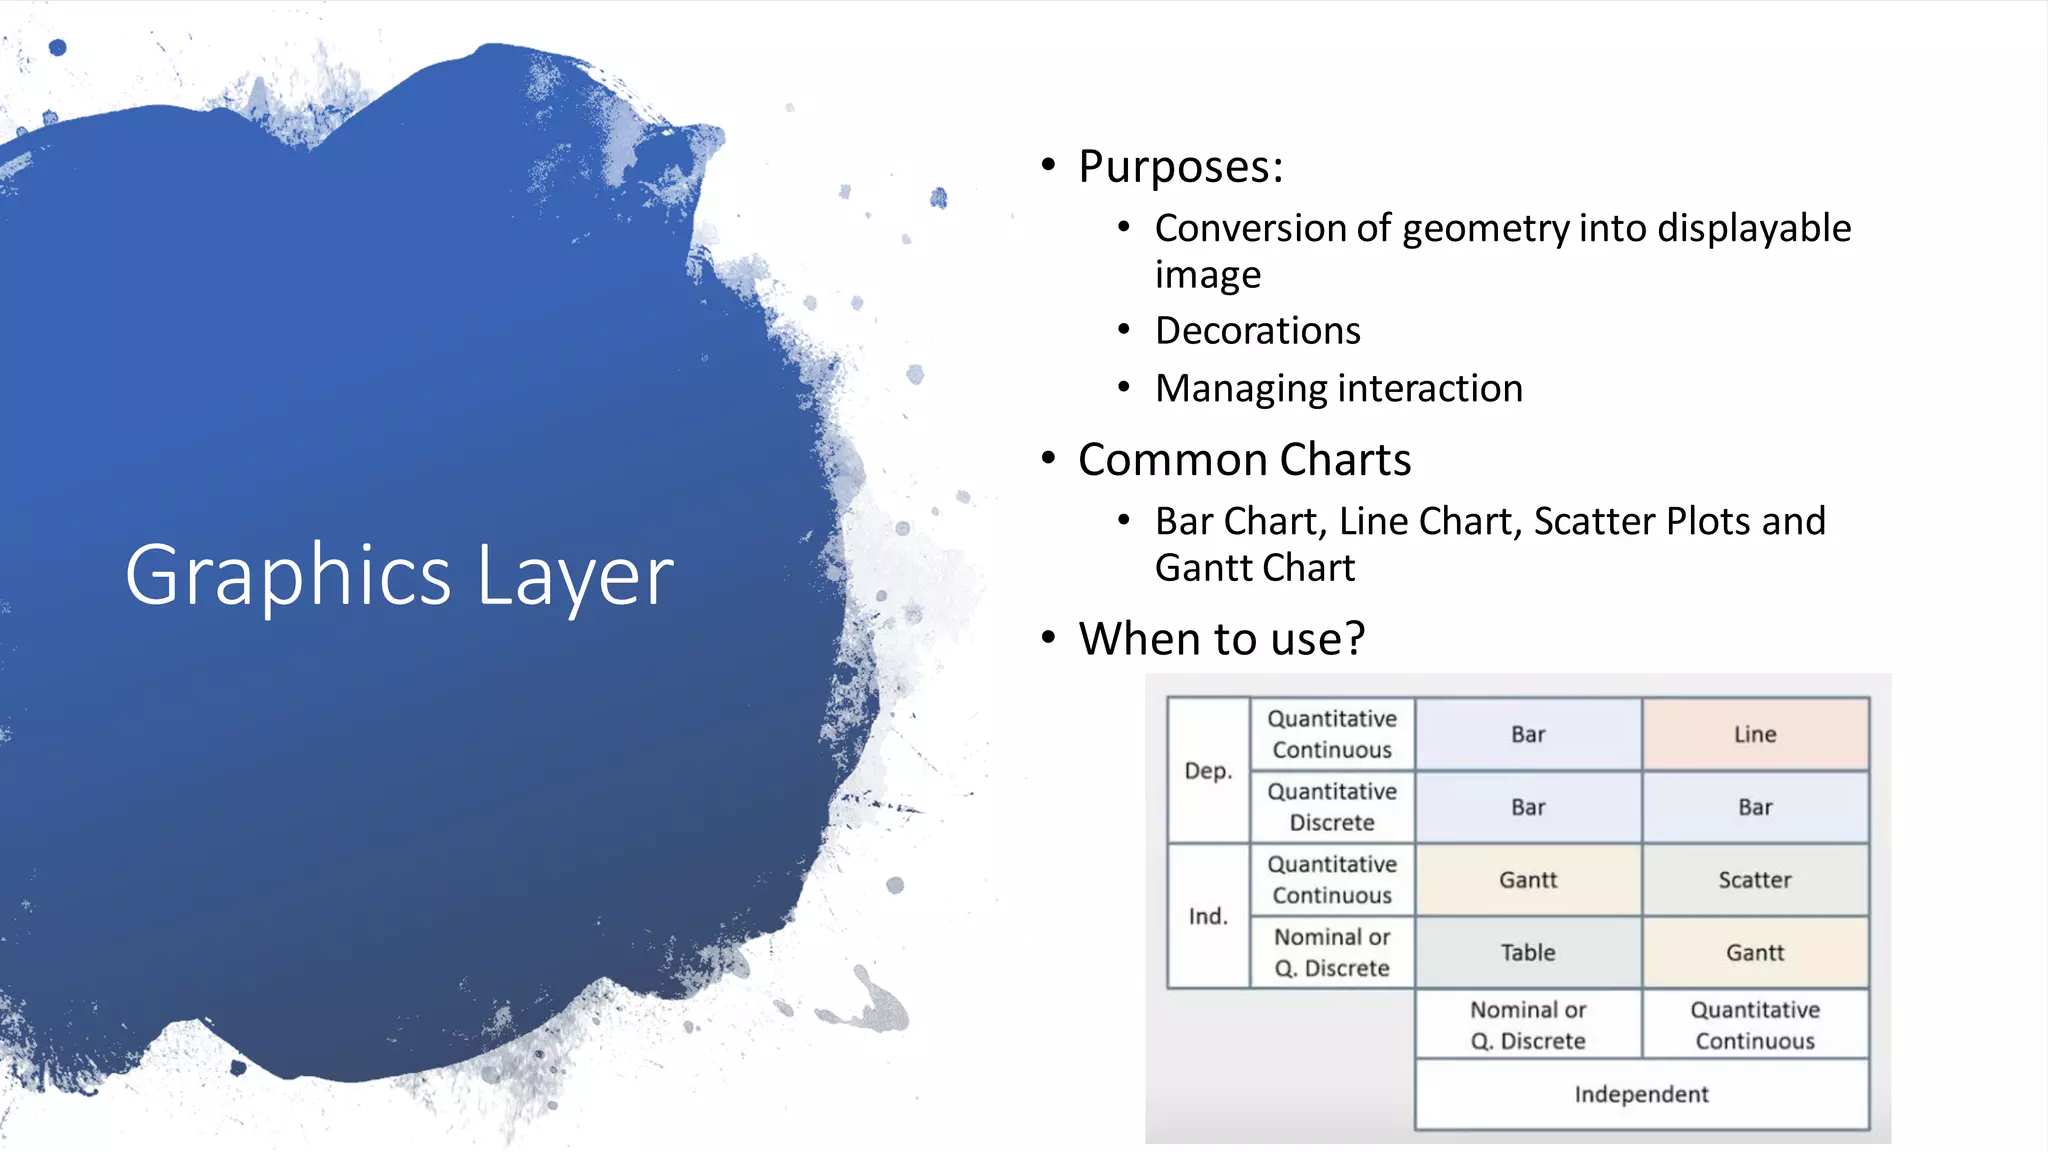
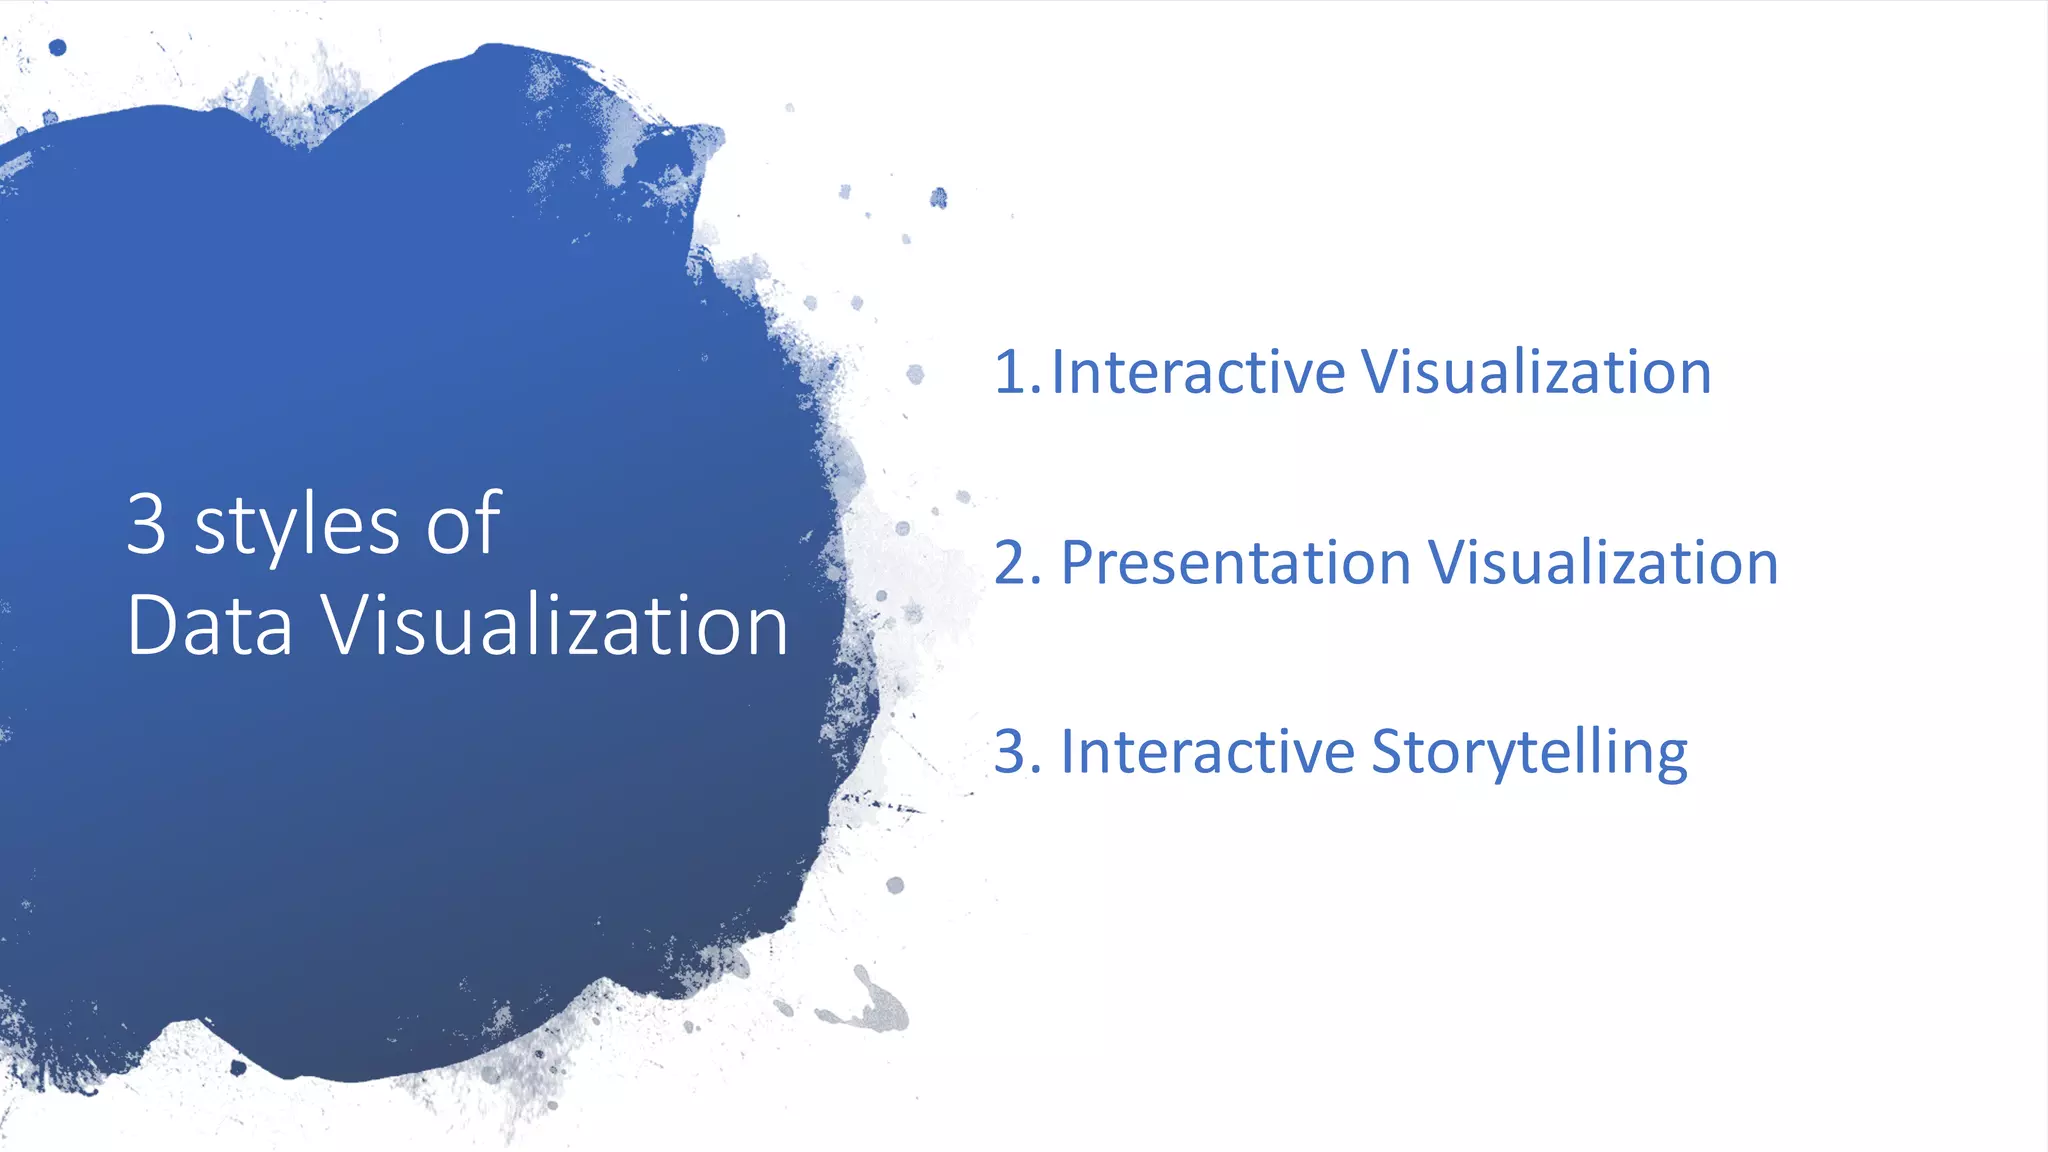
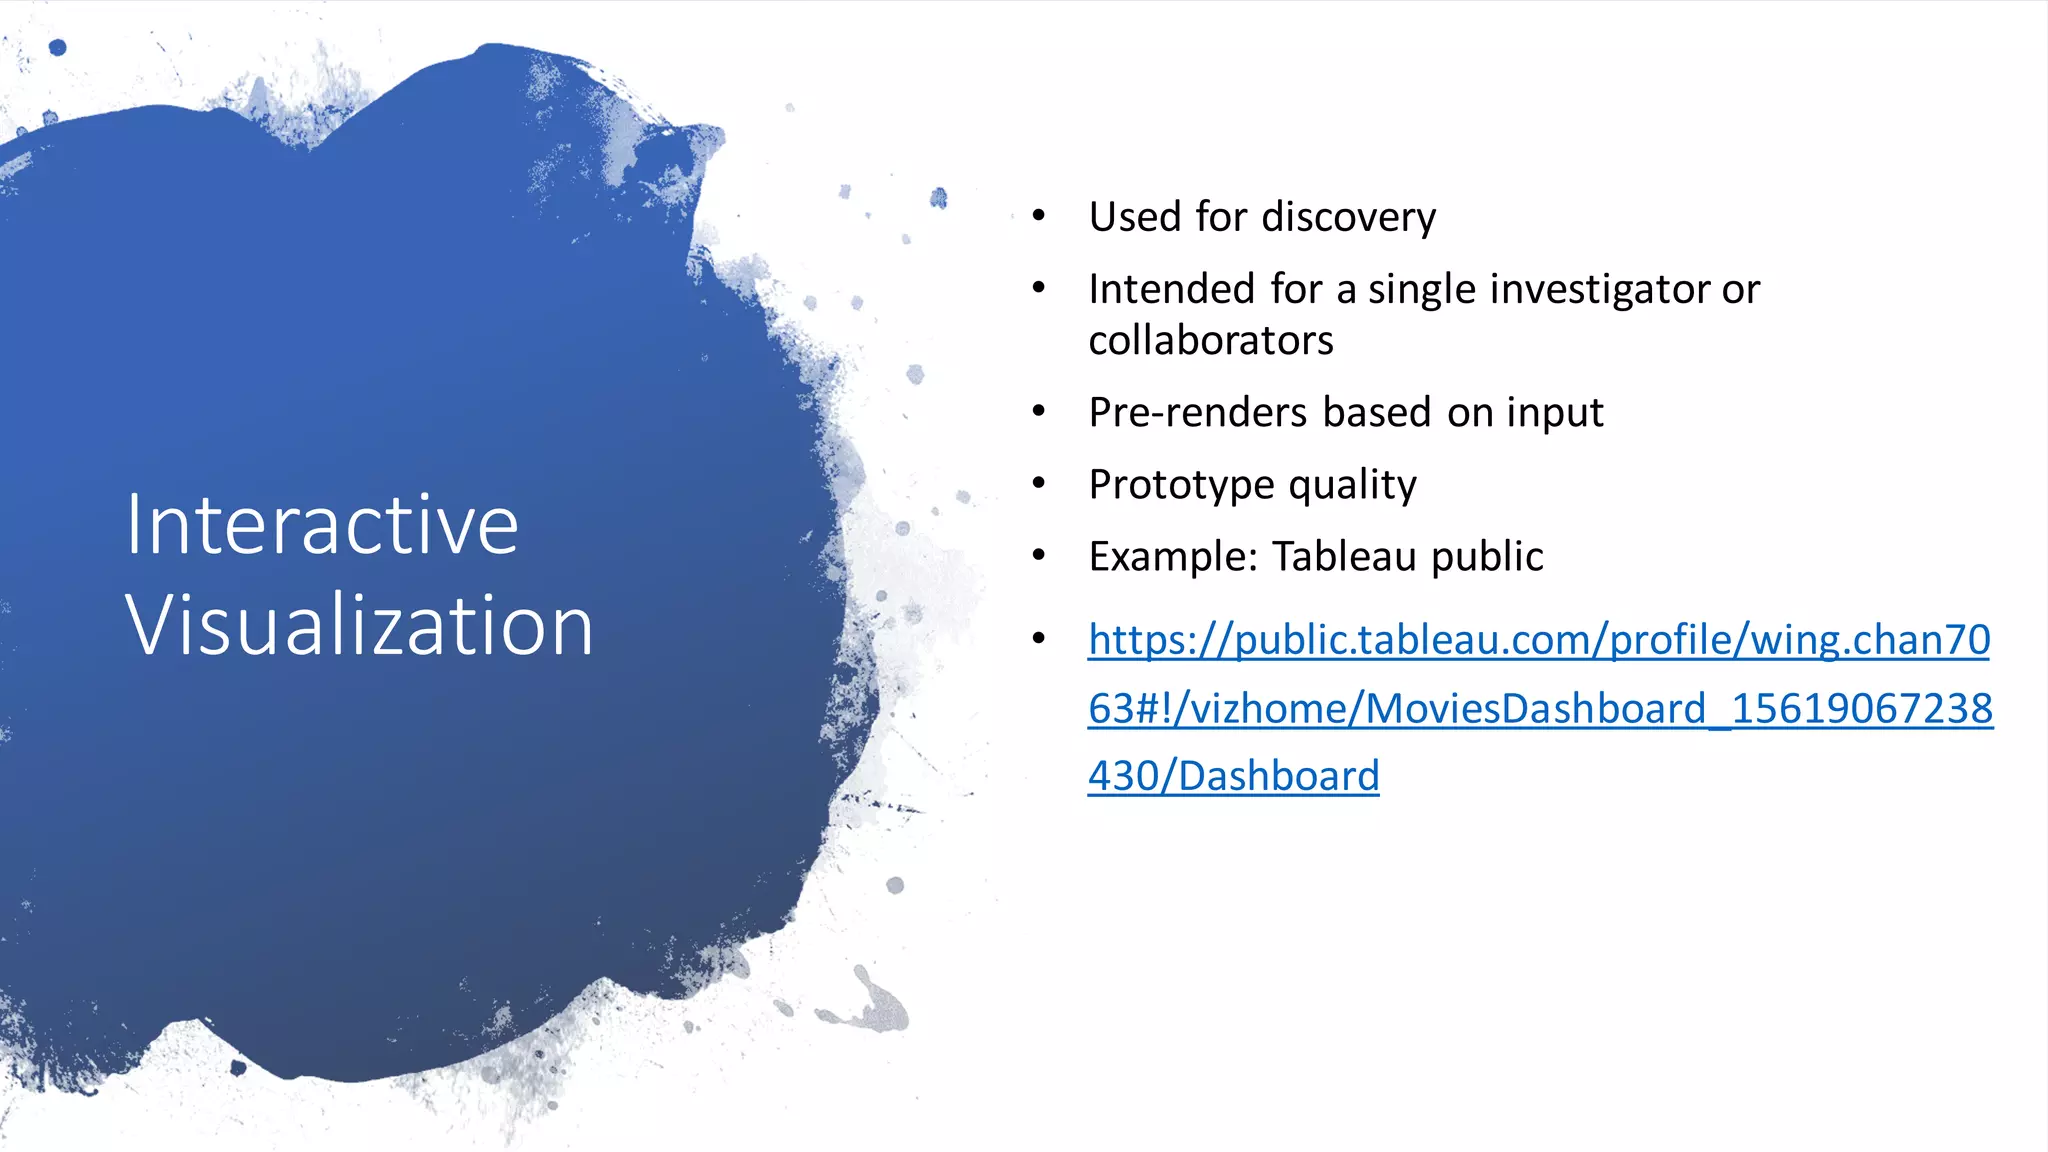
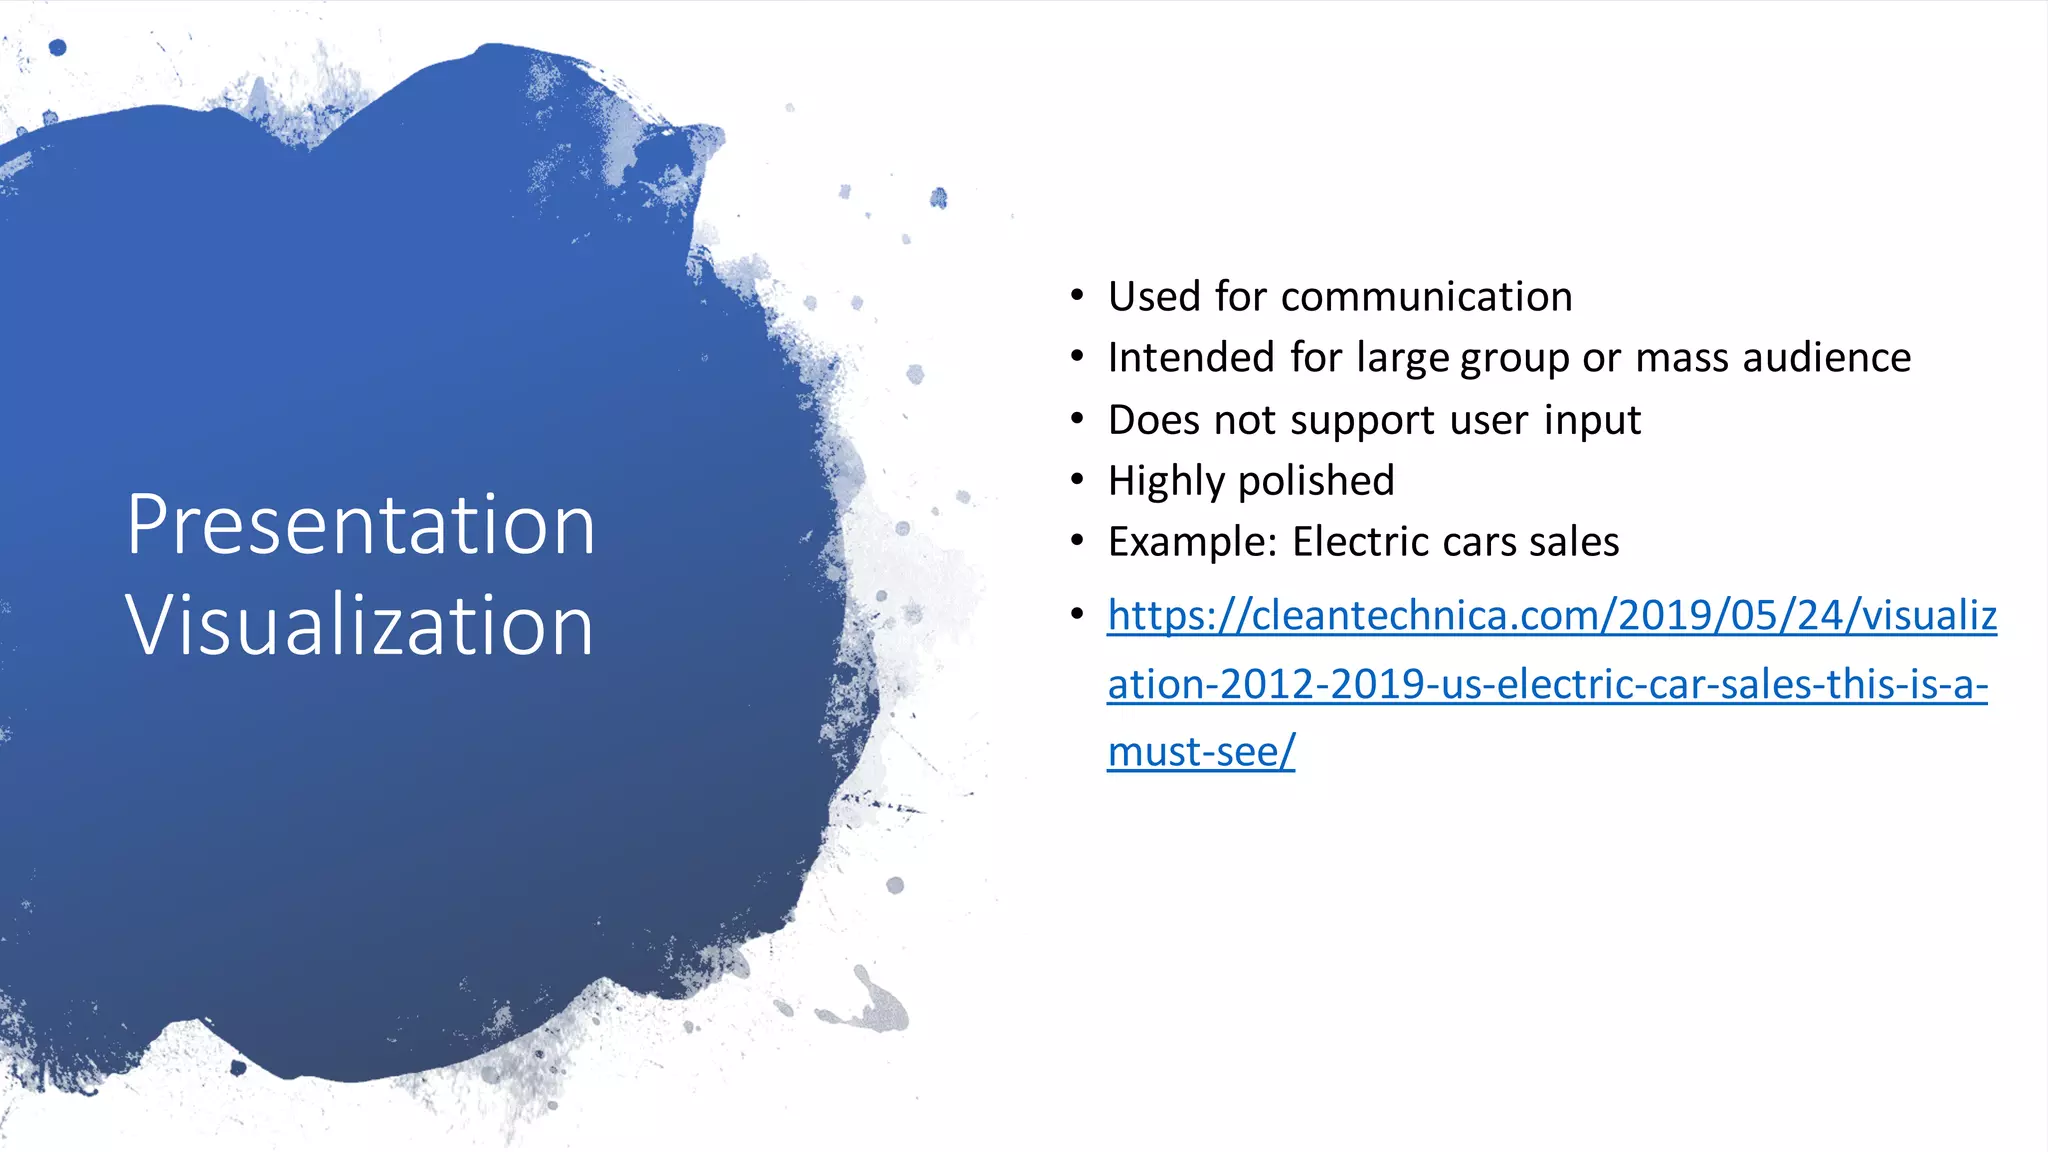
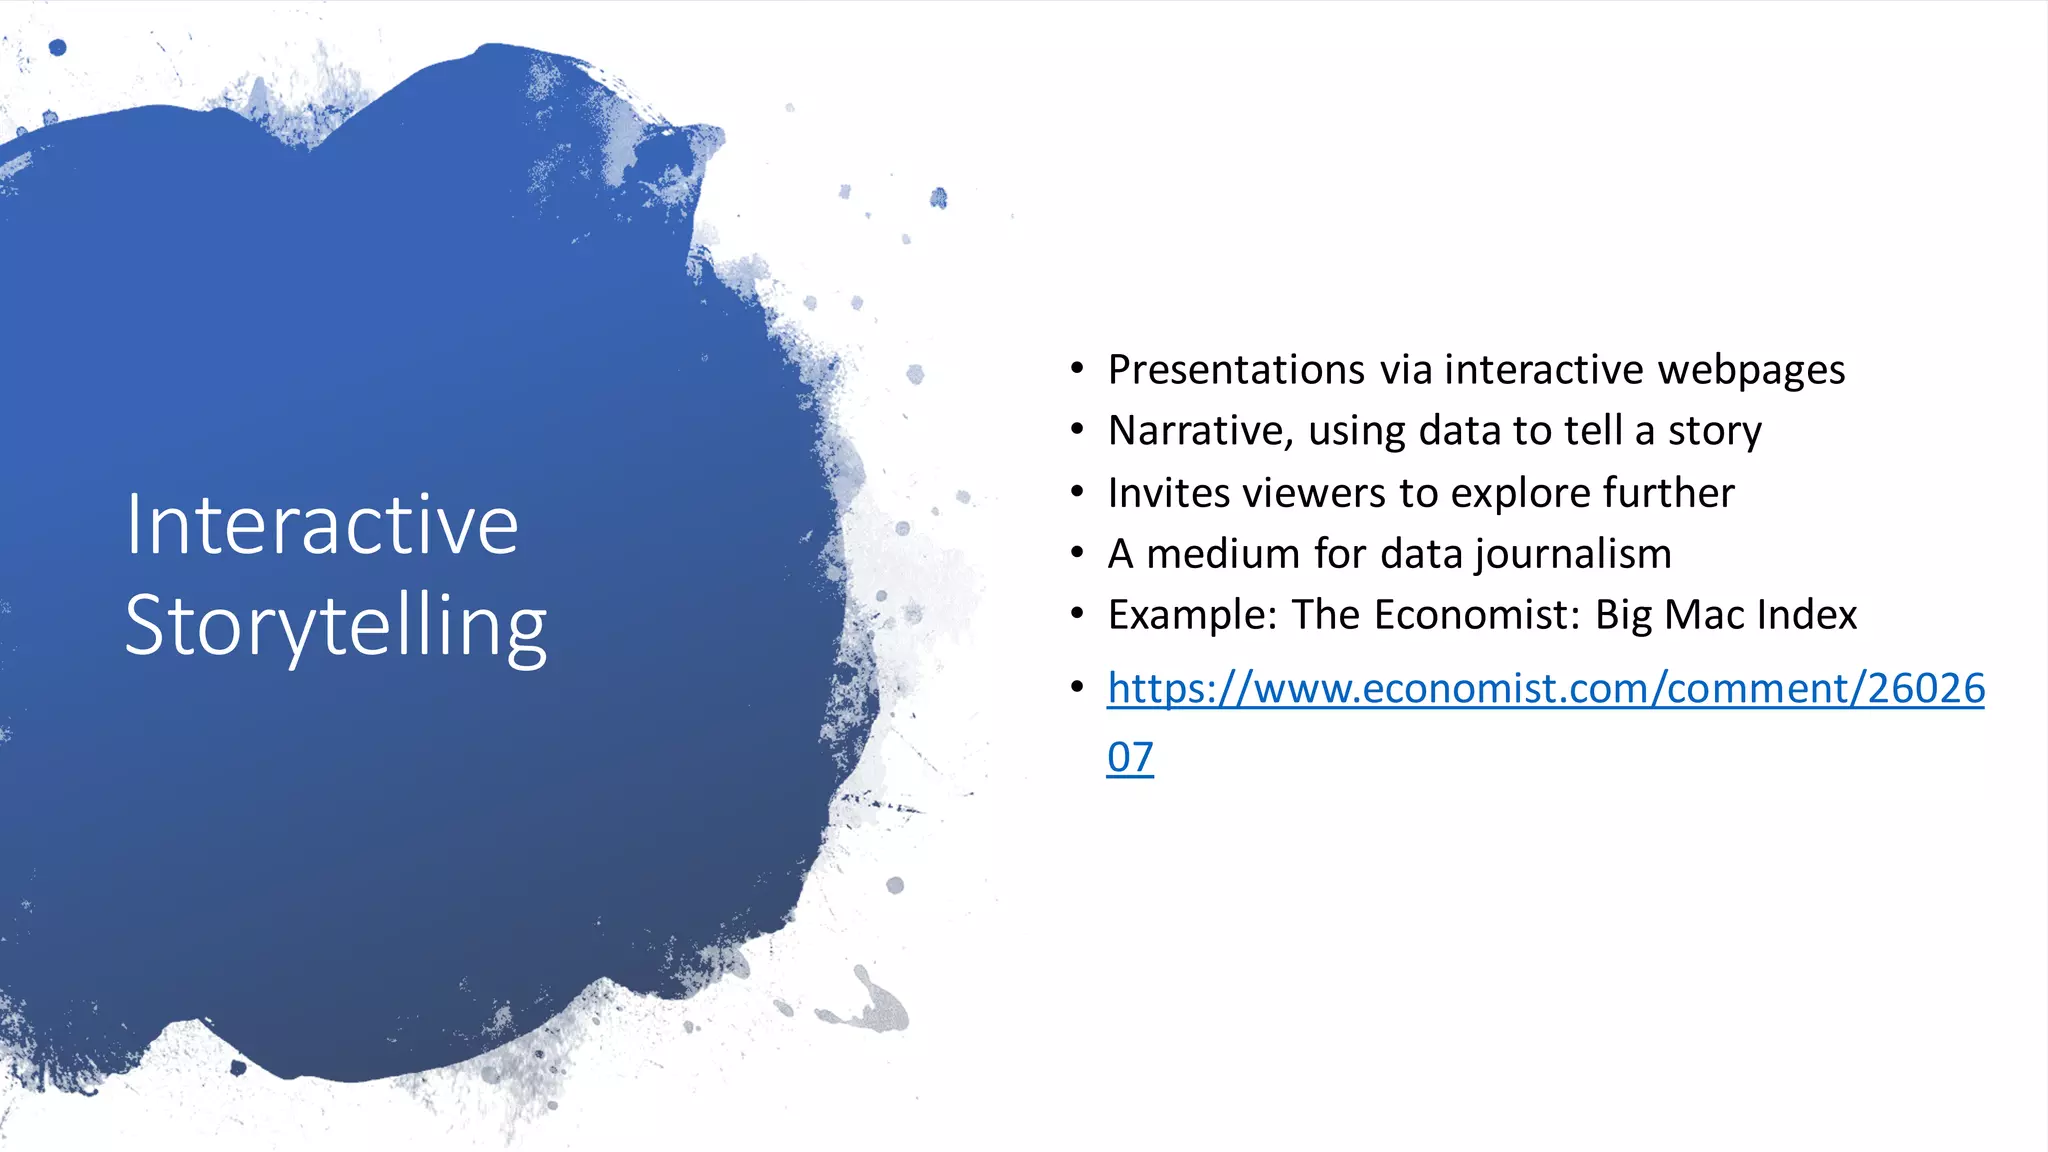
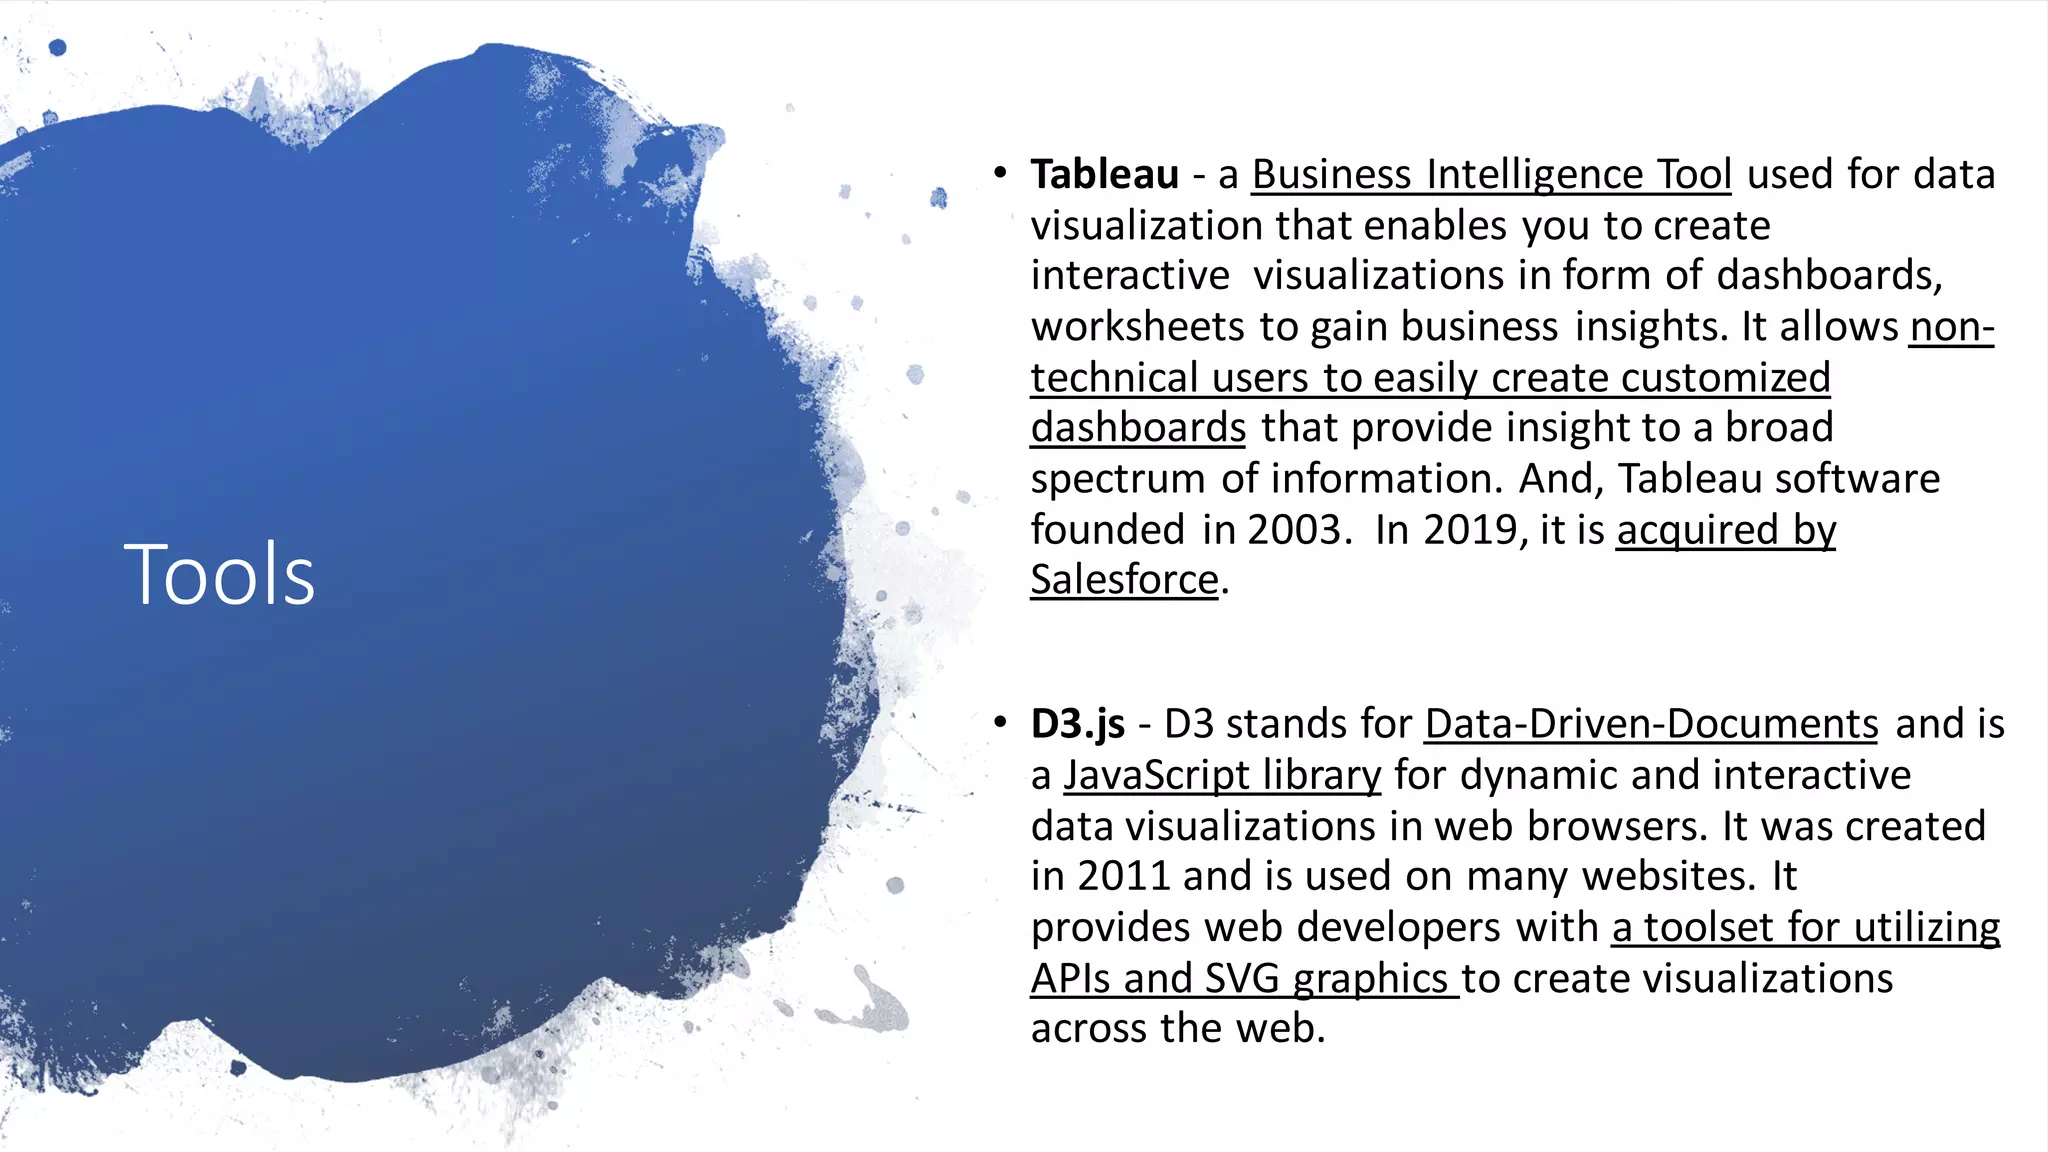
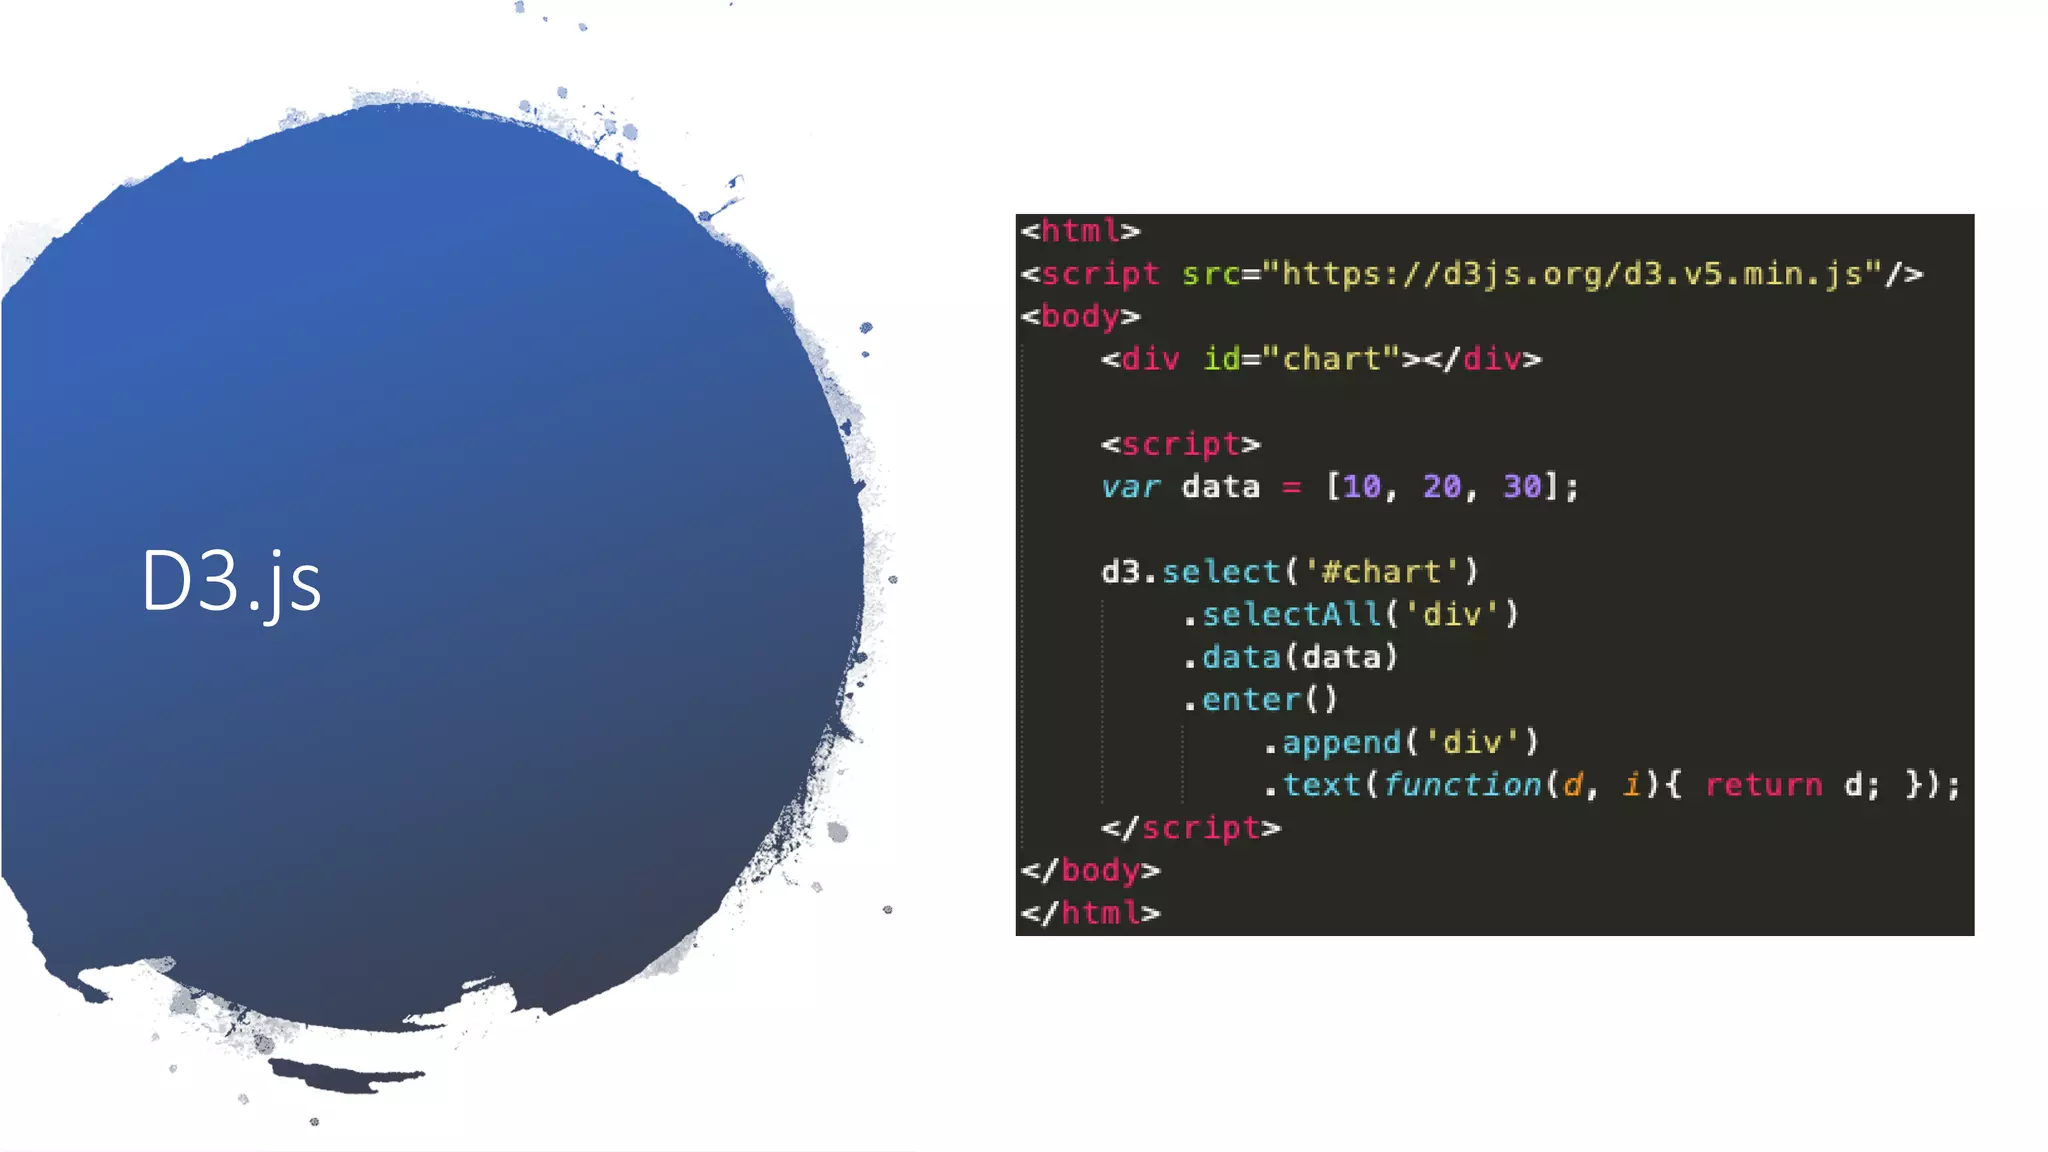
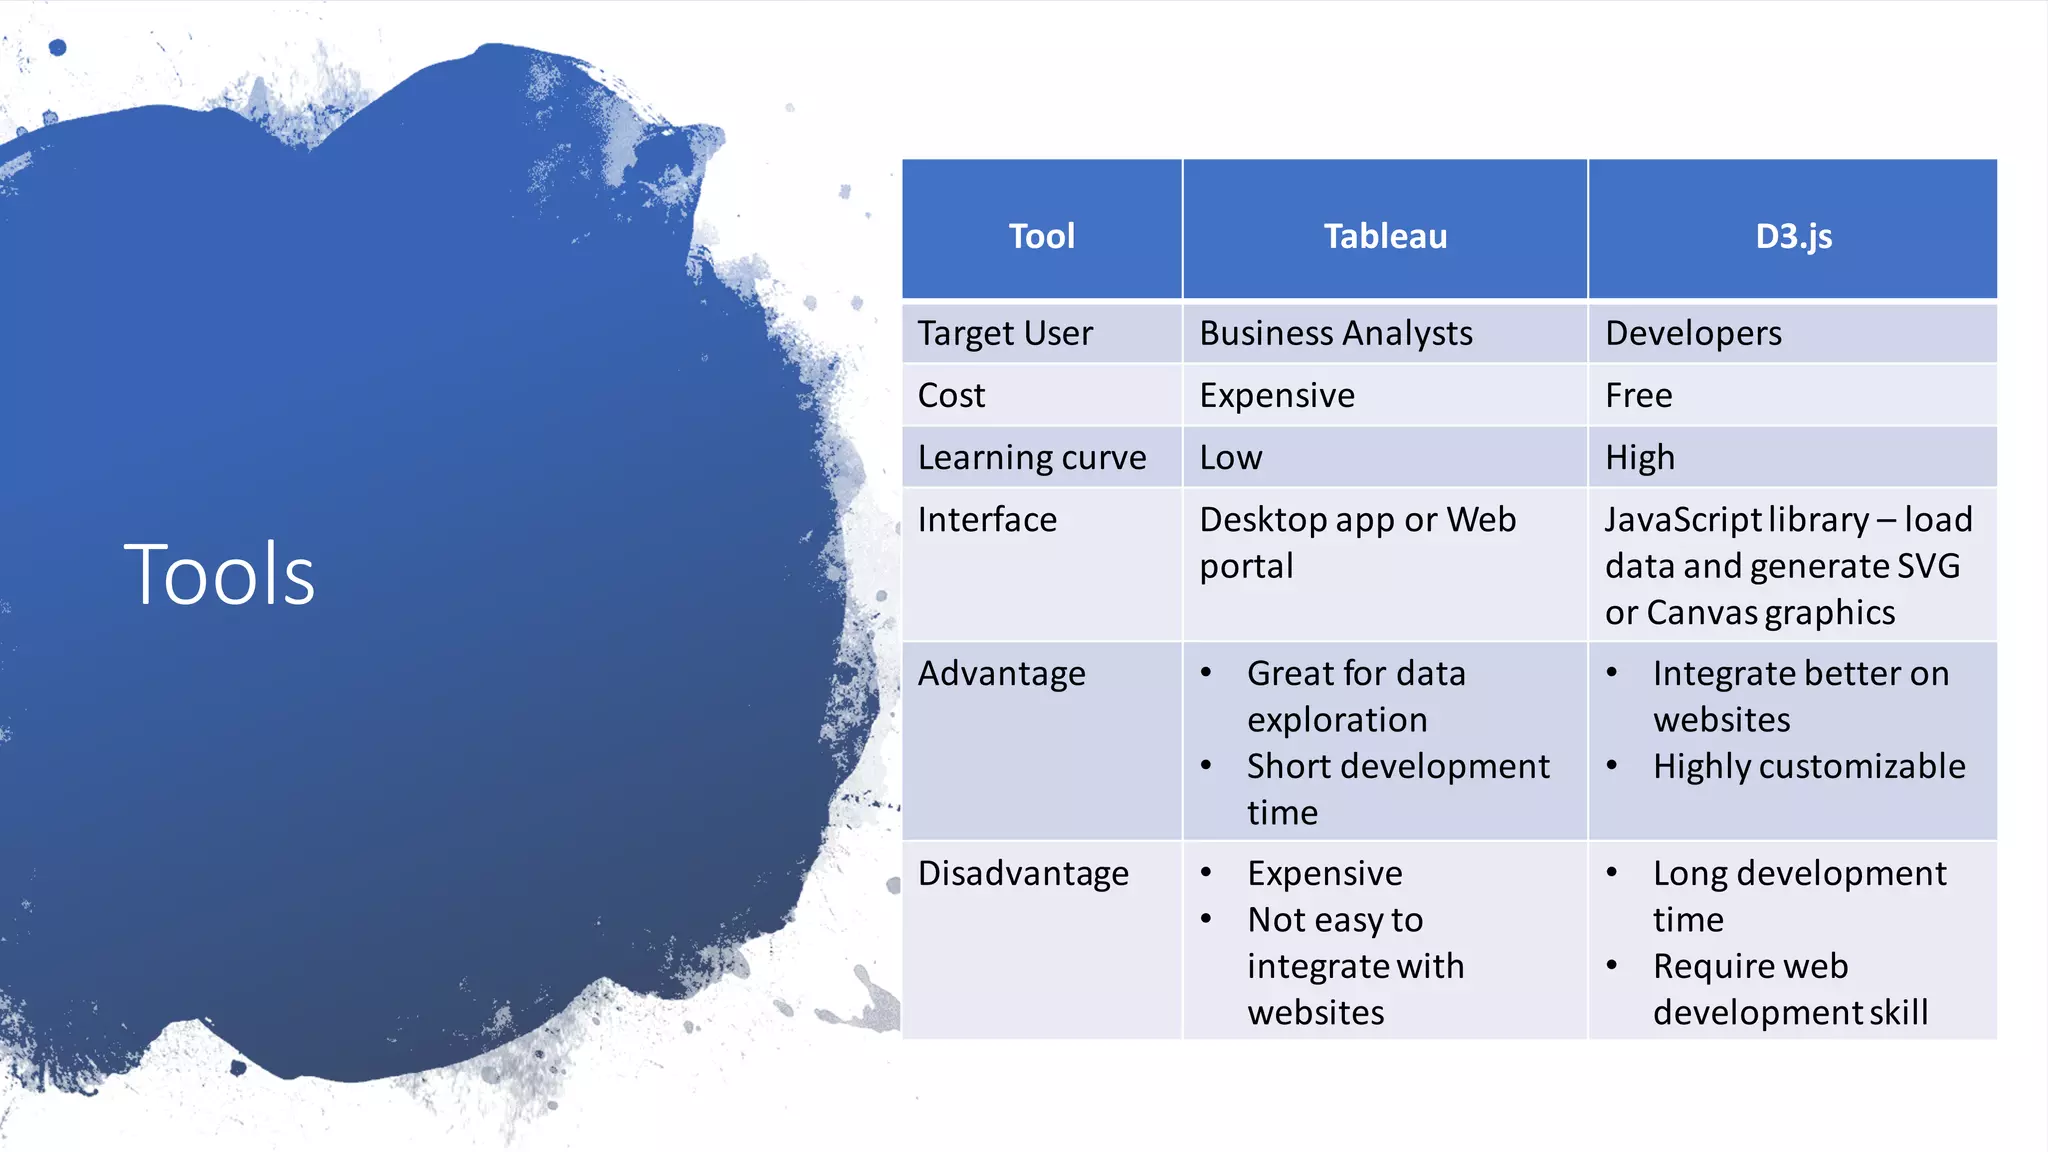
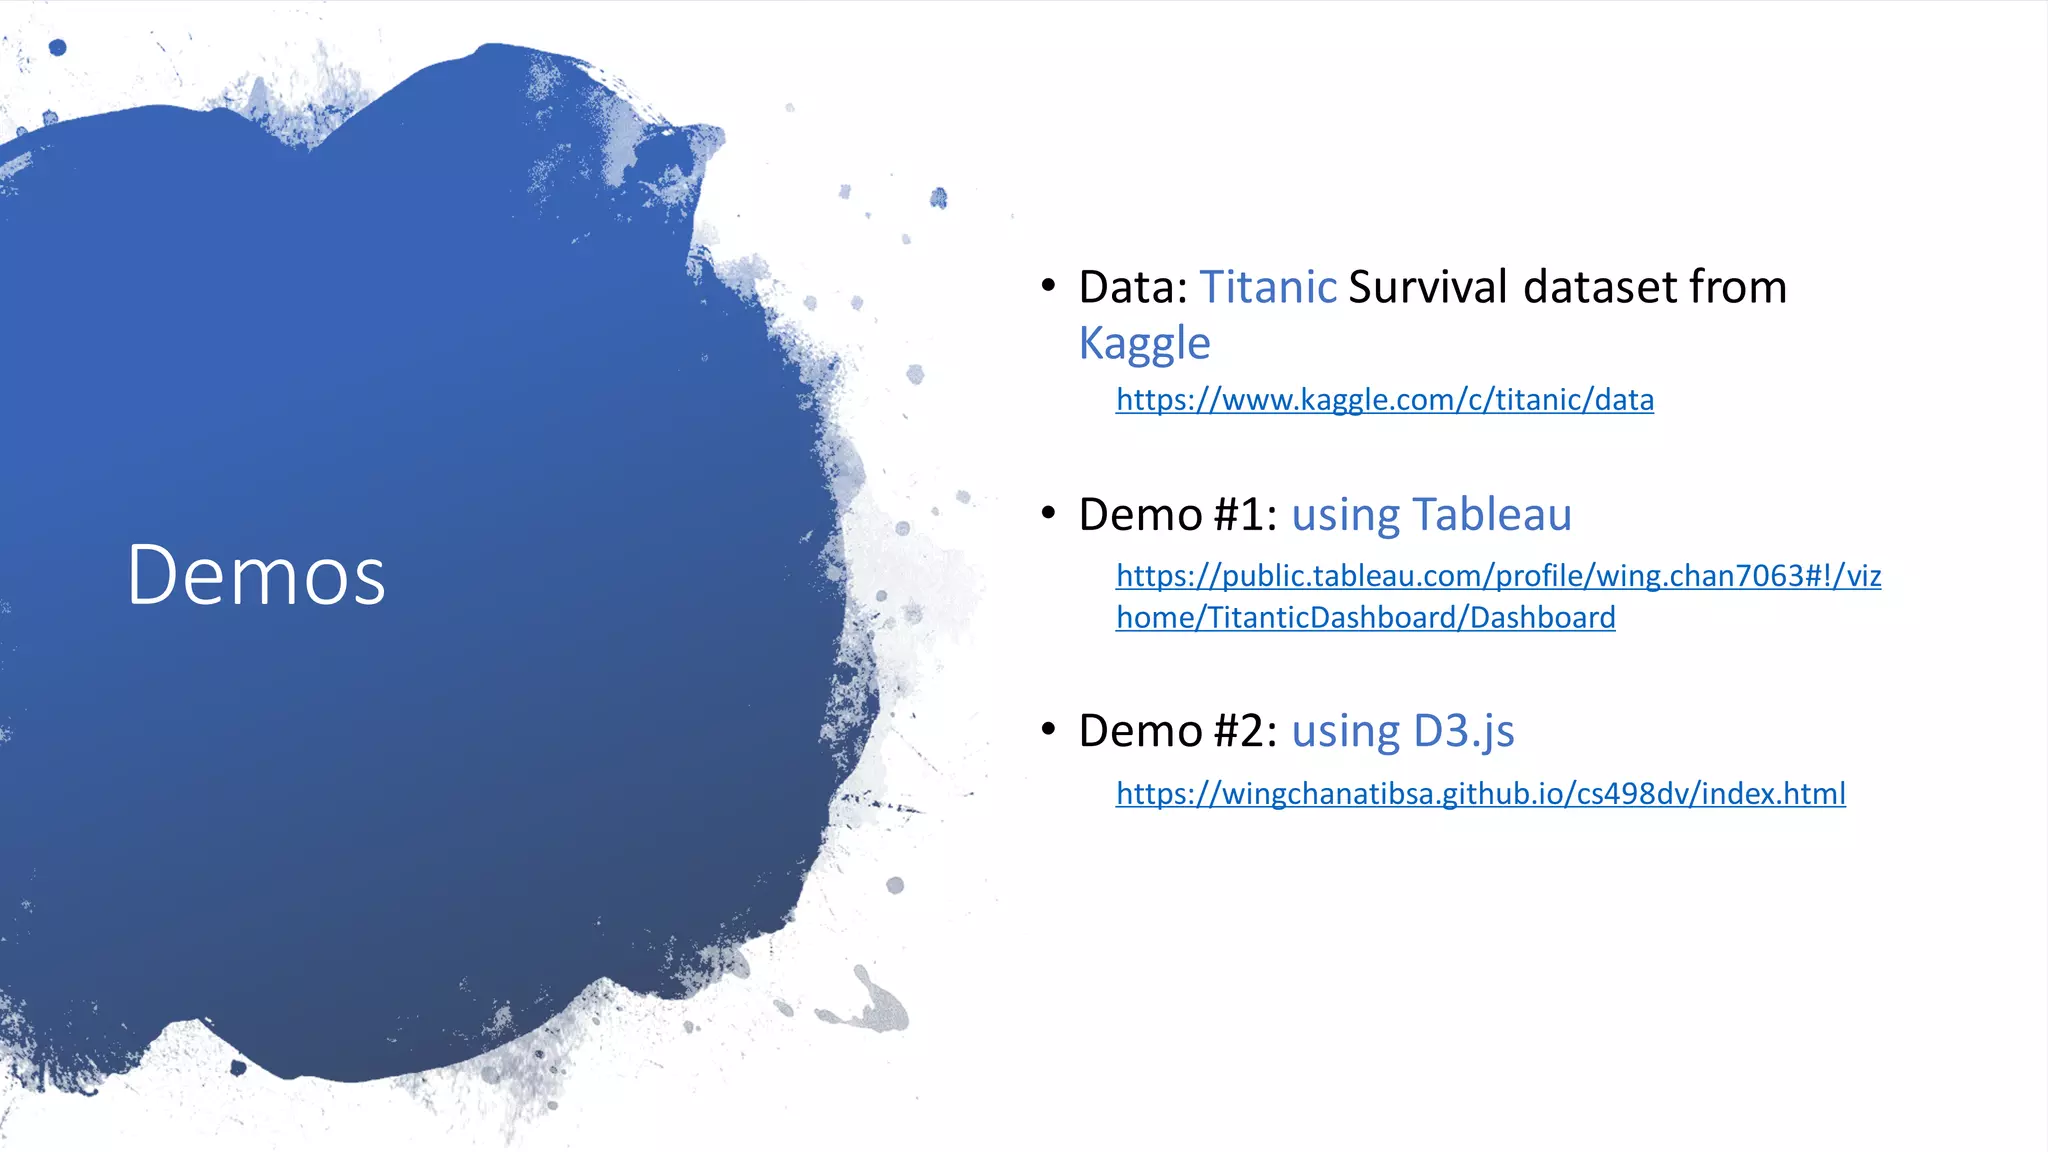
This is a presentation I gave on Data Visualization at a General Assembly event in Singapore, on January 22, 2016. The presso provides a brief history of dataviz as well as examples of common chart and visualization formatting mistakes that you should never make.
Data visualizations make huge amounts of data more accessible and understandable. Data visualization, or "data viz," is becoming largely important as the amount of data generated is increasing and big data tools are helping to create meaning behind all of that data.
This SlideShare presentation takes you through more details around data visualization and includes examples of some great data visualization pieces.
This slide deck gives a general overview of Data Visualization, with inspiring examples, the strength and weaknesses of the human visual system, a few technical frameworks that may be used for creating your own visualizations and some design concepts from the data visualization field.
A deep dive in data visualization covering some handful tools like Advance excel, Tableau, Qliksense etc.
You can add more content like discussing Google API, Perception and cognition theory,some more readable formats for data visualization and its framework.
Introduction on Data Visualization. Importance of Data Visualization. Data Representation Criteria. Groundwork for data visualization. Some Data Visualization tools to start with
Data visualization in data science: exploratory EDA, explanatory. Anscobe's quartet, design principles, visual encoding, design engineering and journalism, choosing the right graph, narrative structures, technology and tools.
North Raleigh Rotarian Katie Turnbull gave a great presentation at our Friday morning extension meeting about data visualization. Katie is a consultant at research and advisory firm, Gartner, Inc.
Data Visualization Design Best Practices WorkshopJSI
This introduction was presented as part of a workshop at the Measurement and Accountability for Results in Health Summit at the World Bank (June 2015). The workshop focused on simple ways anyone working with data can improve their presentations, and included visualization redesign activity to put these principles in practice.
Data visualization is an interdisciplinary field that deals with the graphic representation of data. It is a particularly efficient way of communicating when the data is numerous as for example a time series.
This presentation have the concept of Big data.
Why Big data is important to the present world.
How to visualize big data.
Steps for perfect visualization.
Visualization and design principle.
Also It had a number of visualization method for big data and traditional data.
Advantage of Visualization in Big Data
Best Practices for Killer Data VisualizationQualtrics
There’s something special about simple, powerful visualizations that tell a story. In fact, 65% of people are visual learners.
Join Qualtrics and Sasha Pasulka from Tableau as we illuminate the world of data visualization and give you clear takeaways to help you tell a better story with data. Getting executive buy-in or that seat at the table may come down to who can visualize data in a way that excites and enlightens the audience.
A Tableau course is an educational program or training that is designed to teach individuals how to use Tableau, a popular data visualization and business intelligence software.
For more information visit: https://datamites.com/tableau-certification-course-training-chennai/
A Tableau course is an educational program or training that is designed to teach individuals how to use Tableau, a popular data visualization and business intelligence software.
For more information visit: https://datamites.com/tableau-course-training-bangalore/
Best Tableau course in Chandigarh is provided by Cbitss in Chandigarh which is best institute in Chandigarh for Tableau course
Read more information about Tableau course visit :- https://www.cbitss.net/tableau-training-in-chandigarh/
This presentation was given to the Tech Change Technology for Monitoring and Evaluation Diploma course on 25th September 2015. It covers:
Why visualise data?
Where to start?
Which tools to use?
It ends with an overview of Kwantu's approach to this area and the technology choices that we've made.
CRM-UG Summit Phoenix 2018 - What is Common Data Model and how to use it?Nicolas Georgeault
My Slidedeck about Common Data Service and Model from CRMUG SUmmit in Phoenix Oct 2018. This technology is under development so content is subject to change and based on current service on 10/18/2018
My Slidedeck about Common Data Service and Model. This technology is under development so content is subject to change and based on current service on 4/13/2018
Data Visualization Trends - Next Steps for TableauArunima Gupta
Want answers to:
- What is data visualization?
- Why is it deemed disruptive in the field of analytics?
- What is Tableau?
Come view the slide deck!
Concludes with:
- Digital strategy recommendations for Tableau to become the winner in a winner-take-all-market
Data visualization is a technique that converts complex data into simple, crisp and strikingly interactive images that present the required information instead of long and boring texts. These visual objects include infographic, dials and gauges, geographic, maps, detailed bar, sparklines, heat maps, pie, fever charts etc.
A webinar on how Neo4j customers like Nasa, AirBnB, eBay, government agencies, investigative journalists and others are building Knowledge Graphs to inform today and tomorrow’s solutions.
UiPath Test Automation using UiPath Test Suite series, part 4DianaGray10
Welcome to UiPath Test Automation using UiPath Test Suite series part 4. In this session, we will cover Test Manager overview along with SAP heatmap.
The UiPath Test Manager overview with SAP heatmap webinar offers a concise yet comprehensive exploration of the role of a Test Manager within SAP environments, coupled with the utilization of heatmaps for effective testing strategies.
Participants will gain insights into the responsibilities, challenges, and best practices associated with test management in SAP projects. Additionally, the webinar delves into the significance of heatmaps as a visual aid for identifying testing priorities, areas of risk, and resource allocation within SAP landscapes. Through this session, attendees can expect to enhance their understanding of test management principles while learning practical approaches to optimize testing processes in SAP environments using heatmap visualization techniques
What will you get from this session?
1. Insights into SAP testing best practices
2. Heatmap utilization for testing
3. Optimization of testing processes
4. Demo
Topics covered:
Execution from the test manager
Orchestrator execution result
Defect reporting
SAP heatmap example with demo
Speaker:
Deepak Rai, Automation Practice Lead, Boundaryless Group and UiPath MVP
Accelerate your Kubernetes clusters with Varnish CachingThijs Feryn
A presentation about the usage and availability of Varnish on Kubernetes. This talk explores the capabilities of Varnish caching and shows how to use the Varnish Helm chart to deploy it to Kubernetes.
This presentation was delivered at K8SUG Singapore. See https://feryn.eu/presentations/accelerate-your-kubernetes-clusters-with-varnish-caching-k8sug-singapore-28-2024 for more details.
Smart TV Buyer Insights Survey 2024 by 91mobiles.pdf91mobiles
91mobiles recently conducted a Smart TV Buyer Insights Survey in which we asked over 3,000 respondents about the TV they own, aspects they look at on a new TV, and their TV buying preferences.
Software Delivery At the Speed of AI: Inflectra Invests In AI-Powered QualityInflectra
In this insightful webinar, Inflectra explores how artificial intelligence (AI) is transforming software development and testing. Discover how AI-powered tools are revolutionizing every stage of the software development lifecycle (SDLC), from design and prototyping to testing, deployment, and monitoring.
Learn about:
• The Future of Testing: How AI is shifting testing towards verification, analysis, and higher-level skills, while reducing repetitive tasks.
• Test Automation: How AI-powered test case generation, optimization, and self-healing tests are making testing more efficient and effective.
• Visual Testing: Explore the emerging capabilities of AI in visual testing and how it's set to revolutionize UI verification.
• Inflectra's AI Solutions: See demonstrations of Inflectra's cutting-edge AI tools like the ChatGPT plugin and Azure Open AI platform, designed to streamline your testing process.
Whether you're a developer, tester, or QA professional, this webinar will give you valuable insights into how AI is shaping the future of software delivery.
Connector Corner: Automate dynamic content and events by pushing a buttonDianaGray10
Here is something new! In our next Connector Corner webinar, we will demonstrate how you can use a single workflow to:
Create a campaign using Mailchimp with merge tags/fields
Send an interactive Slack channel message (using buttons)
Have the message received by managers and peers along with a test email for review
But there’s more:
In a second workflow supporting the same use case, you’ll see:
Your campaign sent to target colleagues for approval
If the “Approve” button is clicked, a Jira/Zendesk ticket is created for the marketing design team
But—if the “Reject” button is pushed, colleagues will be alerted via Slack message
Join us to learn more about this new, human-in-the-loop capability, brought to you by Integration Service connectors.
And...
Speakers:
Akshay Agnihotri, Product Manager
Charlie Greenberg, Host
DevOps and Testing slides at DASA ConnectKari Kakkonen
My and Rik Marselis slides at 30.5.2024 DASA Connect conference. We discuss about what is testing, then what is agile testing and finally what is Testing in DevOps. Finally we had lovely workshop with the participants trying to find out different ways to think about quality and testing in different parts of the DevOps infinity loop.
LF Energy Webinar: Electrical Grid Modelling and Simulation Through PowSyBl -...DanBrown980551
Do you want to learn how to model and simulate an electrical network from scratch in under an hour?
Then welcome to this PowSyBl workshop, hosted by Rte, the French Transmission System Operator (TSO)!
During the webinar, you will discover the PowSyBl ecosystem as well as handle and study an electrical network through an interactive Python notebook.
PowSyBl is an open source project hosted by LF Energy, which offers a comprehensive set of features for electrical grid modelling and simulation. Among other advanced features, PowSyBl provides:
- A fully editable and extendable library for grid component modelling;
- Visualization tools to display your network;
- Grid simulation tools, such as power flows, security analyses (with or without remedial actions) and sensitivity analyses;
The framework is mostly written in Java, with a Python binding so that Python developers can access PowSyBl functionalities as well.
What you will learn during the webinar:
- For beginners: discover PowSyBl's functionalities through a quick general presentation and the notebook, without needing any expert coding skills;
- For advanced developers: master the skills to efficiently apply PowSyBl functionalities to your real-world scenarios.
GDG Cloud Southlake #33: Boule & Rebala: Effective AppSec in SDLC using Deplo...James Anderson
Effective Application Security in Software Delivery lifecycle using Deployment Firewall and DBOM
The modern software delivery process (or the CI/CD process) includes many tools, distributed teams, open-source code, and cloud platforms. Constant focus on speed to release software to market, along with the traditional slow and manual security checks has caused gaps in continuous security as an important piece in the software supply chain. Today organizations feel more susceptible to external and internal cyber threats due to the vast attack surface in their applications supply chain and the lack of end-to-end governance and risk management.
The software team must secure its software delivery process to avoid vulnerability and security breaches. This needs to be achieved with existing tool chains and without extensive rework of the delivery processes. This talk will present strategies and techniques for providing visibility into the true risk of the existing vulnerabilities, preventing the introduction of security issues in the software, resolving vulnerabilities in production environments quickly, and capturing the deployment bill of materials (DBOM).
Speakers:
Bob Boule
Robert Boule is a technology enthusiast with PASSION for technology and making things work along with a knack for helping others understand how things work. He comes with around 20 years of solution engineering experience in application security, software continuous delivery, and SaaS platforms. He is known for his dynamic presentations in CI/CD and application security integrated in software delivery lifecycle.
Gopinath Rebala
Gopinath Rebala is the CTO of OpsMx, where he has overall responsibility for the machine learning and data processing architectures for Secure Software Delivery. Gopi also has a strong connection with our customers, leading design and architecture for strategic implementations. Gopi is a frequent speaker and well-known leader in continuous delivery and integrating security into software delivery.
JMeter webinar - integration with InfluxDB and GrafanaRTTS
Watch this recorded webinar about real-time monitoring of application performance. See how to integrate Apache JMeter, the open-source leader in performance testing, with InfluxDB, the open-source time-series database, and Grafana, the open-source analytics and visualization application.
In this webinar, we will review the benefits of leveraging InfluxDB and Grafana when executing load tests and demonstrate how these tools are used to visualize performance metrics.
Length: 30 minutes
Session Overview
-------------------------------------------
During this webinar, we will cover the following topics while demonstrating the integrations of JMeter, InfluxDB and Grafana:
- What out-of-the-box solutions are available for real-time monitoring JMeter tests?
- What are the benefits of integrating InfluxDB and Grafana into the load testing stack?
- Which features are provided by Grafana?
- Demonstration of InfluxDB and Grafana using a practice web application
To view the webinar recording, go to:
https://www.rttsweb.com/jmeter-integration-webinar
Securing your Kubernetes cluster_ a step-by-step guide to success !KatiaHIMEUR1
Today, after several years of existence, an extremely active community and an ultra-dynamic ecosystem, Kubernetes has established itself as the de facto standard in container orchestration. Thanks to a wide range of managed services, it has never been so easy to set up a ready-to-use Kubernetes cluster.
However, this ease of use means that the subject of security in Kubernetes is often left for later, or even neglected. This exposes companies to significant risks.
In this talk, I'll show you step-by-step how to secure your Kubernetes cluster for greater peace of mind and reliability.
GraphRAG is All You need? LLM & Knowledge GraphGuy Korland
Guy Korland, CEO and Co-founder of FalkorDB, will review two articles on the integration of language models with knowledge graphs.
1. Unifying Large Language Models and Knowledge Graphs: A Roadmap.
https://arxiv.org/abs/2306.08302
2. Microsoft Research's GraphRAG paper and a review paper on various uses of knowledge graphs:
https://www.microsoft.com/en-us/research/blog/graphrag-unlocking-llm-discovery-on-narrative-private-data/
Dev Dives: Train smarter, not harder – active learning and UiPath LLMs for do...UiPathCommunity
💥 Speed, accuracy, and scaling – discover the superpowers of GenAI in action with UiPath Document Understanding and Communications Mining™:
See how to accelerate model training and optimize model performance with active learning
Learn about the latest enhancements to out-of-the-box document processing – with little to no training required
Get an exclusive demo of the new family of UiPath LLMs – GenAI models specialized for processing different types of documents and messages
This is a hands-on session specifically designed for automation developers and AI enthusiasts seeking to enhance their knowledge in leveraging the latest intelligent document processing capabilities offered by UiPath.
Speakers:
👨🏫 Andras Palfi, Senior Product Manager, UiPath
👩🏫 Lenka Dulovicova, Product Program Manager, UiPath
2. Agenda
• What is Data Visualization?
• Data Visualization Framework
• 3 styles of Data Visualization
• Tools (Tableau vs D3.js)
• Demos
3. What is Data
Visualization?
Data visualizationis the graphicalrepresentationof information and data. By
using visual elements like charts, graphs, and maps, data visualizationtools
provide an accessible way to see and understandtrends, outliers, and patterns
in data.
In the world of Big Data, datavisualization toolsand technologiesare essential
to analyze massive amounts of information and make data-drivendecisions.
5. Data Layer
• Purposes:
• Locating and obtaining data
• Importing data in proper format
• Relating data for proper correspondence
• Dataanalysis and aggregation
• Data Types
• Discrete vs Continuous
• Ordered vs Unordered
6. Mapping Layer
• Purposes
• Associating appropriate geometry with
corresponding data channels
• Dataanalysis and algorithms
• Perceptual Accuracy
7. Graphics Layer
• Purposes:
• Conversion of geometry into displayable
image
• Decorations
• Managing interaction
• Common Charts
• Bar Chart, Line Chart, Scatter Plots and
Gantt Chart
• When to use?
8. 3 styles of
Data Visualization
1.Interactive Visualization
2. Presentation Visualization
3. Interactive Storytelling
9. Interactive
Visualization
• Used for discovery
• Intended for a single investigator or
collaborators
• Pre-renders based on input
• Prototype quality
• Example: Tableau public
• https://public.tableau.com/profile/wing.chan70
63#!/vizhome/MoviesDashboard_15619067238
430/Dashboard
10. Presentation
Visualization
• Used for communication
• Intended for large group or mass audience
• Does not support user input
• Highly polished
• Example: Electric cars sales
• https://cleantechnica.com/2019/05/24/visualiz
ation-2012-2019-us-electric-car-sales-this-is-a-
must-see/
11. Interactive
Storytelling
• Presentations via interactive webpages
• Narrative, using data to tell a story
• Invites viewers to explore further
• A medium for data journalism
• Example: The Economist: Big Mac Index
• https://www.economist.com/comment/26026
07
12. Tools
• Tableau - a Business Intelligence Tool used for data
visualization that enables you to create
interactive visualizations in form of dashboards,
worksheets to gain business insights. It allows non-
technical users to easily create customized
dashboards that provide insight to a broad
spectrum of information. And, Tableau software
founded in 2003. In 2019, it is acquired by
Salesforce.
• D3.js - D3 stands for Data-Driven-Documents and is
a JavaScript library for dynamic and interactive
data visualizations in web browsers. It was created
in 2011 and is used on many websites. It
provides web developers with a toolset for utilizing
APIs and SVG graphics to create visualizations
across the web.
14. Tools
Tool Tableau D3.js
Target User Business Analysts Developers
Cost Expensive Free
Learning curve Low High
Interface Desktop app or Web
portal
JavaScriptlibrary – load
data and generate SVG
or Canvasgraphics
Advantage • Great for data
exploration
• Short development
time
• Integrate better on
websites
• Highly customizable
Disadvantage • Expensive
• Not easy to
integratewith
websites
• Long development
time
• Require web
developmentskill
15. Demos
• Data: Titanic Survival dataset from
Kaggle
https://www.kaggle.com/c/titanic/data
• Demo #1: using Tableau
https://public.tableau.com/profile/wing.chan7063#!/viz
home/TitanticDashboard/Dashboard
• Demo #2: using D3.js
https://wingchanatibsa.github.io/cs498dv/index.html