Download as PDF, PPTX
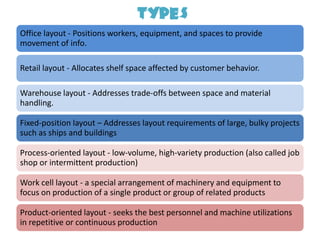
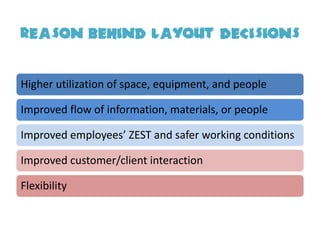
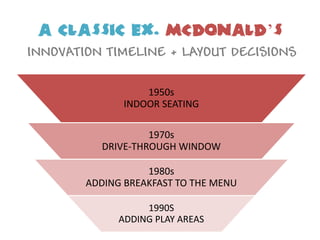
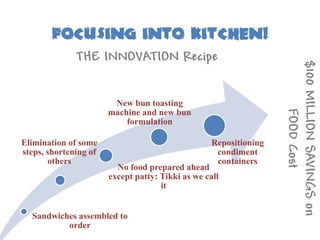
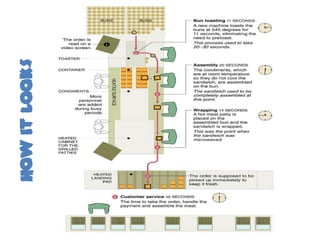
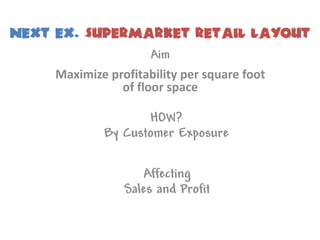
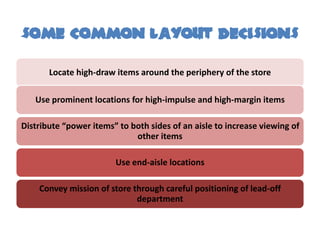
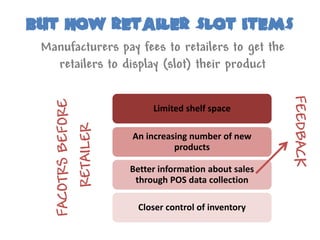
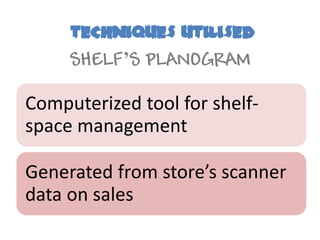
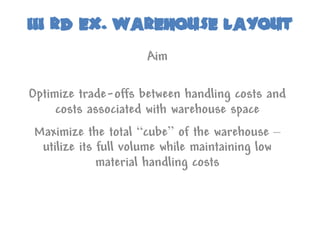

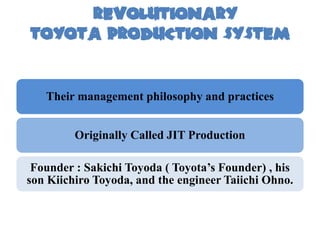
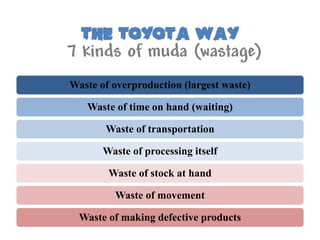
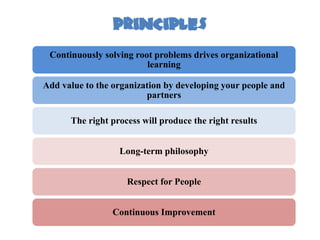
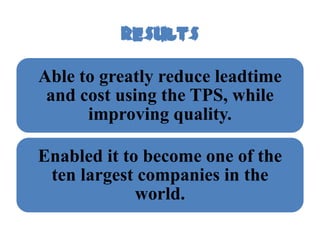
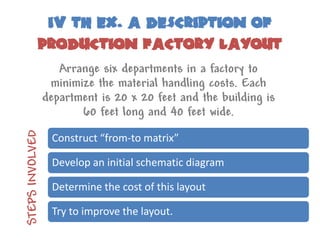

The document discusses various layout strategies in operations management, including office, retail, warehouse, fixed-position, process-oriented, work cell, and product-oriented layouts, each tailored to specific production needs and enhancing efficiency. It highlights examples such as McDonald's and Toyota's production system, illustrating their impact on cost reduction and quality improvement. Additionally, it covers the importance of layout decisions in optimizing space, material handling, and overall profitability in different contexts.