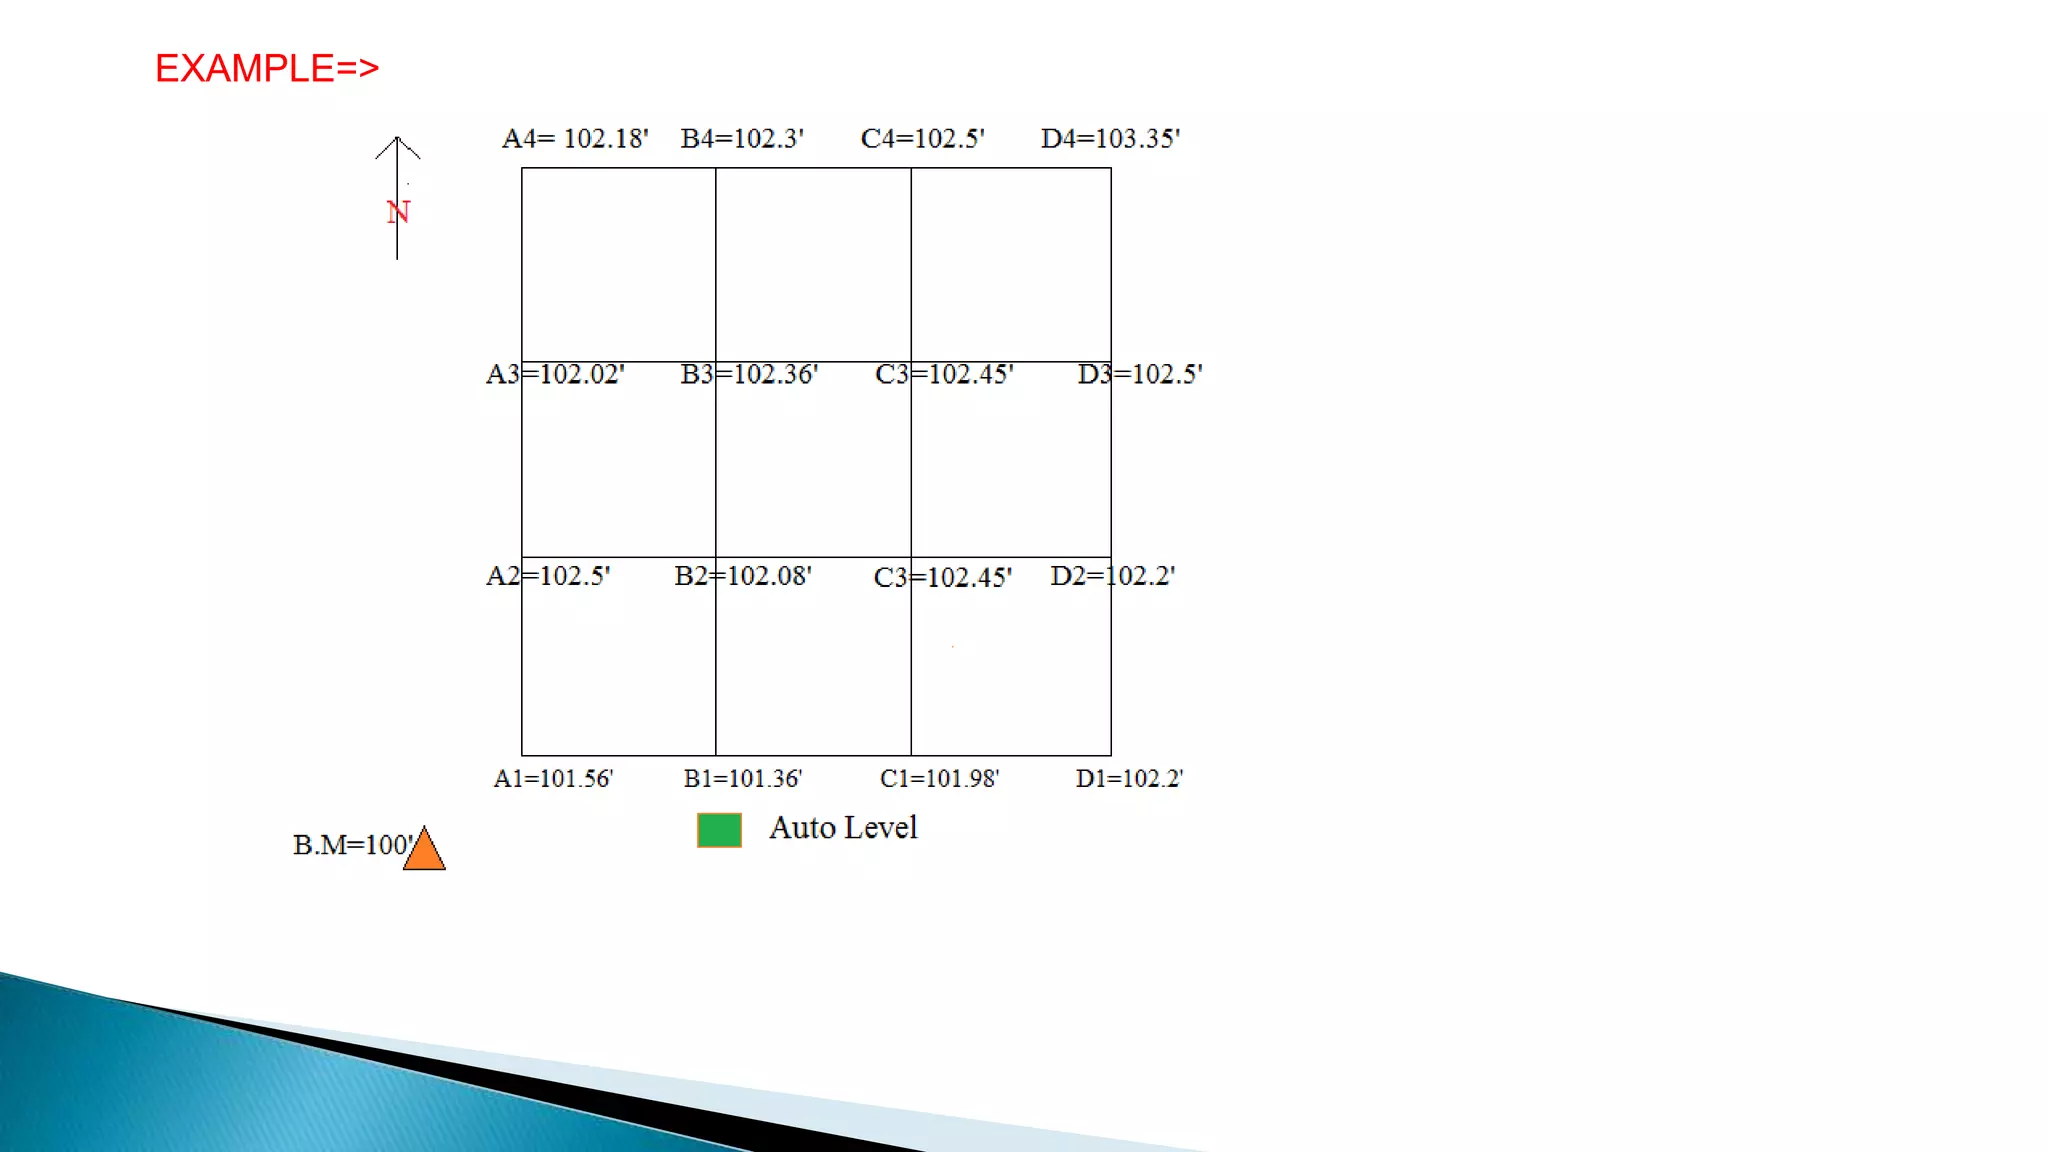
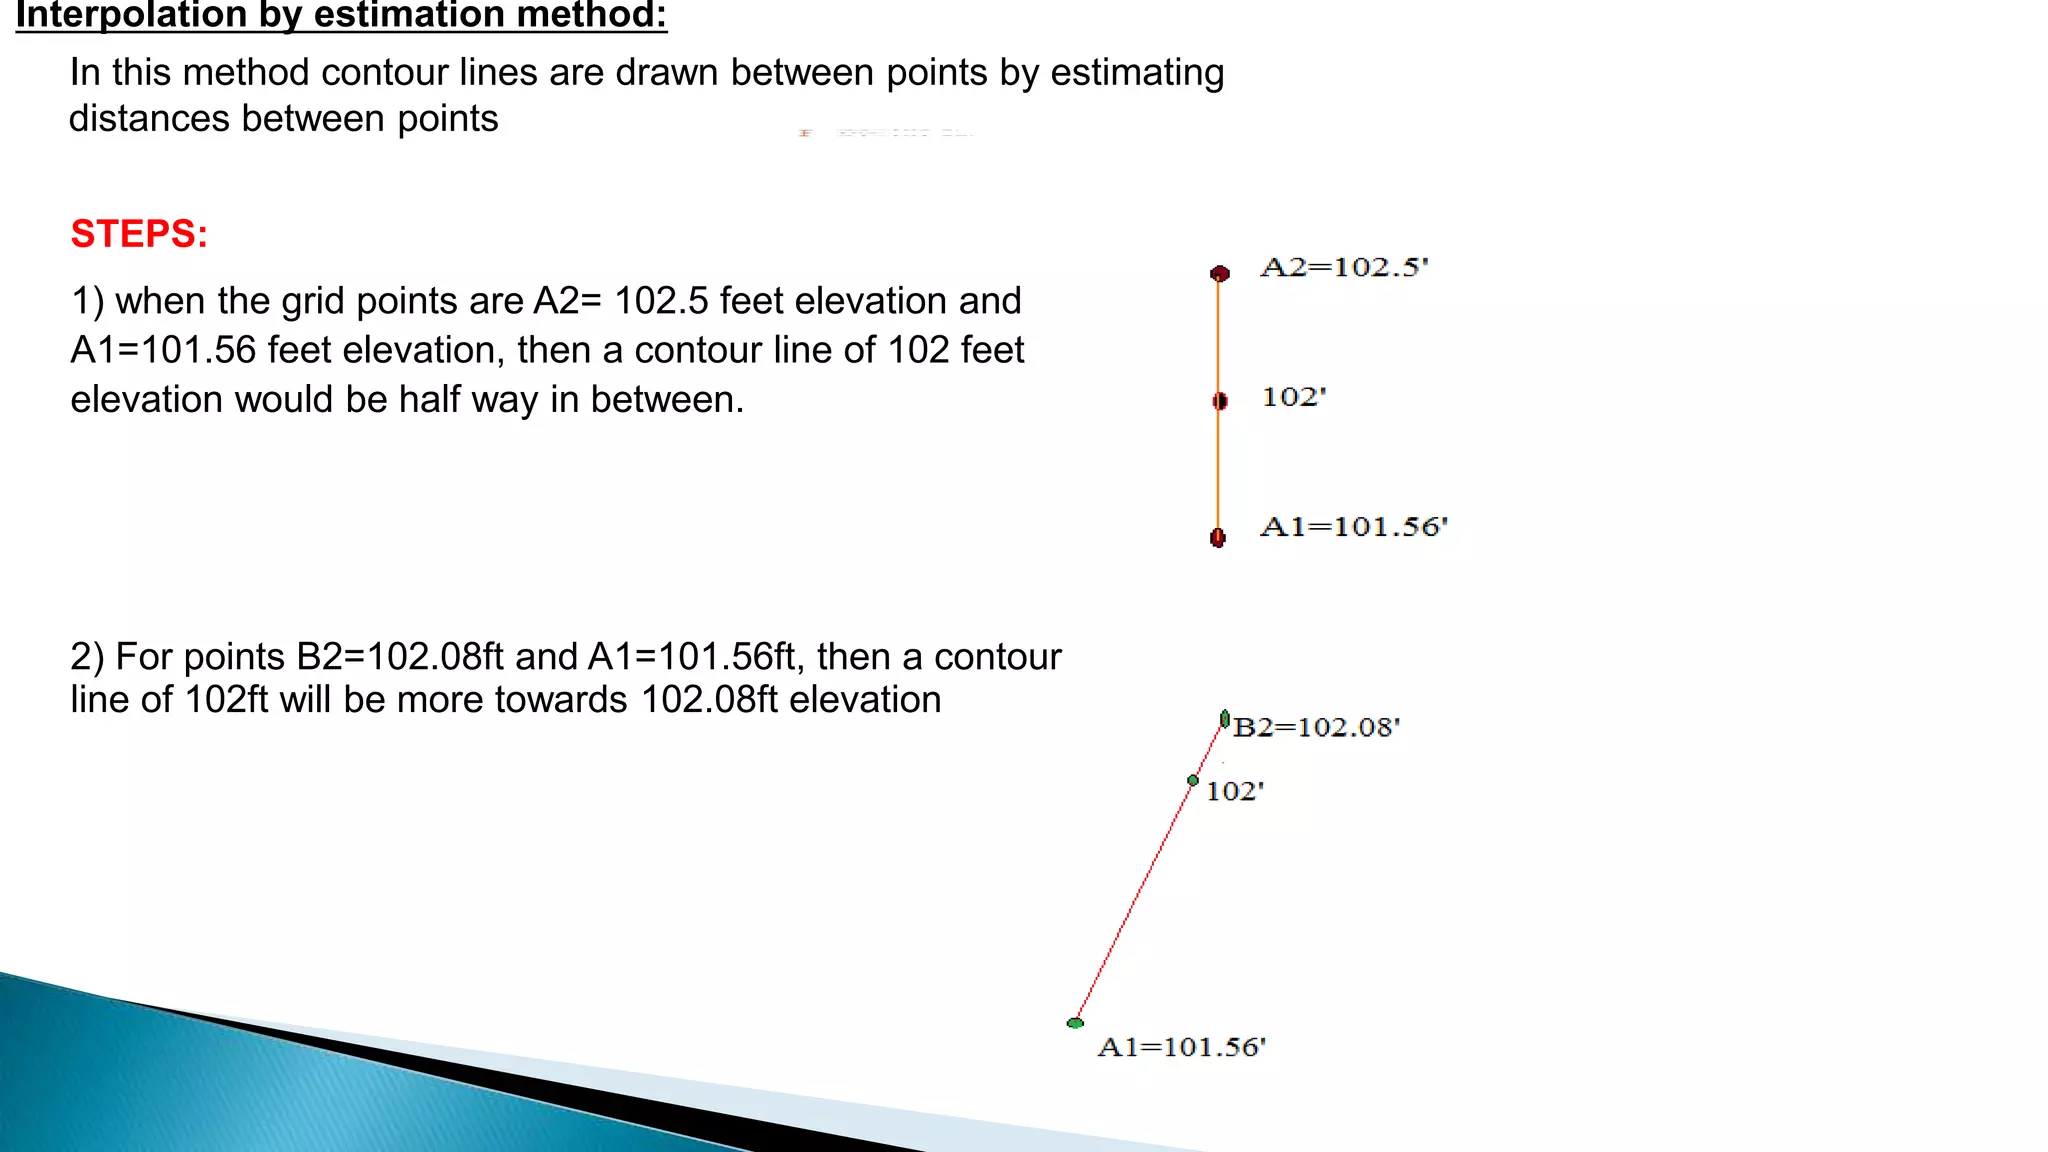
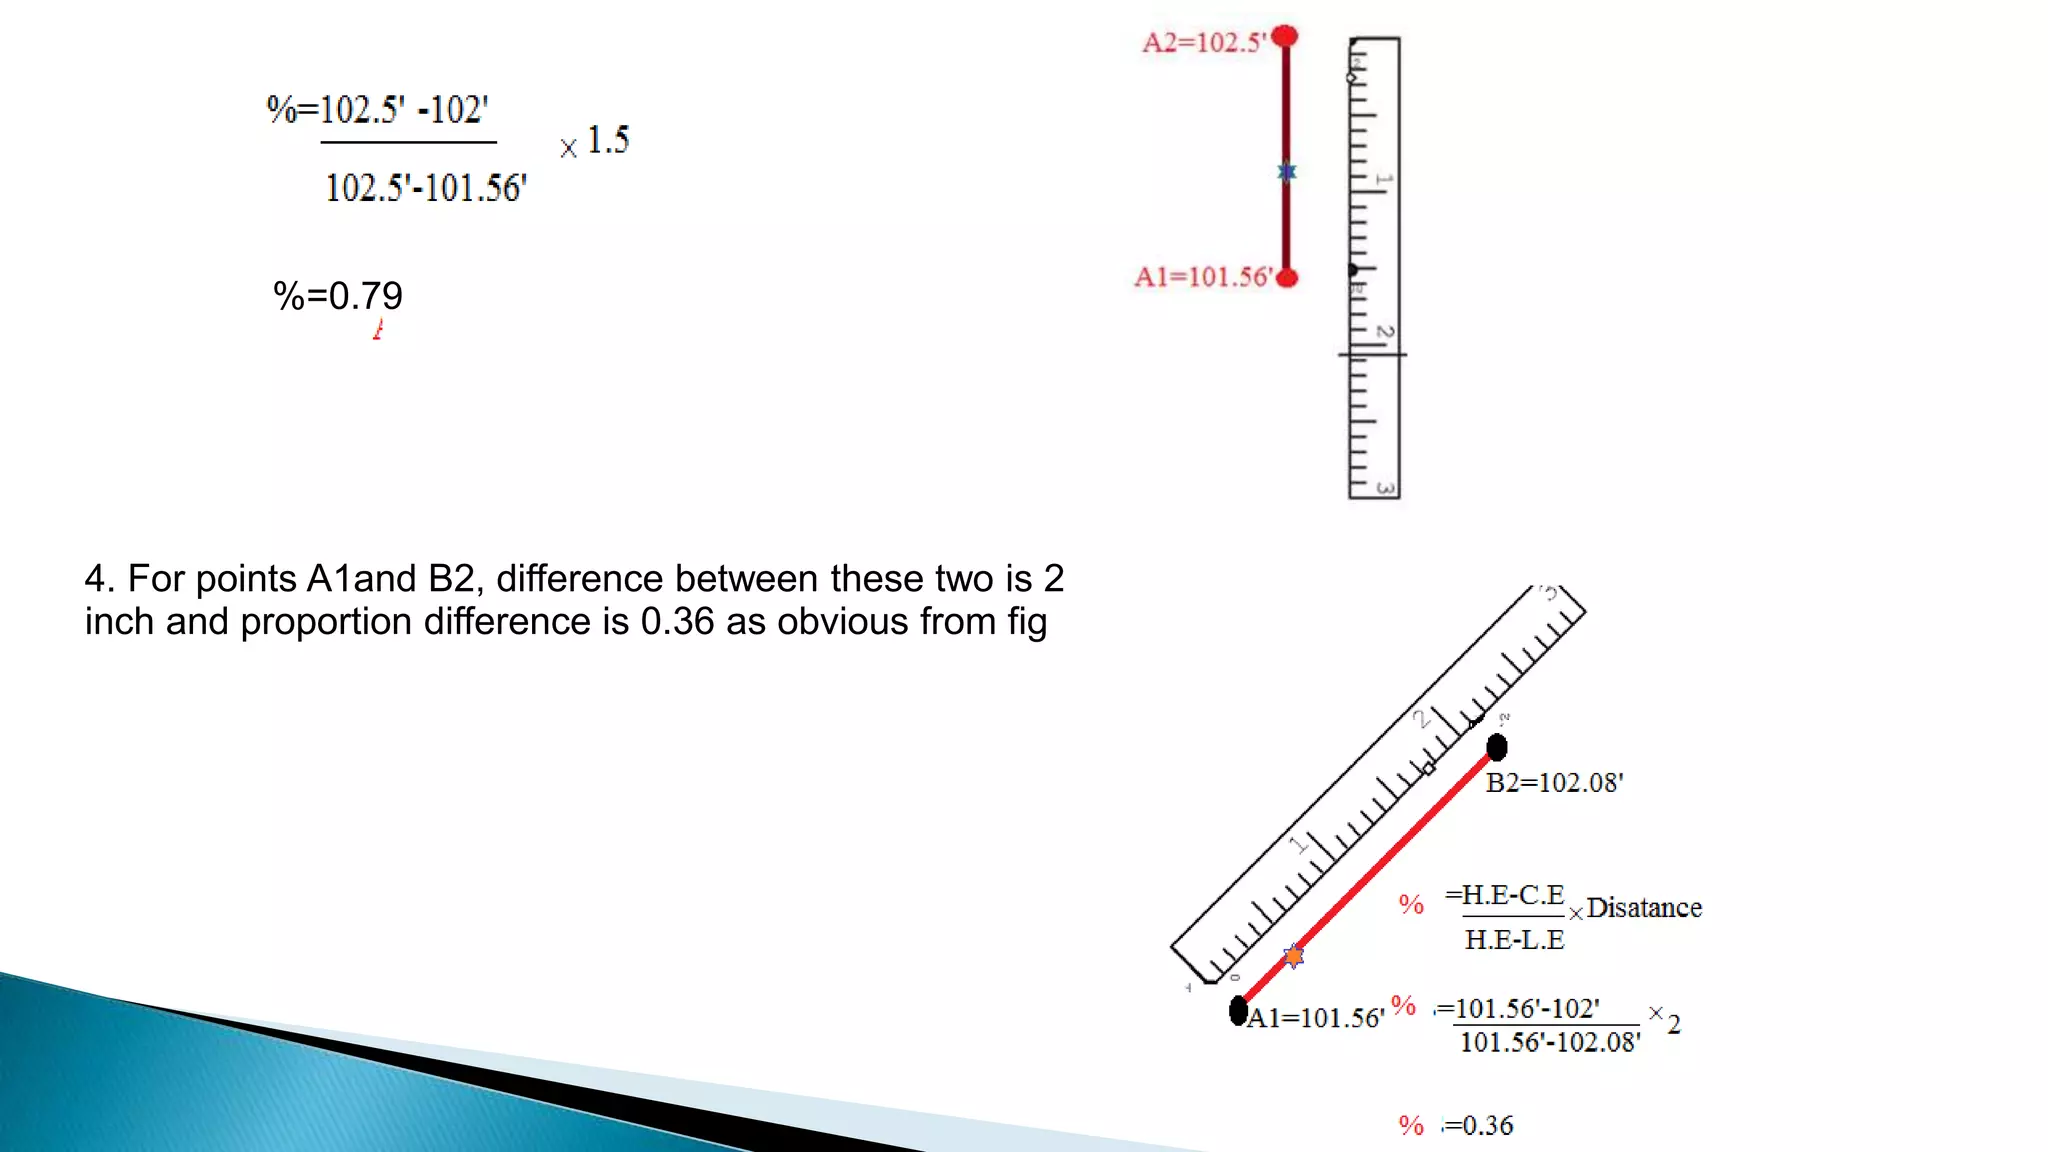
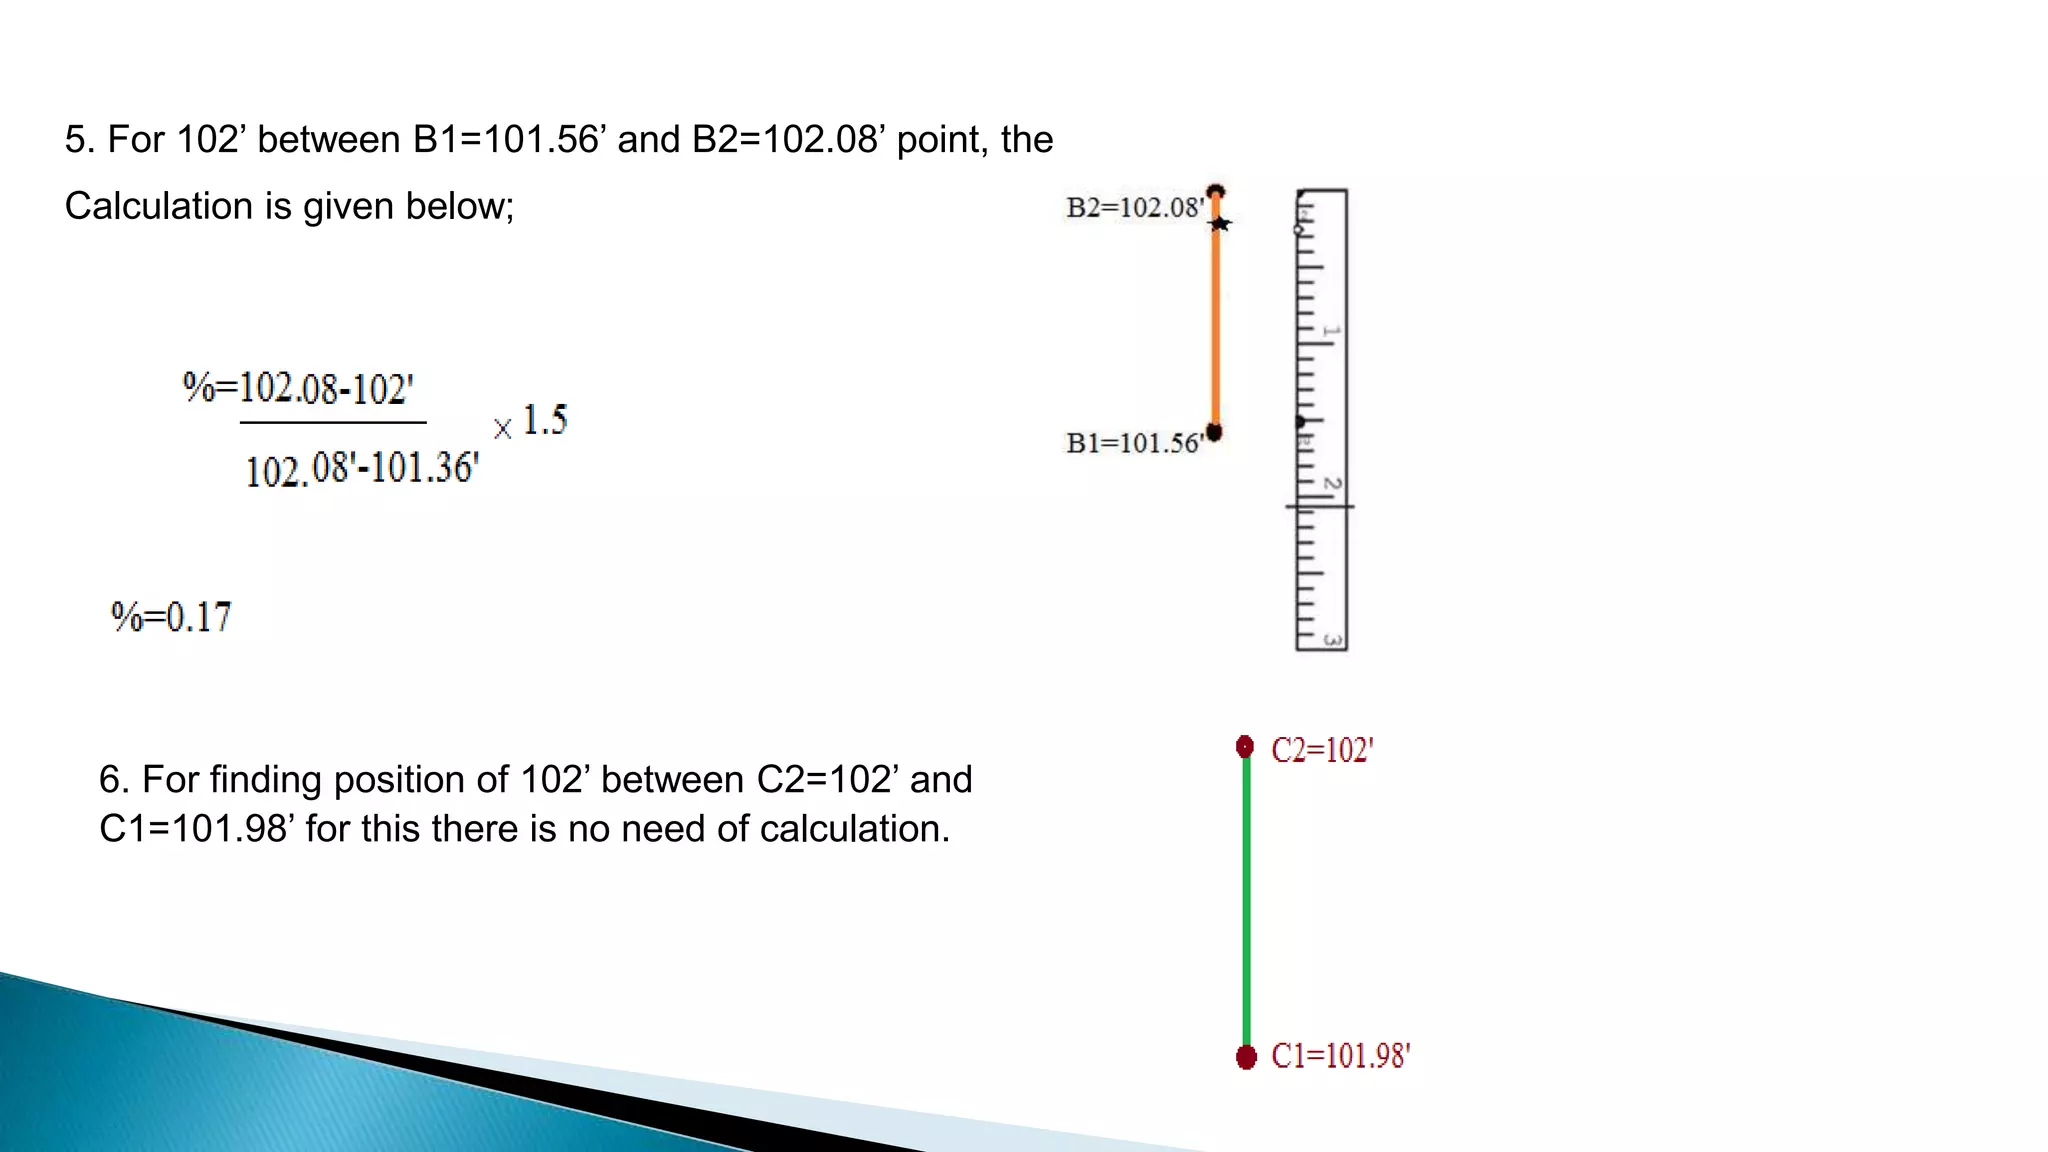
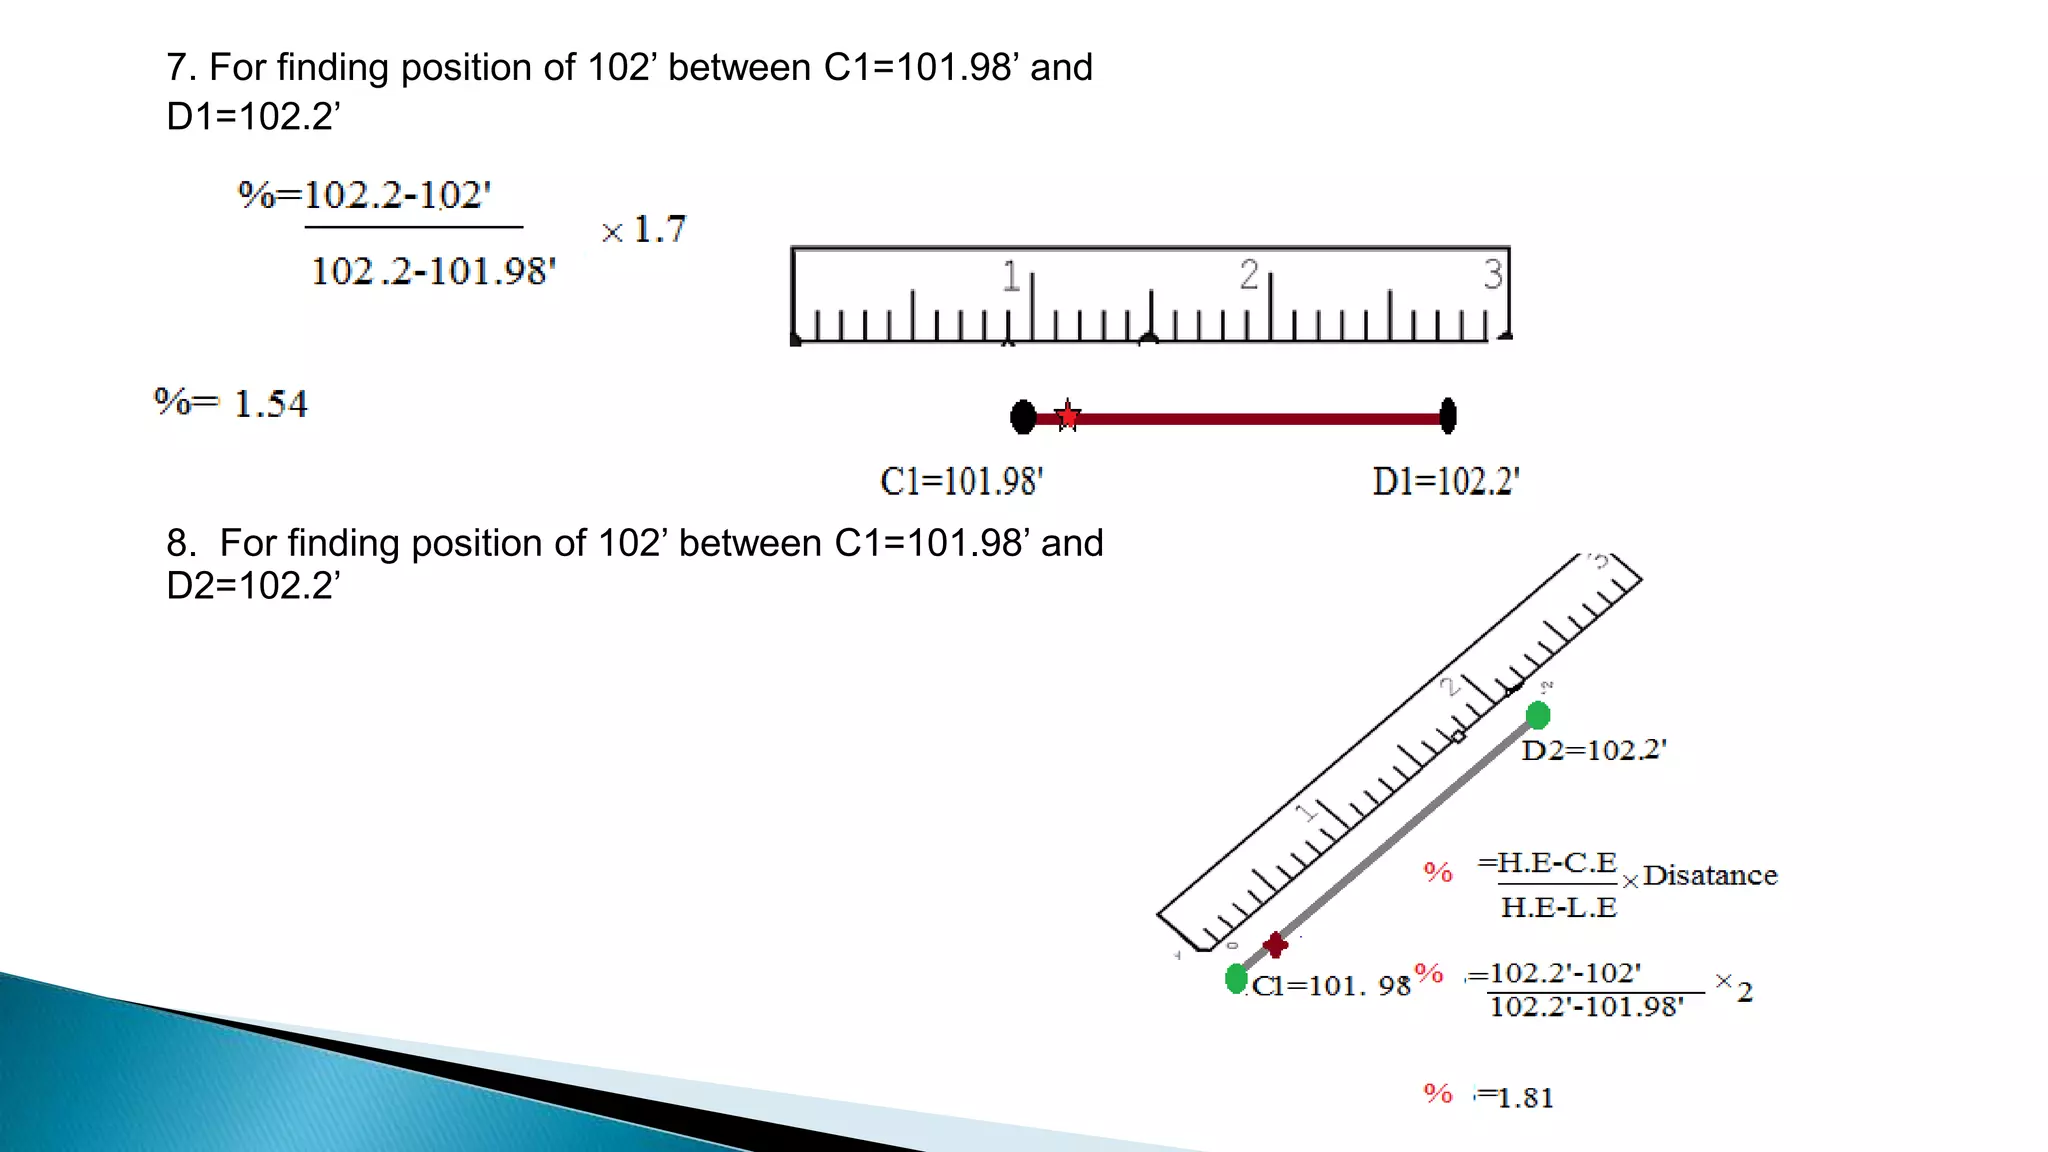
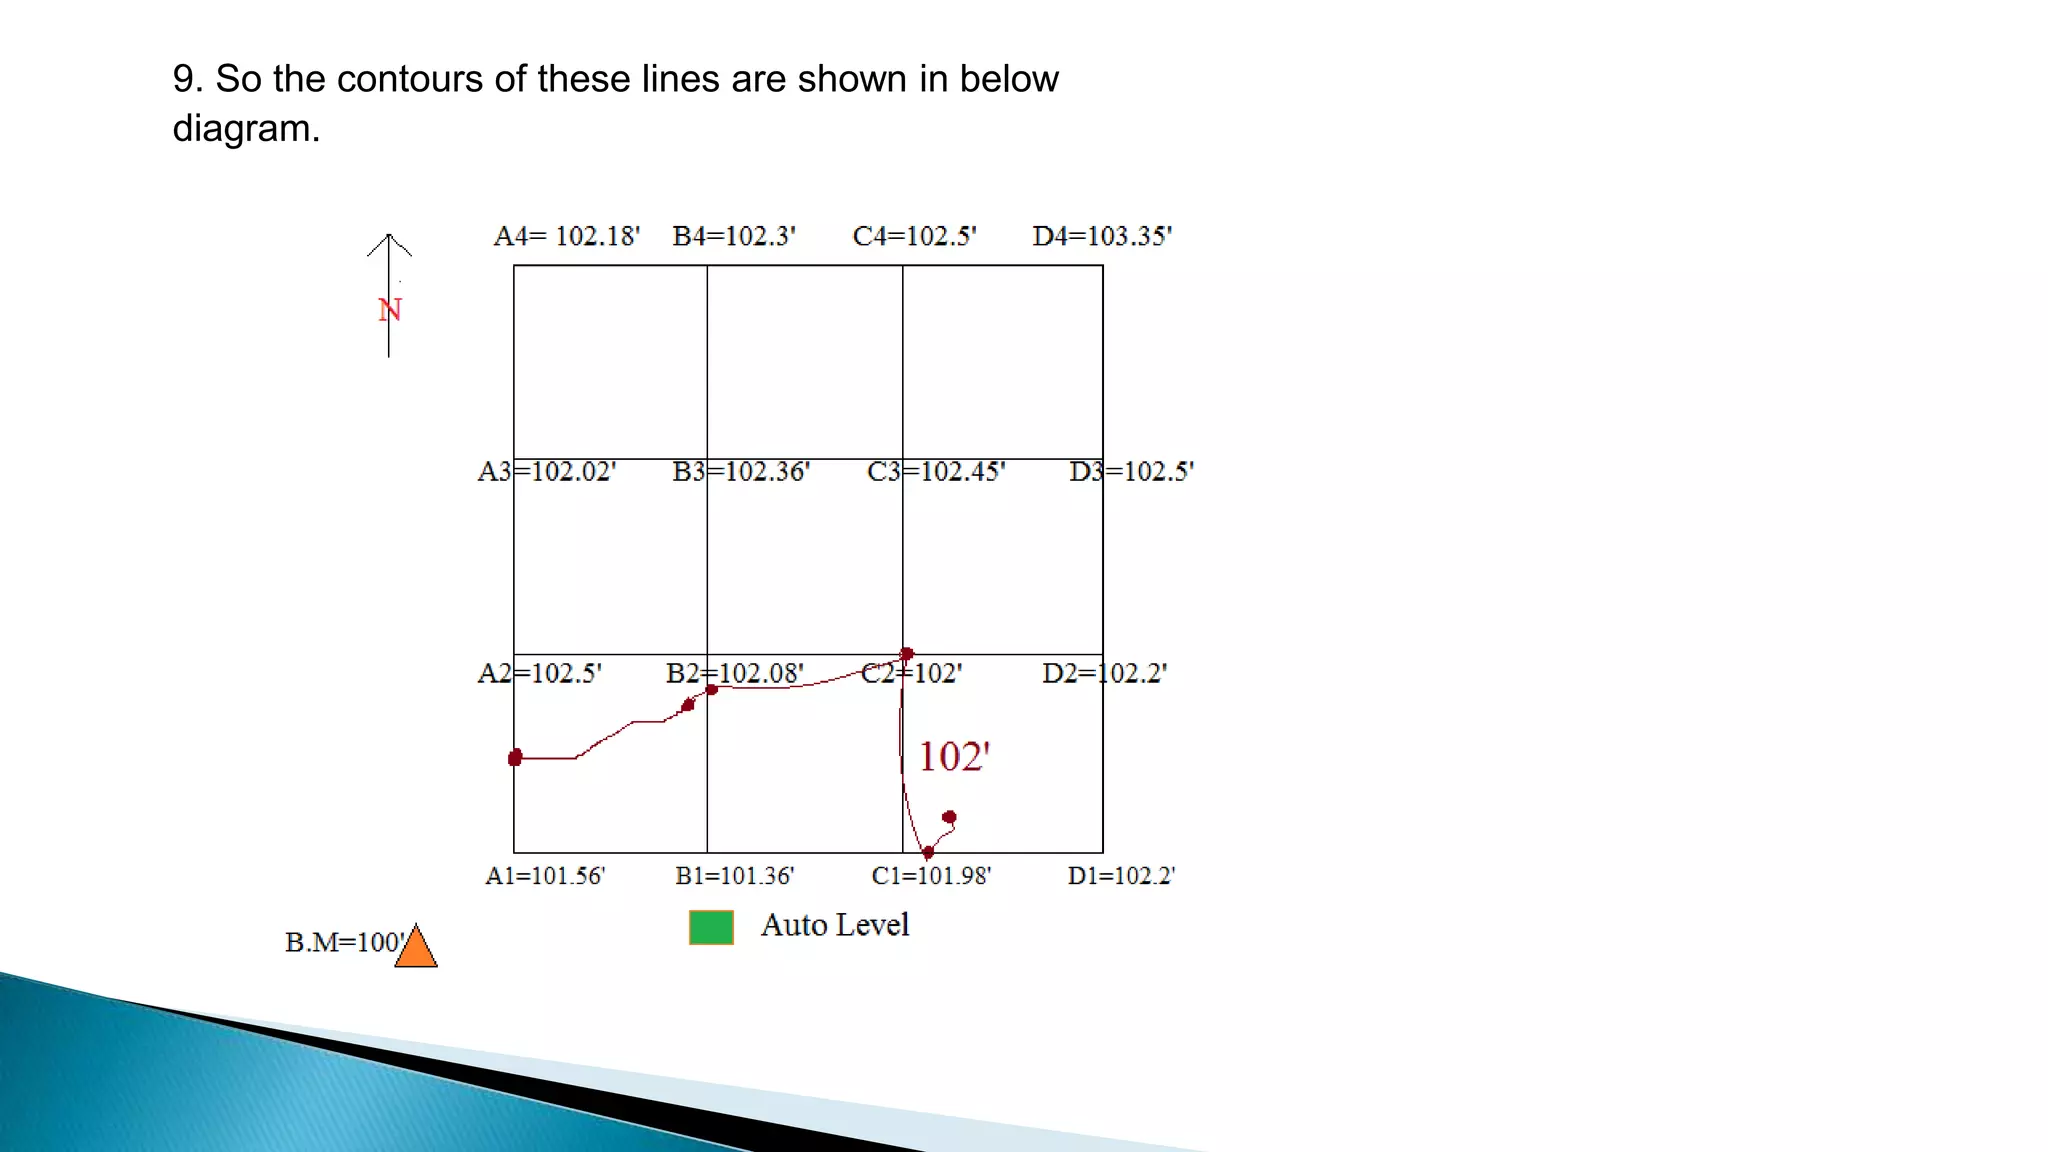
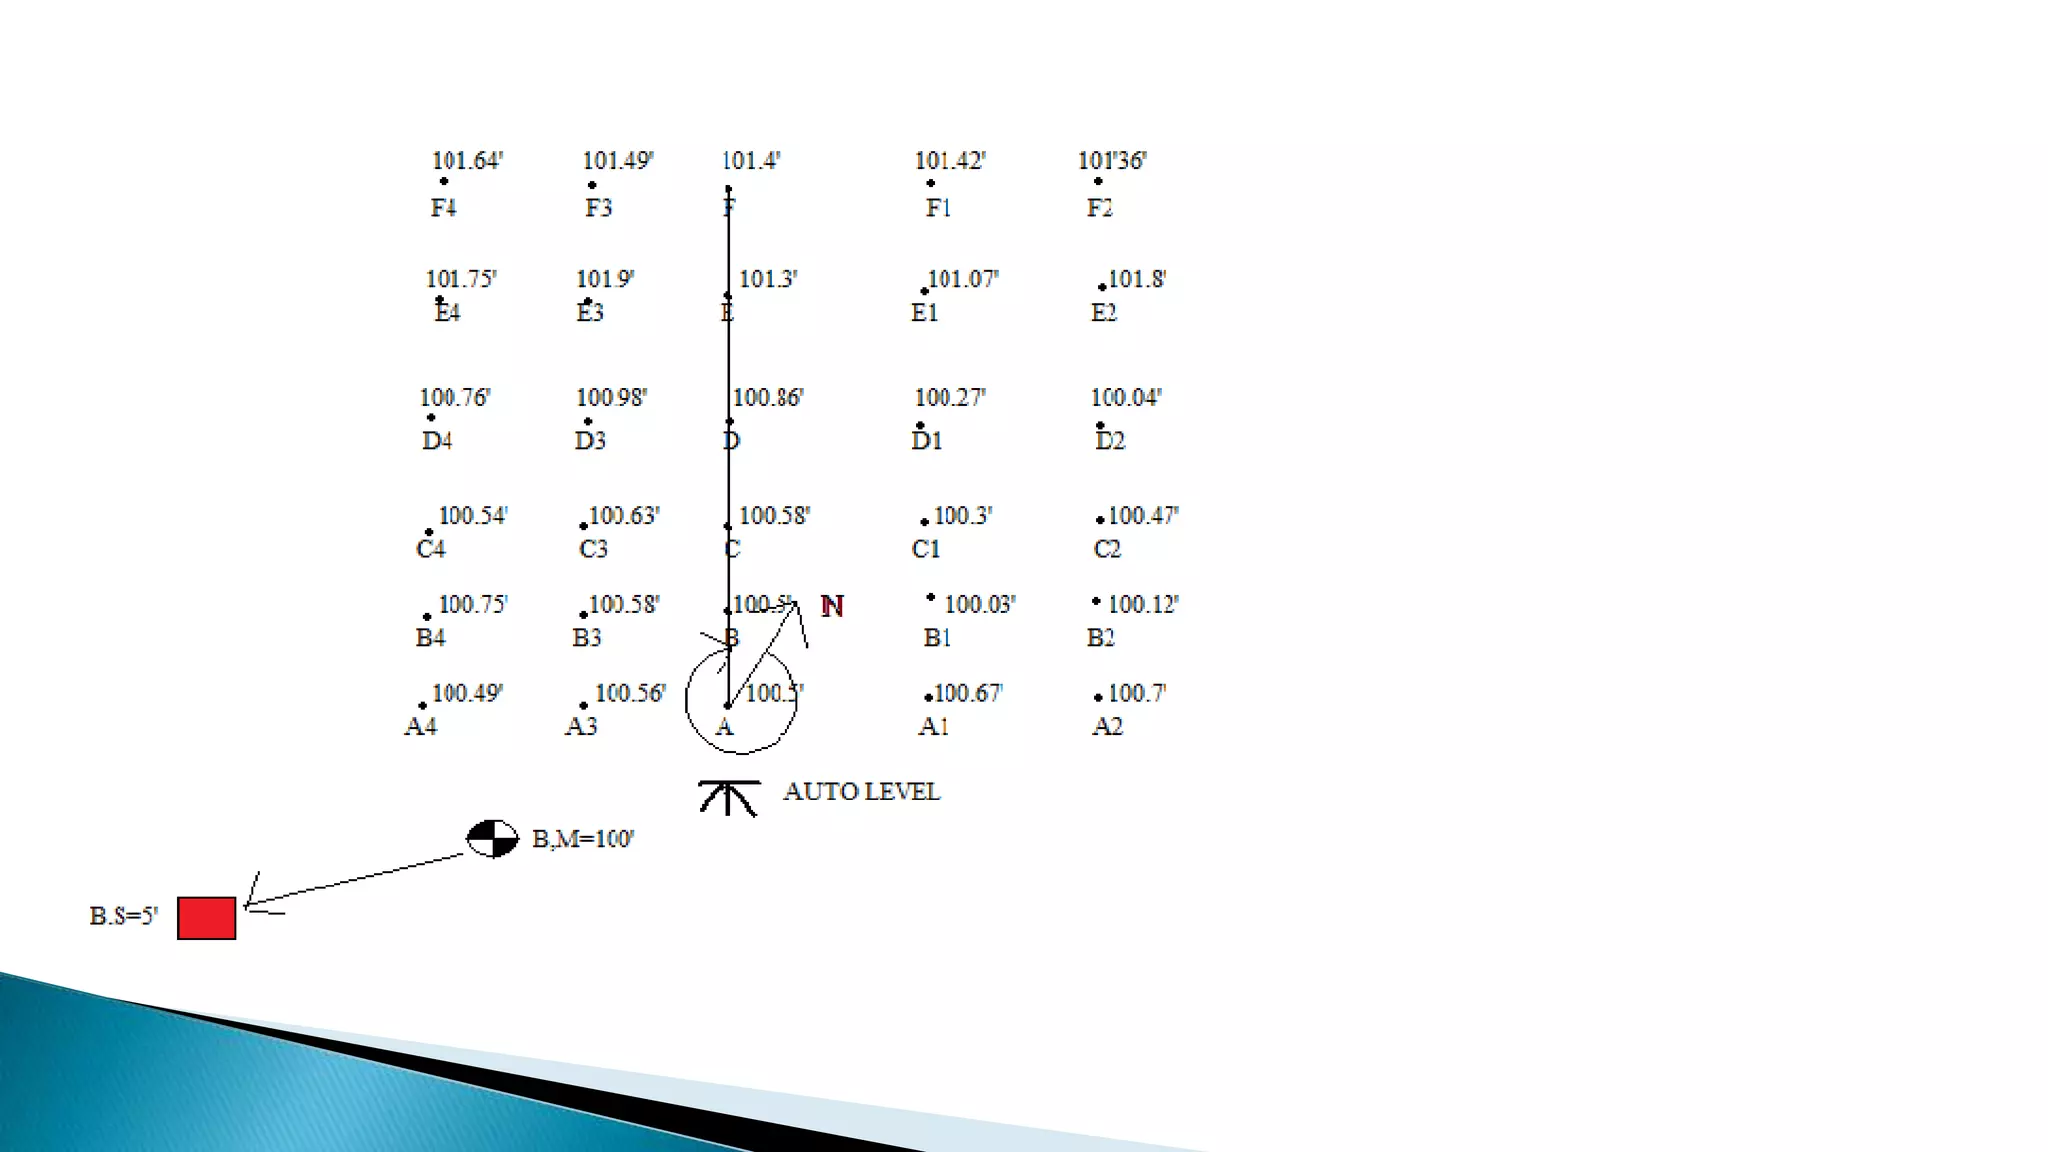
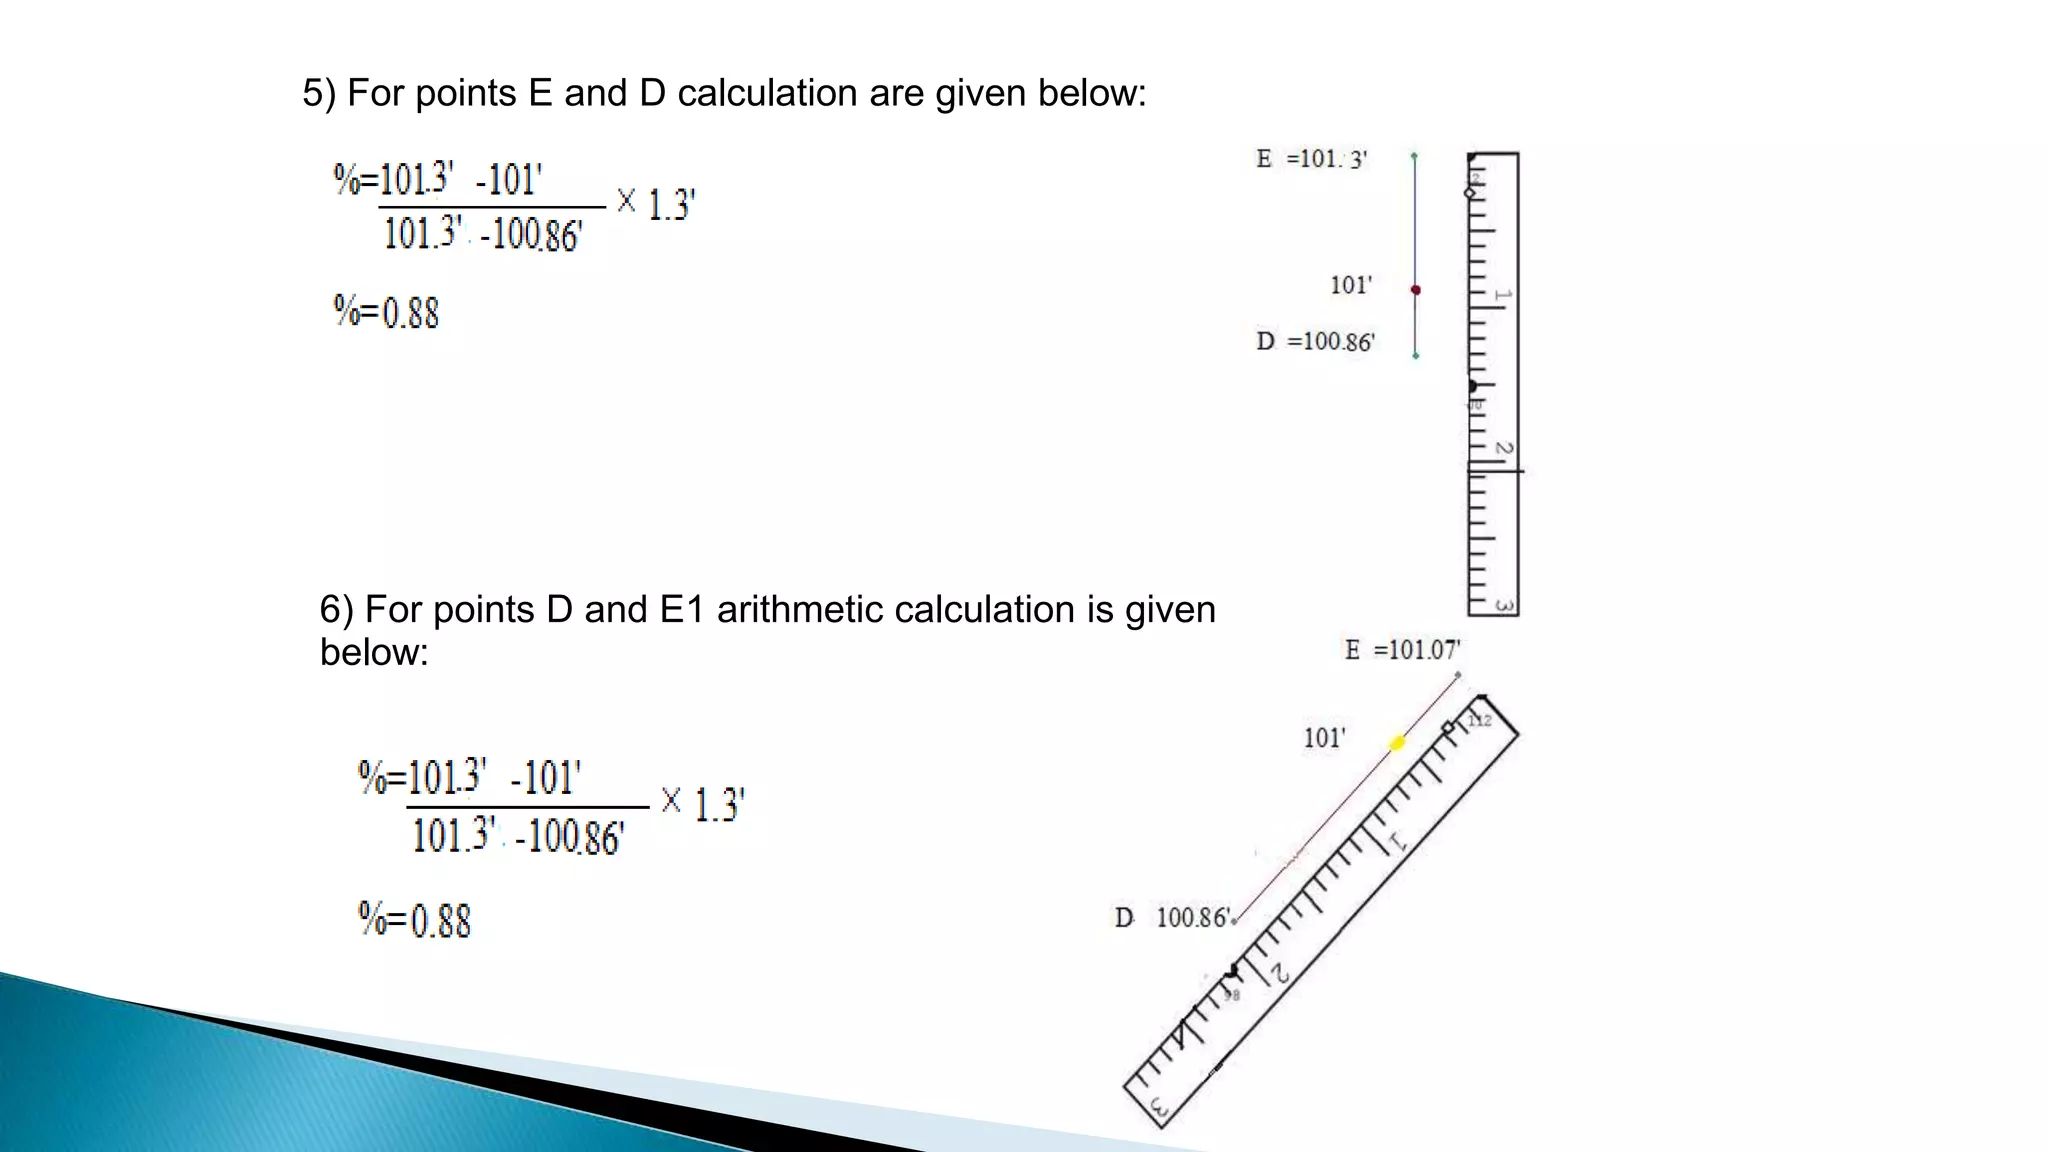
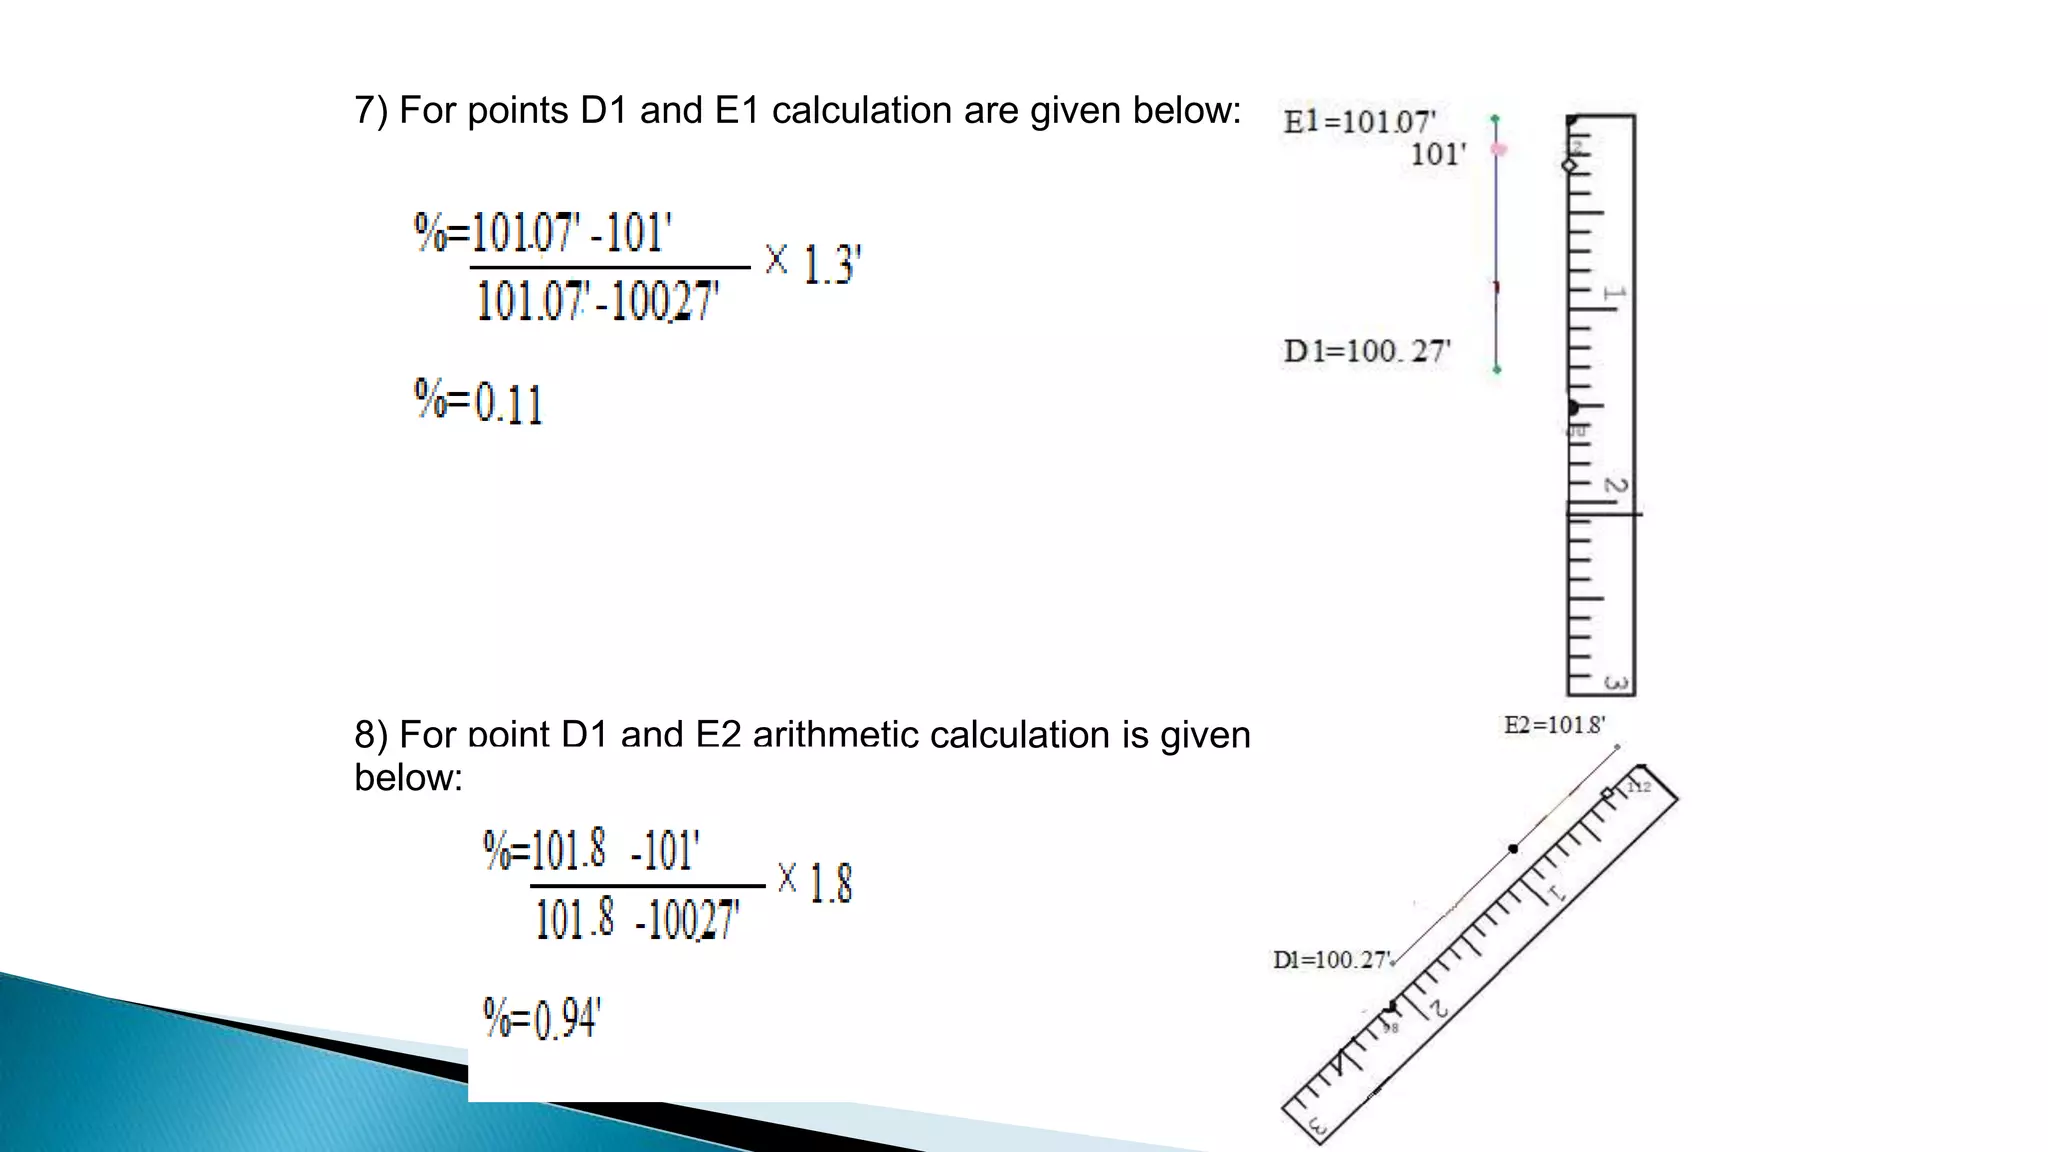
INTERNATIONAL ISLAMIC UNIVERSITY ISLAMABAD
CONTOURING BY INDIRECT METHOD LAB MANUAL
GROUP 07
DEPARTMENT OF CIVIL ENGINEERING
FACULTY OF ENGINEERING & TECNOLOGY
 GROUP MEMBERS
SALMAN NISAR
31-FET/BSCE/F14
MUHAMMAD YASEEN
32-FET/BSCE/F14
MUHAMMAD ISMIAL
34-FET/BSCE/F14
MUHAMMAD JUNAID
35-FET/BSCE/F14
 METHODS OF CONTOURING :
i. Direct Method:
 Radial method
 Random method
i. Indirect Method:
Indirect method is quick, economic and less laborious than direct
method. The reduced level of a point on the surface of ground is
called spot height or spot level .In this method spot levels of selected
points are taken with a level and their levels are computed. The
horizontal positions of these points are measured or computed and
the points are plotted on the plan. The contours are then drawn by a
process called interpolation of contours from the levels of the guide
points.
It have further three categories, given below
 Grid or Square method
 Cross Section method
 Tachometric method
 Radial lines method
I. Grid or Square Method:
1) This method is suitable only if area is not very extensive. its
procedure is mention below.
2) Squares or grid method is suitable for contouring of plains or
gently sloping grounds.
o PROCEDURE
a) In this method area to be contoured is divided into series of squares,
and ends (corner) of each square is marked with pegs.
b) The size of square varies from 5m to 20m, depending upon the
contour intervals and nature of ground and scale of the desired map.
c) The squares not need to be same throughout and may vary depending
on requirements and field conditions.
d) The pegs are marked out and elevation of the ground at the corners of
the square are determined by a level.
e) The grid is plotted to the scale of the map and the spot levels of the
grid corners are entered.
f) The contours of desired values are then located by interpolation.
g) Special care should be taken to give the spot levels to the salient
features of the ground such as hilltops, deepest points of the
depressions.
h) The method is used for large scale mapping and at average
precision.
EXAMPLE=>
PROCEDURE:
• We have an area of 30m 30m and we want to convert it to grids or squares.
• Make 10m
.

.
• Set the auto level at a point of known reduce level, and
take a back sight by help of auto level.
• Adding B.S value to B.M will give us H.I, whose mathematical formula
is
H.I=B.M + B.S => 100’+5.4’=105.4’
• . Now place staff rod at every corner of grid and note
readings.
10m grids throughout the area
• This is F.S, by subtracting these values from H.I we get R.L of that
point.
• A1 point has a F.S of 3.84’ so subtracting 3.84’ from 105.4’ which is H.I
will
Give us 101.56’ which is the R.L of A1 point.
• Similarly F.S of point A3 is 3.38’ and its reduce level becomes 102.02’
• This process goes until reduce level of last point D4 is found, which is
103.35’
PROCEDURE: CON’T
Interpolation by estimation method:
In this method contour lines are drawn between points by estimating
distances between points
STEPS:
1) when the grid points are A2= 102.5 feet elevation and
A1=101.56 feet elevation, then a contour line of 102 feet
elevation would be half way in between.
2) For points B2=102.08ft and A1=101.56ft, then a contour
line of 102ft will be more towards 102.08ft elevation
3) For points B2=102.08ft and B1=101.36ft, then a
contour line of 102ft will be more towards 102.08ft
elevation
4) For point C2=102’, so the contour point will be on c2.
6) For points C1=101.98ft and D2=102.2ft, then a contour
line of 102’will be more towards C1=101.98ft elevation.
5) For points C1=101.98ft and D1=102.2ft, then a contour
line of 102ft will be more towards C1=101.98ft elevation.
7) So contour lines of area 30m 30m by estimation method is given below
Interpolation of Grids by Arithmetical
calculation:
In method contour lines are drawn between ground
points by using formula given below:
elevationobetween twDistance
elevationLow-elevationHigh
elevationCentral-elevationHigh
=% 
STEPS:
1. Start by selecting a contour interval and two grid points.
2. This example starts with point of 102ft interval.
3. The distance between A1 and A2 is 1.inch so by putting
the values in following formula gives:
%=0.79
4. For points A1and B2, difference between these two is 2
inch and proportion difference is 0.36 as obvious from fig
5. For 102’ between B1=101.56’ and B2=102.08’ point, the
Calculation is given below;
6. For finding position of 102’ between C2=102’ and
C1=101.98’ for this there is no need of calculation.
7. For finding position of 102’ between C1=101.98’ and
D1=102.2’
8. For finding position of 102’ between C1=101.98’ and
D2=102.2’
9. So the contours of these lines are shown in below
diagram.
I. Cross Section method:
This method is most suitable for the survey of
long narrow strip such as road, railway, canal etc.
 PROCEDURE:
a) Cross section are run transverse to the center line
of work and representative points are marked along
the line of cross section.
b) The cross section line need not necessarily be at
right angles to the center line of work.
c) This may be inclined at any angle to the center line
if necessary.
d) This spacing of the cross section depend on the
topography of the country and the nature of survey
the common value is 20m to 30m in hilly country and
100m in flat country.
e) The level of the points along the section line are
plotted on the plan and contour are then interpolated
as usual.
 Example:
1. In this example the base line is 50m.
2. Two points are taken at each side of base line at 5m.
3. First of all H.I is found from the B.S=5ft and B.M=100ft
By formula mention below;
H.I=B.S+B.M
H.I=5ft+100ft
H.I=105ft
4. The reduce level of each point is found by simply
subtracting F.S of that point from H.I
’.
6. For point A3, F.S=4.44ft it’s R.L=100.56’.
7. F.S of point A2=4.29ft, its R.L becomes 100.71ft
8. F.S of point A1=4.33ft, its R.L becomes 100.67ft.
9. F.S of point A is 4.5ft and its R.L is 100.5ft
10. Similarly for last point F4, F.S=3.36ft and its R.L is
101.64ft.
11. So by this process the elevation of each point of this
example is found, and is shown in diagram below;
5. Suppose F.S of A4 is 4.54ft so its reduce level is
R.D=H.I-F.S=> R.L=105ft-4.54ft
R.L of point A4=100.49ft
Interpolation of cross section by estimation
method:
 In this example we try to find contour intervals of 101ft,
so for finding this contour interval throughout the cross
section steps are given below in details;
 As 101ft is closer to point D4=100.76’ than
E4=101.75’so this shows that contour interval=101ft
will be close to point D4.
 For point D4=100.76ft and E3=101.9’, again 101ft contour interval will
be near point D4.
 For point E3=101.9’ and D3=100.98ft, 101ft contour
interval will be near point D3.
 For point D3=100.98ft and E=101.3ft contour interval
of 101ft will be near point D3.
 For point D=100.86ft and E=101.3ft contour interval of
101ft will be near point D.
 For point D=100.86ft and E1=101.07ft, 101ft contour
interval will be near point E1.
 For point D1=100.27ft and E2=101.8ft, 101ft contour
interval will be closer to point D1.
 For point D1=100.27ft and E1=101.07ft, 101ft contour interval
will be more near to point E1.
So the whole contour interval can be plotted as
Interpolation of cross section by arithmetical
method:
In this method interpolation of points is done by the
process of proportion formula given below:
elevationobetween twDistance
elevationLow-elevationHigh
elevationCentral-elevationHigh
=% 
STEPS:
1) The contour interval between D4 and E4 is given
below:
2) For points D4 and E3 calculation is given below along
with fig:
3) For point E3 and D3 the calculation are given below
along with fig:
4)For point E and D3 calculation is given:
5) For points E and D calculation are given below:
6) For points D and E1 arithmetic calculation is given
below:
7) For points D1 and E1 calculation are given below:
8) For point D1 and E2 arithmetic calculation is given
below:
So the calculation can be plotted on map as:
I. Tachometric method:
Whenever contouring of very steep area such
as a “hill” is required tachometric method is used.
Procedure is given below.
 PROCEDURE:
a) Set up the tachometer at the top of the steep hill.
Tachometer is a theodolite fitted with stadia
diaphragm. The stadia diaphragm has three horizontal
parallel hairs instead of one as found in a conventional
cross hair diaphragm.
b) With the help of a tachometer it is possible to
determine the horizontal distance of the point from
the telescope as well its vertical level.
c) The steep hill is surveyed at three levels – the base of
the hill, the mid-level of the hill and the top level of the
hill.
I. Radial line method:
This method is convenient in hilly terrain
 PORCEDURE:
a. Radial line method in this method, a number of radial
lines are set out at known angular interval at each
station and points are marked at the ground at
convenient distance apart on the rays that are set.
b. Spot levels of these points are determined by leveling.
c. The points are plotted to the scale of the map and spot
levels are entered.
d. The contours of desired values are then located by
interpolation.
d) Using the tachometer reading are taken all around the
hill at equal angular intervals on all these three levels.
e) The radial plot thus obtained is worked in the office to
interpolate points of equal elevation for contour mapping.
Interpolation of contours:
• Drawing contour lines to produce a contouring of an area
requires the process of interpolation between points.
• Interpolation process means spacing the contours
proportionally between the plotted ground points.
• Contours can be interpolated by :
1. By estimation method
2. By arithmetical calculation method
3. By graphical method
1. Estimatiom method:
 The position of contour points between ground points
are estimated.
 The contour lines are then drawn through these points.
 This method is used for rough and usually used on
small scale maps.
 Interpolating can be done by estimation for low
precision maps.
2. Arithmetical calculation method:
 This method is employed when greater accuracy is
required.
 This is time consuming also.
 Positions of contours points among guide points are located
by arithmetic calculations.
 Formula is given below:
elevationobetween twDistance
elevationLow-elevationHigh
elevationCentral-elevationHigh
=% 
3. Graphical method:
 When higher accuracy is required and many contours
are to be made, this method is employed.
 This method of interpolation proves to be rapid and
easy.
 For this purpose a tracing paper is used.

LAB MANUAL contouring by indirect method . dce: fet: iiui

  • 1.
    INTERNATIONAL ISLAMIC UNIVERSITYISLAMABAD CONTOURING BY INDIRECT METHOD LAB MANUAL GROUP 07 DEPARTMENT OF CIVIL ENGINEERING FACULTY OF ENGINEERING & TECNOLOGY
  • 2.
     GROUP MEMBERS SALMANNISAR 31-FET/BSCE/F14 MUHAMMAD YASEEN 32-FET/BSCE/F14 MUHAMMAD ISMIAL 34-FET/BSCE/F14 MUHAMMAD JUNAID 35-FET/BSCE/F14
  • 3.
     METHODS OFCONTOURING :
  • 4.
    i. Direct Method: Radial method  Random method i. Indirect Method: Indirect method is quick, economic and less laborious than direct method. The reduced level of a point on the surface of ground is called spot height or spot level .In this method spot levels of selected points are taken with a level and their levels are computed. The horizontal positions of these points are measured or computed and the points are plotted on the plan. The contours are then drawn by a process called interpolation of contours from the levels of the guide points. It have further three categories, given below  Grid or Square method  Cross Section method  Tachometric method  Radial lines method
  • 5.
    I. Grid orSquare Method: 1) This method is suitable only if area is not very extensive. its procedure is mention below. 2) Squares or grid method is suitable for contouring of plains or gently sloping grounds. o PROCEDURE a) In this method area to be contoured is divided into series of squares, and ends (corner) of each square is marked with pegs. b) The size of square varies from 5m to 20m, depending upon the contour intervals and nature of ground and scale of the desired map. c) The squares not need to be same throughout and may vary depending on requirements and field conditions. d) The pegs are marked out and elevation of the ground at the corners of the square are determined by a level. e) The grid is plotted to the scale of the map and the spot levels of the grid corners are entered. f) The contours of desired values are then located by interpolation. g) Special care should be taken to give the spot levels to the salient features of the ground such as hilltops, deepest points of the depressions. h) The method is used for large scale mapping and at average precision.
  • 6.
  • 7.
    PROCEDURE: • We havean area of 30m 30m and we want to convert it to grids or squares. • Make 10m .  . • Set the auto level at a point of known reduce level, and take a back sight by help of auto level. • Adding B.S value to B.M will give us H.I, whose mathematical formula is H.I=B.M + B.S => 100’+5.4’=105.4’ • . Now place staff rod at every corner of grid and note readings. 10m grids throughout the area • This is F.S, by subtracting these values from H.I we get R.L of that point. • A1 point has a F.S of 3.84’ so subtracting 3.84’ from 105.4’ which is H.I will Give us 101.56’ which is the R.L of A1 point.
  • 8.
    • Similarly F.Sof point A3 is 3.38’ and its reduce level becomes 102.02’ • This process goes until reduce level of last point D4 is found, which is 103.35’ PROCEDURE: CON’T
  • 9.
    Interpolation by estimationmethod: In this method contour lines are drawn between points by estimating distances between points STEPS: 1) when the grid points are A2= 102.5 feet elevation and A1=101.56 feet elevation, then a contour line of 102 feet elevation would be half way in between. 2) For points B2=102.08ft and A1=101.56ft, then a contour line of 102ft will be more towards 102.08ft elevation
  • 10.
    3) For pointsB2=102.08ft and B1=101.36ft, then a contour line of 102ft will be more towards 102.08ft elevation 4) For point C2=102’, so the contour point will be on c2.
  • 11.
    6) For pointsC1=101.98ft and D2=102.2ft, then a contour line of 102’will be more towards C1=101.98ft elevation. 5) For points C1=101.98ft and D1=102.2ft, then a contour line of 102ft will be more towards C1=101.98ft elevation.
  • 12.
    7) So contourlines of area 30m 30m by estimation method is given below
  • 13.
    Interpolation of Gridsby Arithmetical calculation: In method contour lines are drawn between ground points by using formula given below: elevationobetween twDistance elevationLow-elevationHigh elevationCentral-elevationHigh =%  STEPS: 1. Start by selecting a contour interval and two grid points. 2. This example starts with point of 102ft interval. 3. The distance between A1 and A2 is 1.inch so by putting the values in following formula gives:
  • 14.
    %=0.79 4. For pointsA1and B2, difference between these two is 2 inch and proportion difference is 0.36 as obvious from fig
  • 15.
    5. For 102’between B1=101.56’ and B2=102.08’ point, the Calculation is given below; 6. For finding position of 102’ between C2=102’ and C1=101.98’ for this there is no need of calculation.
  • 16.
    7. For findingposition of 102’ between C1=101.98’ and D1=102.2’ 8. For finding position of 102’ between C1=101.98’ and D2=102.2’
  • 17.
    9. So thecontours of these lines are shown in below diagram.
  • 18.
    I. Cross Sectionmethod: This method is most suitable for the survey of long narrow strip such as road, railway, canal etc.  PROCEDURE: a) Cross section are run transverse to the center line of work and representative points are marked along the line of cross section. b) The cross section line need not necessarily be at right angles to the center line of work. c) This may be inclined at any angle to the center line if necessary. d) This spacing of the cross section depend on the topography of the country and the nature of survey the common value is 20m to 30m in hilly country and 100m in flat country. e) The level of the points along the section line are plotted on the plan and contour are then interpolated as usual.
  • 19.
     Example: 1. Inthis example the base line is 50m. 2. Two points are taken at each side of base line at 5m. 3. First of all H.I is found from the B.S=5ft and B.M=100ft By formula mention below; H.I=B.S+B.M H.I=5ft+100ft H.I=105ft 4. The reduce level of each point is found by simply subtracting F.S of that point from H.I ’.
  • 20.
    6. For pointA3, F.S=4.44ft it’s R.L=100.56’. 7. F.S of point A2=4.29ft, its R.L becomes 100.71ft 8. F.S of point A1=4.33ft, its R.L becomes 100.67ft. 9. F.S of point A is 4.5ft and its R.L is 100.5ft 10. Similarly for last point F4, F.S=3.36ft and its R.L is 101.64ft. 11. So by this process the elevation of each point of this example is found, and is shown in diagram below; 5. Suppose F.S of A4 is 4.54ft so its reduce level is R.D=H.I-F.S=> R.L=105ft-4.54ft R.L of point A4=100.49ft
  • 22.
    Interpolation of crosssection by estimation method:  In this example we try to find contour intervals of 101ft, so for finding this contour interval throughout the cross section steps are given below in details;  As 101ft is closer to point D4=100.76’ than E4=101.75’so this shows that contour interval=101ft will be close to point D4.
  • 23.
     For pointD4=100.76ft and E3=101.9’, again 101ft contour interval will be near point D4.  For point E3=101.9’ and D3=100.98ft, 101ft contour interval will be near point D3.
  • 24.
     For pointD3=100.98ft and E=101.3ft contour interval of 101ft will be near point D3.  For point D=100.86ft and E=101.3ft contour interval of 101ft will be near point D.
  • 25.
     For pointD=100.86ft and E1=101.07ft, 101ft contour interval will be near point E1.  For point D1=100.27ft and E2=101.8ft, 101ft contour interval will be closer to point D1.
  • 26.
     For pointD1=100.27ft and E1=101.07ft, 101ft contour interval will be more near to point E1.
  • 27.
    So the wholecontour interval can be plotted as
  • 28.
    Interpolation of crosssection by arithmetical method: In this method interpolation of points is done by the process of proportion formula given below: elevationobetween twDistance elevationLow-elevationHigh elevationCentral-elevationHigh =%  STEPS: 1) The contour interval between D4 and E4 is given below:
  • 29.
    2) For pointsD4 and E3 calculation is given below along with fig:
  • 30.
    3) For pointE3 and D3 the calculation are given below along with fig: 4)For point E and D3 calculation is given:
  • 31.
    5) For pointsE and D calculation are given below: 6) For points D and E1 arithmetic calculation is given below:
  • 32.
    7) For pointsD1 and E1 calculation are given below: 8) For point D1 and E2 arithmetic calculation is given below:
  • 33.
    So the calculationcan be plotted on map as:
  • 34.
    I. Tachometric method: Whenevercontouring of very steep area such as a “hill” is required tachometric method is used. Procedure is given below.  PROCEDURE: a) Set up the tachometer at the top of the steep hill. Tachometer is a theodolite fitted with stadia diaphragm. The stadia diaphragm has three horizontal parallel hairs instead of one as found in a conventional cross hair diaphragm. b) With the help of a tachometer it is possible to determine the horizontal distance of the point from the telescope as well its vertical level. c) The steep hill is surveyed at three levels – the base of the hill, the mid-level of the hill and the top level of the hill.
  • 35.
    I. Radial linemethod: This method is convenient in hilly terrain  PORCEDURE: a. Radial line method in this method, a number of radial lines are set out at known angular interval at each station and points are marked at the ground at convenient distance apart on the rays that are set. b. Spot levels of these points are determined by leveling. c. The points are plotted to the scale of the map and spot levels are entered. d. The contours of desired values are then located by interpolation. d) Using the tachometer reading are taken all around the hill at equal angular intervals on all these three levels. e) The radial plot thus obtained is worked in the office to interpolate points of equal elevation for contour mapping.
  • 36.
    Interpolation of contours: •Drawing contour lines to produce a contouring of an area requires the process of interpolation between points. • Interpolation process means spacing the contours proportionally between the plotted ground points. • Contours can be interpolated by : 1. By estimation method 2. By arithmetical calculation method 3. By graphical method
  • 37.
    1. Estimatiom method: The position of contour points between ground points are estimated.  The contour lines are then drawn through these points.  This method is used for rough and usually used on small scale maps.  Interpolating can be done by estimation for low precision maps.
  • 38.
    2. Arithmetical calculationmethod:  This method is employed when greater accuracy is required.  This is time consuming also.  Positions of contours points among guide points are located by arithmetic calculations.  Formula is given below: elevationobetween twDistance elevationLow-elevationHigh elevationCentral-elevationHigh =% 
  • 39.
    3. Graphical method: When higher accuracy is required and many contours are to be made, this method is employed.  This method of interpolation proves to be rapid and easy.  For this purpose a tracing paper is used.