Downloaded 28 times

![Incremental increase method…
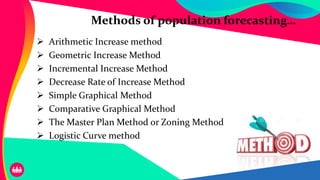
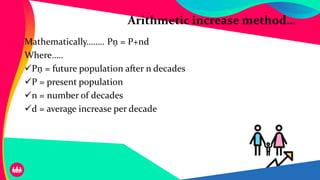
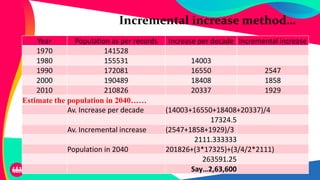
Mathematically…….. Pņ=𝑃+𝑛𝑑+[(𝑛 /𝑛+1) /2]𝑡
Where,
Pņ = future population after n decades
P = present population
t = average incremental increase per decade
d = average increase in population per decade](https://image.slidesharecdn.com/populationforecastingexamples-200810153430/85/Calculating-future-population-using-Population-forecasting-methods-9-320.jpg)
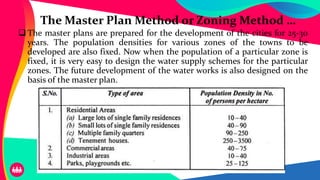
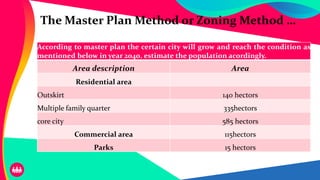
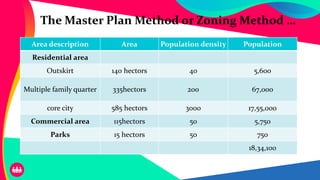


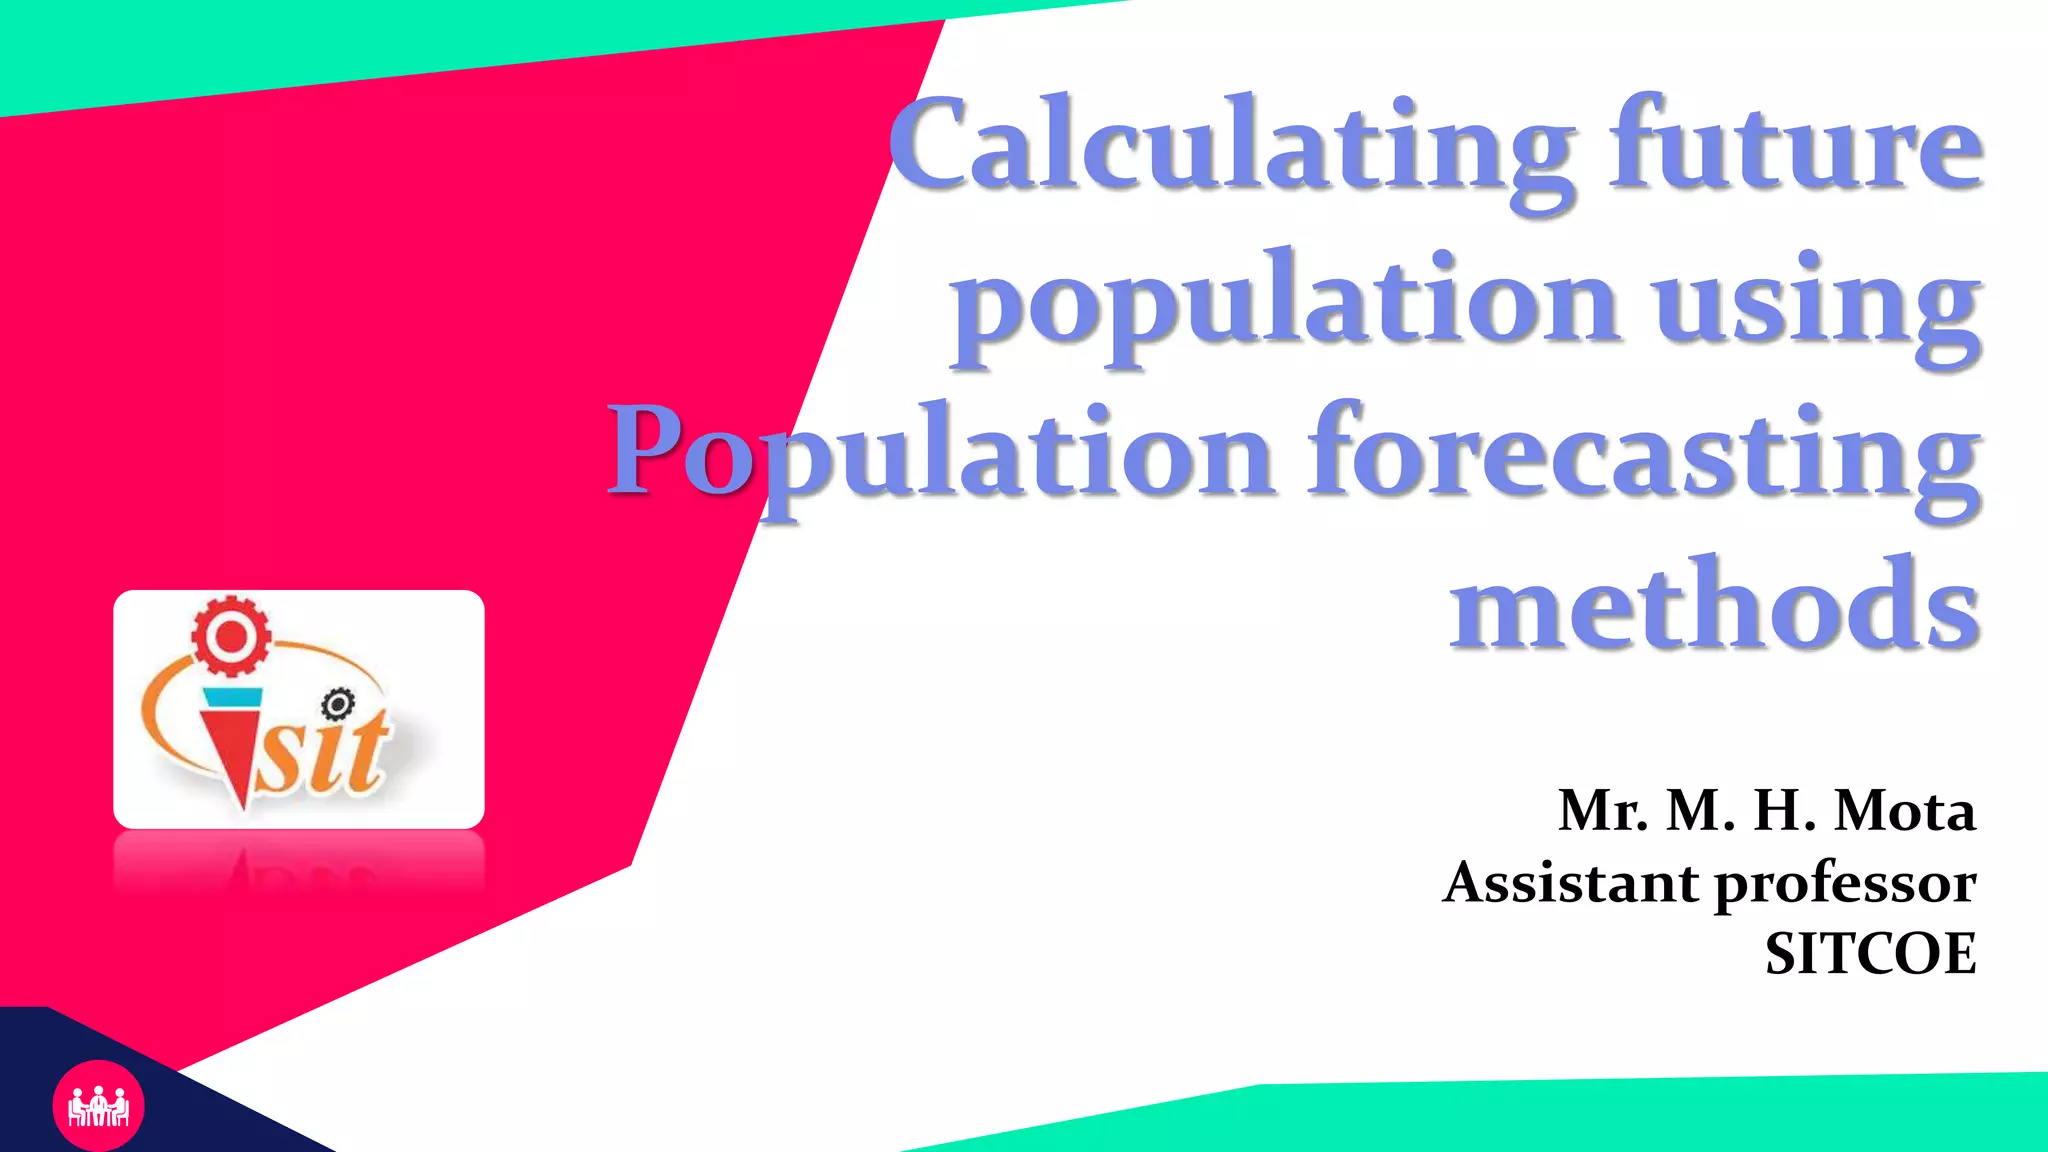
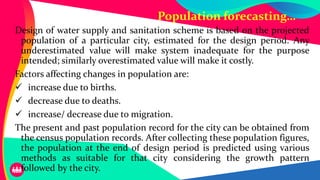
This document discusses various methods of population forecasting to estimate future populations for city planning, essential for designing water supply and sanitation schemes. It outlines methods including arithmetic increase, geometric increase, incremental increase, and graphical methods, highlighting their mathematical formulas and application processes. Emphasis is placed on selecting an appropriate method based on the city's historical growth patterns to ensure accurate population projections.


![[Deck] What's New in Spark-Iceberg Integration via DSV2.pptx](https://cdn.slidesharecdn.com/ss_thumbnails/deckwhatsnewinspark-icebergintegrationviadsv2-260210005337-25955b12-thumbnail.jpg?width=640&height=640&fit=bounds)