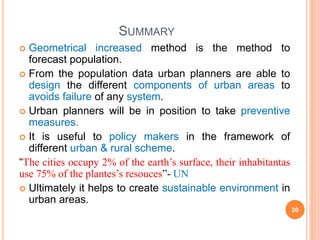
SlideShare a Scribd company logo
METHODS OF POPULATION FORECASTING
Faculty advisor:
Dr. J.E.M. Macwan
Sustainable Urban Planning Practices- (CE 632)
Prepared by
Kaushik Sheladiya
(P18UP004)
PG SECTION,URBAN PLANNING
CIVIL ENGINEERING DEPARTMENT, M.TECH-I, SEMESTER-II
2019
1
CONTENTS
 Introduction
 Objectives
 Factors affecting population forecasting
 Methods of Population forecasting
 Demographic Details of cities
 Forecasted population of cities(Ahmedabad, Surat,
Vadodara)
 Application
 Summary
References
2
INTRODUCTION
 This presentation deals with study of population
mathematics.
 It explains how various factors affects the population
growth and how to forecast population for different
cities.
 How urban planner can use that forecasted data for
planning of areas is also included.
 Population is forecasted for three main cities of Gujarat
for the census 2021 & 2031.
3
OBJECTIVES
 To estimate the growth rate of population in given city
 To compare different methods for estimating
population
 To estimate the carrying capacity of the city & plan the
city according to its carrying capacity
 To judge & implement the existing resource
management strategies based on the predicted
population
4
FACTORS AFFECTING POPULATION GROWTH
 Births Rate
 Deaths Rate
 Migration Rate
 Income & Education of people.
5
AERITHMATICAL INCREASE METHOD
 This method is based on the assumption that the rate of change
of population with time is constant.
 This method is suitable for large and old city with considerable
development. If it is used for small, average or comparatively
new cities, it will give lower population estimate than actual
value.
 In this method the average increase in population per decade is
calculated from the past census reports. This increase is added
to the present population to find out the population of the next
decade.
 Thus, it is assumed that the population is increasing at constant
rate.
 Hence, dP/dt = C i.e., rate of change of population with respect
to time is constant.
 Therefore, Population after nth decade will be,
Pn= P + n.C
Where, Pn = population after ‘n’ decades
P = present population. 6
GEOMETRICAL INCREASE METHOD
 In this method the percentage increase in population from
decade to decade is assumed to remain constant.
 Geometric mean increase is used to find out the future
increment in population.
 Since this method gives higher values and hence should be
applied for a new industrial town at the beginning of
development for only few decades.
Pn = P (1+ IG/100)n
Where, IG = geometric mean (%)
P = Present population
n = no. of decades.
7
INCREMENTAL INCREASE METHOD
 Suitable for an average size town under normal condition
where the growth rate is found to be in increasing order.
 Increase in increment is considered for calculating future
population.
 The incremental increase is determined for each decade from
the past population and the average value is added to the
present population along with the average rate of increase.
Hence, population after nth decade,
Pn = P+ n.X + {n (n+1)/2}.Y
Where, Pn = Population after nth decade
X = Average increase
Y = Incremental increase
8
GRAPHICAL METHOD
 Populations of last few decades
are correctly plotted to a suitable
scale on graph.
 The population curve is smoothly
extended for getting future
population.
 This extension should be done
carefully and it requires proper
experience and judgment.
 The best way of applying this
method is to extend the curve by
comparing with population curve of
some other similar cities having
the similar growth condition.
9
Fig.1 Graphical
Method of forecasting
MASTER PLAN METHOD
 The big and metropolitan cities are generally not
developed in haphazard manner, but are planned and
regulated by local bodies according to master plan.
 The master plan is prepared for next 20 to 30 years for
the city.
 According to the master plan the city is divided into
various zones such as residence, commerce and
industry.
 The population densities are fixed for various zones in
the master plan.
 From this population density total water demand and
wastewater generation for that zone can be worked out.
 By this method it is very easy to access precisely the
design population.
10
LOGISTIC CURVE METHOD
 This method is used when the growth rate of
population due to births, deaths and migrations
takes place under normal situation.
 If the population of a city is plotted with respect to
time, the curve so obtained under normal condition
looks like S-shaped curve and is known as logistic
curve
11
Fig.2 Logistic curve for
population growth
 Predict the population for the year 2011,2021 and 2031 from the
following population data by Arithmetic Increase method.
Solution:-
Pn=P + n.C
P2011 = 24,33,835 + 1x6,54,060 = 30,87,895
P2021 = 24,33,835 + 2x6,54,060 = 37,41,955
P2031 = 24,33,835 + 3x6,54,060 = 43,96,015
Year 1971 1981 1991 2001
Population 471656 776583 1497817 2433835
12
 Predict the population for the year 2011,2021 and 2031
from the following population data by Geometrical
increase method.
Solution:-
Pn = P (1+ IG/100)n
P2011 = 2433835(1+0.73)1 = 42,10,534 (as per census 2011;44,66,826)
P2021 = 2433835(1+0.73)2 = 72,84,224
P2031 = 2433835(1+0.73)3 =1,26,01,708
Year 1971 1981 1991 2001
Population 471656 776583 1497817 2433835
R² = 0.9965
0
500000
1000000
1500000
2000000
2500000
3000000
3500000
4000000
4500000
5000000
1971 1981 1991 2001 2011
Population Expon. (Population)
13
 Predict the population for the year 2011,2021 and 2031
from the following population data by Incremental
increase method.
Solution:-
Pn = P+ n.X + {n (n+1)/2}.Y
P2011 = 2433835+1x654060+315546 = 34,03,441
P2021 =2433835+2x654060+3x315546=46,88,593
P2031=2433835+3x654060+6x315546=62,89,291 14
DEMOGRAPHIC DETAILS OF CITIES
Details Ahmedabad Surat Vadodara
Map
(Location
&
Area)
Location Latitude23.03°N
Longitude 72.58° E
Latitude : 21.112°N
Longitude : 72.814°E
Latitude:22° 18′N
Longitude:73° 12′E
Area 466 Sq.km 326.515 sq.km. 300 sq.kms.
Population 55,77,940(Census
year 2011)
44,66,826 (Census
2011)
18,22,221(Census
year 2011)
Density 11,948Persons/Sq.Km.
(Census-2011)
13,680Persons/Sq.Km.
(Census-2011)
6,074Persons/Sq.Km.
(Census-2011)
15
Forecasted Population for Surat city by 2011,2021&2031
(Geometrical increase method)
Pn = P (1+ IG/100)n
P2011 = 2433835(1+0.73)1 = 42,10,534 (as per census 2011;44,66,826)
P2021 = 2433835(1+0.73)2 = 72,84,224
P2031 = 2433835(1+0.73)3 =1,26,01,708
R² = 0.9965
0
500000
1000000
1500000
2000000
2500000
3000000
3500000
4000000
4500000
5000000
1971 1981 1991 2001 2011
Population Expon. (Population)
16
FORECASTED POPULATION FOR AHMEDABAD CITY
BY 2011,2021&2031
(INCREMENTAL INCREASE METHOD)
Pn = P+ n.X + {n (n+1)/2}.Y
P2011 = 4525013+1x858338+1x323807 = 5707158
(as per census 2011; 56,33,927)
P2021 = 4525013+2x858338+3x323807= 7213110
P2031= 4525013+3x858338+6x323807=9042869
17
FORECASTED POPULATION FOR VADODARA CITY BY
2011,2021&2031
(ARITHMETIC INCREASE METHOD)
R² = 0.9955
0
200000
400000
600000
800000
1000000
1200000
1400000
1600000
1800000
2000000
1971 1981 1991 2001 2011
POPULATION
CENSUS YEAR
Forecasted Population for Vadodara
by 2011
Population
Linear
(Population)
Pn=P + n.C
P2011 = 14,91,045 + 1x3,41,348 = 18,32,393 (as per census 2011; 18,22,221)
P2021 = 14,91,045 + 2x3,41,348 = 21,73,741
P2031 = 14,91,045 + 3x3,41,348 = 25,15,089
18
USE OF POPULATION FORECASTING
 Most of the important decisions can be taken about
major land uses and services
 Development Planning like housing, employment
etc.
 Design of water supply and sanitation scheme.
 Projection of labor force for estimating the future
production of goods and services.
 Population Projections by age for requirement of
future school enrolments.
 Future demand for, food, power, water, waste disposal &
transport etc.
 To estimate possible recreational demands
19
SUMMARY
 Geometrical increased method is the method to
forecast population.
 From the population data urban planners are able to
design the different components of urban areas to
avoids failure of any system.
 Urban planners will be in position to take preventive
measures.
 It is useful to policy makers in the framework of
different urban & rural scheme.
“The cities occupy 2% of the earth’s surface, their inhabitantas
use 75% of the plantes’s resouces”- UN
 Ultimately it helps to create sustainable environment in
urban areas.
20
REFERENCES
 Enrico F. and Tomasz Z. (2018), “Survey Sampling and Small-Area Estimation", An
international journal of Mathematical Demography, University of California,vol. 25,pp.
181-183.
 Franceso C. (2015), “Integrating Macro and Micro Level Approaches in the
Explanation of Population Change", An international journal of Demography, University
of California,vol. 69,pp. S11-S20.
 Ghosh M. and Jiyon M. (2018), “ Nonparametric Bays and Empirical Bayes Estimation of
The Population", An international journal of Mathematical Demography, University of
California,vol. 25,pp. 159-167.
 Hallie J. and Louis G. (1996), “Demography and Decision Making", An international
journal of Mathematical Demography, University of Nebraska,vol. 2,pp. 579-584.
 John C. (2013), “World Population Growth; Past, Present, Future", An international
journal of Environmental and Economics, London, vol. 55,pp. 75-82.
 Mauno K. and Jussi H. (2018), “Register Data in Sample Allocations for Small-Area
Estimation", An international journal of Mathematical Demography, University of
California,vol. 25,pp. 1-31.
 Rainford P. and Masser I. (1986), “ Population Forecasting and Urban Planning
Practices: Case Study", Journal of Environmental and Planning, England,vol. 19, pp.
1463-1475.
 Report on “ Understanding and Using Population Projections", Population Reference
Bureau,USA, 2001. 21
THANK YOU
22

More Related Content

Similar to POPULATION FORECASTING.pptx

Population forecasting methods
Population forecasting methodsPopulation forecasting methods
Population forecasting methods
Manoj Mota
 
Sustainable Development_Unit_2.pdf
Sustainable Development_Unit_2.pdfSustainable Development_Unit_2.pdf
Sustainable Development_Unit_2.pdf
RISHABHJAIN27097
 
Application of remote sensing,population identification
Application of remote sensing,population identificationApplication of remote sensing,population identification
Application of remote sensing,population identification
SATISH KUMAR
 
Urban Expansion & Its Association with Population Growth: A Case Study of Raj...
Urban Expansion & Its Association with Population Growth: A Case Study of Raj...Urban Expansion & Its Association with Population Growth: A Case Study of Raj...
Urban Expansion & Its Association with Population Growth: A Case Study of Raj...
washifahmednaqib
 
POPULATION FORECASTING.pptx
POPULATION FORECASTING.pptxPOPULATION FORECASTING.pptx
POPULATION FORECASTING.pptx
DebojitKoleyDCE8852
 
POPULATION FORECASTING.pptx
POPULATION FORECASTING.pptxPOPULATION FORECASTING.pptx
POPULATION FORECASTING.pptx
Shyam Sundar Roy
 
population forecasting
population forecastingpopulation forecasting
population forecasting
Mir Zafarullah
 
Water demand and Population forecasting
Water demand and Population forecastingWater demand and Population forecasting
Water demand and Population forecasting
Shivangi Somvanshi
 
Multi-Scale Urban Analysis Using Remote Sensing and GIS
Multi-Scale Urban Analysis Using Remote Sensing and GISMulti-Scale Urban Analysis Using Remote Sensing and GIS
Multi-Scale Urban Analysis Using Remote Sensing and GIS
CSCJournals
 
Measures of Urbanization
 Measures of Urbanization Measures of Urbanization
Measures of Urbanization
nowaj sharif
 
Methods of population studies
Methods of population studiesMethods of population studies
Methods of population studies
Amira Abdallah
 
Geographical aspect and urban pattern in bangladesh
Geographical aspect and urban pattern in bangladeshGeographical aspect and urban pattern in bangladesh
Geographical aspect and urban pattern in bangladesh
Zoni Chakma
 
1 water demand and source.pptx
1 water demand and source.pptx1 water demand and source.pptx
1 water demand and source.pptx
Dr. Manoj Garg
 
Water demand and population forcasting methods
Water demand and population forcasting methodsWater demand and population forcasting methods
Water demand and population forcasting methods
divyakatal1
 
SMART CITY
SMART CITYSMART CITY
An Empirical Study of the Environmental Kuznets Curve for Environment Quality...
An Empirical Study of the Environmental Kuznets Curve for Environment Quality...An Empirical Study of the Environmental Kuznets Curve for Environment Quality...
An Empirical Study of the Environmental Kuznets Curve for Environment Quality...
ijceronline
 
Analyzing Urban sprawl using Geoinformatics A case study of Pune.pdf
Analyzing Urban sprawl using Geoinformatics  A case study of Pune.pdfAnalyzing Urban sprawl using Geoinformatics  A case study of Pune.pdf
Analyzing Urban sprawl using Geoinformatics A case study of Pune.pdf
Sabrina Green
 
SMART CITY SUSTAINABILITY ANALYSIS
SMART CITY SUSTAINABILITY ANALYSISSMART CITY SUSTAINABILITY ANALYSIS
SMART CITY SUSTAINABILITY ANALYSIS
PraveenKumar4975
 
Development Potential: The Joint Influence of High Population Growth and a ...
Development Potential:  The Joint Influence of High Population Growth  and a ...Development Potential:  The Joint Influence of High Population Growth  and a ...
Development Potential: The Joint Influence of High Population Growth and a ...
Anna McCreery
 

Similar to POPULATION FORECASTING.pptx (20)

Population forecasting methods
Population forecasting methodsPopulation forecasting methods
Population forecasting methods
 
Sustainable Development_Unit_2.pdf
Sustainable Development_Unit_2.pdfSustainable Development_Unit_2.pdf
Sustainable Development_Unit_2.pdf
 
Application of remote sensing,population identification
Application of remote sensing,population identificationApplication of remote sensing,population identification
Application of remote sensing,population identification
 
Urban Expansion & Its Association with Population Growth: A Case Study of Raj...
Urban Expansion & Its Association with Population Growth: A Case Study of Raj...Urban Expansion & Its Association with Population Growth: A Case Study of Raj...
Urban Expansion & Its Association with Population Growth: A Case Study of Raj...
 
population models.pdf
 population models.pdf  population models.pdf
population models.pdf
 
POPULATION FORECASTING.pptx
POPULATION FORECASTING.pptxPOPULATION FORECASTING.pptx
POPULATION FORECASTING.pptx
 
POPULATION FORECASTING.pptx
POPULATION FORECASTING.pptxPOPULATION FORECASTING.pptx
POPULATION FORECASTING.pptx
 
population forecasting
population forecastingpopulation forecasting
population forecasting
 
Water demand and Population forecasting
Water demand and Population forecastingWater demand and Population forecasting
Water demand and Population forecasting
 
Multi-Scale Urban Analysis Using Remote Sensing and GIS
Multi-Scale Urban Analysis Using Remote Sensing and GISMulti-Scale Urban Analysis Using Remote Sensing and GIS
Multi-Scale Urban Analysis Using Remote Sensing and GIS
 
Measures of Urbanization
 Measures of Urbanization Measures of Urbanization
Measures of Urbanization
 
Methods of population studies
Methods of population studiesMethods of population studies
Methods of population studies
 
Geographical aspect and urban pattern in bangladesh
Geographical aspect and urban pattern in bangladeshGeographical aspect and urban pattern in bangladesh
Geographical aspect and urban pattern in bangladesh
 
1 water demand and source.pptx
1 water demand and source.pptx1 water demand and source.pptx
1 water demand and source.pptx
 
Water demand and population forcasting methods
Water demand and population forcasting methodsWater demand and population forcasting methods
Water demand and population forcasting methods
 
SMART CITY
SMART CITYSMART CITY
SMART CITY
 
An Empirical Study of the Environmental Kuznets Curve for Environment Quality...
An Empirical Study of the Environmental Kuznets Curve for Environment Quality...An Empirical Study of the Environmental Kuznets Curve for Environment Quality...
An Empirical Study of the Environmental Kuznets Curve for Environment Quality...
 
Analyzing Urban sprawl using Geoinformatics A case study of Pune.pdf
Analyzing Urban sprawl using Geoinformatics  A case study of Pune.pdfAnalyzing Urban sprawl using Geoinformatics  A case study of Pune.pdf
Analyzing Urban sprawl using Geoinformatics A case study of Pune.pdf
 
SMART CITY SUSTAINABILITY ANALYSIS
SMART CITY SUSTAINABILITY ANALYSISSMART CITY SUSTAINABILITY ANALYSIS
SMART CITY SUSTAINABILITY ANALYSIS
 
Development Potential: The Joint Influence of High Population Growth and a ...
Development Potential:  The Joint Influence of High Population Growth  and a ...Development Potential:  The Joint Influence of High Population Growth  and a ...
Development Potential: The Joint Influence of High Population Growth and a ...
 

Recently uploaded

CME397 Surface Engineering- Professional Elective
CME397 Surface Engineering- Professional ElectiveCME397 Surface Engineering- Professional Elective
CME397 Surface Engineering- Professional Elective
karthi keyan
 
H.Seo, ICLR 2024, MLILAB, KAIST AI.pdf
H.Seo,  ICLR 2024, MLILAB,  KAIST AI.pdfH.Seo,  ICLR 2024, MLILAB,  KAIST AI.pdf
H.Seo, ICLR 2024, MLILAB, KAIST AI.pdf
MLILAB
 
AKS UNIVERSITY Satna Final Year Project By OM Hardaha.pdf
AKS UNIVERSITY Satna Final Year Project By OM Hardaha.pdfAKS UNIVERSITY Satna Final Year Project By OM Hardaha.pdf
AKS UNIVERSITY Satna Final Year Project By OM Hardaha.pdf
SamSarthak3
 
ASME IX(9) 2007 Full Version .pdf
ASME IX(9)  2007 Full Version       .pdfASME IX(9)  2007 Full Version       .pdf
ASME IX(9) 2007 Full Version .pdf
AhmedHussein950959
 
J.Yang, ICLR 2024, MLILAB, KAIST AI.pdf
J.Yang,  ICLR 2024, MLILAB, KAIST AI.pdfJ.Yang,  ICLR 2024, MLILAB, KAIST AI.pdf
J.Yang, ICLR 2024, MLILAB, KAIST AI.pdf
MLILAB
 
Student information management system project report ii.pdf
Student information management system project report ii.pdfStudent information management system project report ii.pdf
Student information management system project report ii.pdf
Kamal Acharya
 
DESIGN A COTTON SEED SEPARATION MACHINE.docx
DESIGN A COTTON SEED SEPARATION MACHINE.docxDESIGN A COTTON SEED SEPARATION MACHINE.docx
DESIGN A COTTON SEED SEPARATION MACHINE.docx
FluxPrime1
 
LIGA(E)11111111111111111111111111111111111111111.ppt
LIGA(E)11111111111111111111111111111111111111111.pptLIGA(E)11111111111111111111111111111111111111111.ppt
LIGA(E)11111111111111111111111111111111111111111.ppt
ssuser9bd3ba
 
Vaccine management system project report documentation..pdf
Vaccine management system project report documentation..pdfVaccine management system project report documentation..pdf
Vaccine management system project report documentation..pdf
Kamal Acharya
 
Sachpazis:Terzaghi Bearing Capacity Estimation in simple terms with Calculati...
Sachpazis:Terzaghi Bearing Capacity Estimation in simple terms with Calculati...Sachpazis:Terzaghi Bearing Capacity Estimation in simple terms with Calculati...
Sachpazis:Terzaghi Bearing Capacity Estimation in simple terms with Calculati...
Dr.Costas Sachpazis
 
一比一原版(SFU毕业证)西蒙菲莎大学毕业证成绩单如何办理
一比一原版(SFU毕业证)西蒙菲莎大学毕业证成绩单如何办理一比一原版(SFU毕业证)西蒙菲莎大学毕业证成绩单如何办理
一比一原版(SFU毕业证)西蒙菲莎大学毕业证成绩单如何办理
bakpo1
 
在线办理(ANU毕业证书)澳洲国立大学毕业证录取通知书一模一样
在线办理(ANU毕业证书)澳洲国立大学毕业证录取通知书一模一样在线办理(ANU毕业证书)澳洲国立大学毕业证录取通知书一模一样
在线办理(ANU毕业证书)澳洲国立大学毕业证录取通知书一模一样
obonagu
 
Cosmetic shop management system project report.pdf
Cosmetic shop management system project report.pdfCosmetic shop management system project report.pdf
Cosmetic shop management system project report.pdf
Kamal Acharya
 
Courier management system project report.pdf
Courier management system project report.pdfCourier management system project report.pdf
Courier management system project report.pdf
Kamal Acharya
 
weather web application report.pdf
weather web application report.pdfweather web application report.pdf
weather web application report.pdf
Pratik Pawar
 
Immunizing Image Classifiers Against Localized Adversary Attacks
Immunizing Image Classifiers Against Localized Adversary AttacksImmunizing Image Classifiers Against Localized Adversary Attacks
Immunizing Image Classifiers Against Localized Adversary Attacks
gerogepatton
 
Final project report on grocery store management system..pdf
Final project report on grocery store management system..pdfFinal project report on grocery store management system..pdf
Final project report on grocery store management system..pdf
Kamal Acharya
 
Gen AI Study Jams _ For the GDSC Leads in India.pdf
Gen AI Study Jams _ For the GDSC Leads in India.pdfGen AI Study Jams _ For the GDSC Leads in India.pdf
Gen AI Study Jams _ For the GDSC Leads in India.pdf
gdsczhcet
 
NO1 Uk best vashikaran specialist in delhi vashikaran baba near me online vas...
NO1 Uk best vashikaran specialist in delhi vashikaran baba near me online vas...NO1 Uk best vashikaran specialist in delhi vashikaran baba near me online vas...
NO1 Uk best vashikaran specialist in delhi vashikaran baba near me online vas...
Amil Baba Dawood bangali
 
Water Industry Process Automation and Control Monthly - May 2024.pdf
Water Industry Process Automation and Control Monthly - May 2024.pdfWater Industry Process Automation and Control Monthly - May 2024.pdf
Water Industry Process Automation and Control Monthly - May 2024.pdf
Water Industry Process Automation & Control
 

Recently uploaded (20)

CME397 Surface Engineering- Professional Elective
CME397 Surface Engineering- Professional ElectiveCME397 Surface Engineering- Professional Elective
CME397 Surface Engineering- Professional Elective
 
H.Seo, ICLR 2024, MLILAB, KAIST AI.pdf
H.Seo,  ICLR 2024, MLILAB,  KAIST AI.pdfH.Seo,  ICLR 2024, MLILAB,  KAIST AI.pdf
H.Seo, ICLR 2024, MLILAB, KAIST AI.pdf
 
AKS UNIVERSITY Satna Final Year Project By OM Hardaha.pdf
AKS UNIVERSITY Satna Final Year Project By OM Hardaha.pdfAKS UNIVERSITY Satna Final Year Project By OM Hardaha.pdf
AKS UNIVERSITY Satna Final Year Project By OM Hardaha.pdf
 
ASME IX(9) 2007 Full Version .pdf
ASME IX(9)  2007 Full Version       .pdfASME IX(9)  2007 Full Version       .pdf
ASME IX(9) 2007 Full Version .pdf
 
J.Yang, ICLR 2024, MLILAB, KAIST AI.pdf
J.Yang,  ICLR 2024, MLILAB, KAIST AI.pdfJ.Yang,  ICLR 2024, MLILAB, KAIST AI.pdf
J.Yang, ICLR 2024, MLILAB, KAIST AI.pdf
 
Student information management system project report ii.pdf
Student information management system project report ii.pdfStudent information management system project report ii.pdf
Student information management system project report ii.pdf
 
DESIGN A COTTON SEED SEPARATION MACHINE.docx
DESIGN A COTTON SEED SEPARATION MACHINE.docxDESIGN A COTTON SEED SEPARATION MACHINE.docx
DESIGN A COTTON SEED SEPARATION MACHINE.docx
 
LIGA(E)11111111111111111111111111111111111111111.ppt
LIGA(E)11111111111111111111111111111111111111111.pptLIGA(E)11111111111111111111111111111111111111111.ppt
LIGA(E)11111111111111111111111111111111111111111.ppt
 
Vaccine management system project report documentation..pdf
Vaccine management system project report documentation..pdfVaccine management system project report documentation..pdf
Vaccine management system project report documentation..pdf
 
Sachpazis:Terzaghi Bearing Capacity Estimation in simple terms with Calculati...
Sachpazis:Terzaghi Bearing Capacity Estimation in simple terms with Calculati...Sachpazis:Terzaghi Bearing Capacity Estimation in simple terms with Calculati...
Sachpazis:Terzaghi Bearing Capacity Estimation in simple terms with Calculati...
 
一比一原版(SFU毕业证)西蒙菲莎大学毕业证成绩单如何办理
一比一原版(SFU毕业证)西蒙菲莎大学毕业证成绩单如何办理一比一原版(SFU毕业证)西蒙菲莎大学毕业证成绩单如何办理
一比一原版(SFU毕业证)西蒙菲莎大学毕业证成绩单如何办理
 
在线办理(ANU毕业证书)澳洲国立大学毕业证录取通知书一模一样
在线办理(ANU毕业证书)澳洲国立大学毕业证录取通知书一模一样在线办理(ANU毕业证书)澳洲国立大学毕业证录取通知书一模一样
在线办理(ANU毕业证书)澳洲国立大学毕业证录取通知书一模一样
 
Cosmetic shop management system project report.pdf
Cosmetic shop management system project report.pdfCosmetic shop management system project report.pdf
Cosmetic shop management system project report.pdf
 
Courier management system project report.pdf
Courier management system project report.pdfCourier management system project report.pdf
Courier management system project report.pdf
 
weather web application report.pdf
weather web application report.pdfweather web application report.pdf
weather web application report.pdf
 
Immunizing Image Classifiers Against Localized Adversary Attacks
Immunizing Image Classifiers Against Localized Adversary AttacksImmunizing Image Classifiers Against Localized Adversary Attacks
Immunizing Image Classifiers Against Localized Adversary Attacks
 
Final project report on grocery store management system..pdf
Final project report on grocery store management system..pdfFinal project report on grocery store management system..pdf
Final project report on grocery store management system..pdf
 
Gen AI Study Jams _ For the GDSC Leads in India.pdf
Gen AI Study Jams _ For the GDSC Leads in India.pdfGen AI Study Jams _ For the GDSC Leads in India.pdf
Gen AI Study Jams _ For the GDSC Leads in India.pdf
 
NO1 Uk best vashikaran specialist in delhi vashikaran baba near me online vas...
NO1 Uk best vashikaran specialist in delhi vashikaran baba near me online vas...NO1 Uk best vashikaran specialist in delhi vashikaran baba near me online vas...
NO1 Uk best vashikaran specialist in delhi vashikaran baba near me online vas...
 
Water Industry Process Automation and Control Monthly - May 2024.pdf
Water Industry Process Automation and Control Monthly - May 2024.pdfWater Industry Process Automation and Control Monthly - May 2024.pdf
Water Industry Process Automation and Control Monthly - May 2024.pdf
 

POPULATION FORECASTING.pptx

  • 1. METHODS OF POPULATION FORECASTING Faculty advisor: Dr. J.E.M. Macwan Sustainable Urban Planning Practices- (CE 632) Prepared by Kaushik Sheladiya (P18UP004) PG SECTION,URBAN PLANNING CIVIL ENGINEERING DEPARTMENT, M.TECH-I, SEMESTER-II 2019 1
  • 2. CONTENTS  Introduction  Objectives  Factors affecting population forecasting  Methods of Population forecasting  Demographic Details of cities  Forecasted population of cities(Ahmedabad, Surat, Vadodara)  Application  Summary References 2
  • 3. INTRODUCTION  This presentation deals with study of population mathematics.  It explains how various factors affects the population growth and how to forecast population for different cities.  How urban planner can use that forecasted data for planning of areas is also included.  Population is forecasted for three main cities of Gujarat for the census 2021 & 2031. 3
  • 4. OBJECTIVES  To estimate the growth rate of population in given city  To compare different methods for estimating population  To estimate the carrying capacity of the city & plan the city according to its carrying capacity  To judge & implement the existing resource management strategies based on the predicted population 4
  • 5. FACTORS AFFECTING POPULATION GROWTH  Births Rate  Deaths Rate  Migration Rate  Income & Education of people. 5
  • 6. AERITHMATICAL INCREASE METHOD  This method is based on the assumption that the rate of change of population with time is constant.  This method is suitable for large and old city with considerable development. If it is used for small, average or comparatively new cities, it will give lower population estimate than actual value.  In this method the average increase in population per decade is calculated from the past census reports. This increase is added to the present population to find out the population of the next decade.  Thus, it is assumed that the population is increasing at constant rate.  Hence, dP/dt = C i.e., rate of change of population with respect to time is constant.  Therefore, Population after nth decade will be, Pn= P + n.C Where, Pn = population after ‘n’ decades P = present population. 6
  • 7. GEOMETRICAL INCREASE METHOD  In this method the percentage increase in population from decade to decade is assumed to remain constant.  Geometric mean increase is used to find out the future increment in population.  Since this method gives higher values and hence should be applied for a new industrial town at the beginning of development for only few decades. Pn = P (1+ IG/100)n Where, IG = geometric mean (%) P = Present population n = no. of decades. 7
  • 8. INCREMENTAL INCREASE METHOD  Suitable for an average size town under normal condition where the growth rate is found to be in increasing order.  Increase in increment is considered for calculating future population.  The incremental increase is determined for each decade from the past population and the average value is added to the present population along with the average rate of increase. Hence, population after nth decade, Pn = P+ n.X + {n (n+1)/2}.Y Where, Pn = Population after nth decade X = Average increase Y = Incremental increase 8
  • 9. GRAPHICAL METHOD  Populations of last few decades are correctly plotted to a suitable scale on graph.  The population curve is smoothly extended for getting future population.  This extension should be done carefully and it requires proper experience and judgment.  The best way of applying this method is to extend the curve by comparing with population curve of some other similar cities having the similar growth condition. 9 Fig.1 Graphical Method of forecasting
  • 10. MASTER PLAN METHOD  The big and metropolitan cities are generally not developed in haphazard manner, but are planned and regulated by local bodies according to master plan.  The master plan is prepared for next 20 to 30 years for the city.  According to the master plan the city is divided into various zones such as residence, commerce and industry.  The population densities are fixed for various zones in the master plan.  From this population density total water demand and wastewater generation for that zone can be worked out.  By this method it is very easy to access precisely the design population. 10
  • 11. LOGISTIC CURVE METHOD  This method is used when the growth rate of population due to births, deaths and migrations takes place under normal situation.  If the population of a city is plotted with respect to time, the curve so obtained under normal condition looks like S-shaped curve and is known as logistic curve 11 Fig.2 Logistic curve for population growth
  • 12.  Predict the population for the year 2011,2021 and 2031 from the following population data by Arithmetic Increase method. Solution:- Pn=P + n.C P2011 = 24,33,835 + 1x6,54,060 = 30,87,895 P2021 = 24,33,835 + 2x6,54,060 = 37,41,955 P2031 = 24,33,835 + 3x6,54,060 = 43,96,015 Year 1971 1981 1991 2001 Population 471656 776583 1497817 2433835 12
  • 13.  Predict the population for the year 2011,2021 and 2031 from the following population data by Geometrical increase method. Solution:- Pn = P (1+ IG/100)n P2011 = 2433835(1+0.73)1 = 42,10,534 (as per census 2011;44,66,826) P2021 = 2433835(1+0.73)2 = 72,84,224 P2031 = 2433835(1+0.73)3 =1,26,01,708 Year 1971 1981 1991 2001 Population 471656 776583 1497817 2433835 R² = 0.9965 0 500000 1000000 1500000 2000000 2500000 3000000 3500000 4000000 4500000 5000000 1971 1981 1991 2001 2011 Population Expon. (Population) 13
  • 14.  Predict the population for the year 2011,2021 and 2031 from the following population data by Incremental increase method. Solution:- Pn = P+ n.X + {n (n+1)/2}.Y P2011 = 2433835+1x654060+315546 = 34,03,441 P2021 =2433835+2x654060+3x315546=46,88,593 P2031=2433835+3x654060+6x315546=62,89,291 14
  • 15. DEMOGRAPHIC DETAILS OF CITIES Details Ahmedabad Surat Vadodara Map (Location & Area) Location Latitude23.03°N Longitude 72.58° E Latitude : 21.112°N Longitude : 72.814°E Latitude:22° 18′N Longitude:73° 12′E Area 466 Sq.km 326.515 sq.km. 300 sq.kms. Population 55,77,940(Census year 2011) 44,66,826 (Census 2011) 18,22,221(Census year 2011) Density 11,948Persons/Sq.Km. (Census-2011) 13,680Persons/Sq.Km. (Census-2011) 6,074Persons/Sq.Km. (Census-2011) 15
  • 16. Forecasted Population for Surat city by 2011,2021&2031 (Geometrical increase method) Pn = P (1+ IG/100)n P2011 = 2433835(1+0.73)1 = 42,10,534 (as per census 2011;44,66,826) P2021 = 2433835(1+0.73)2 = 72,84,224 P2031 = 2433835(1+0.73)3 =1,26,01,708 R² = 0.9965 0 500000 1000000 1500000 2000000 2500000 3000000 3500000 4000000 4500000 5000000 1971 1981 1991 2001 2011 Population Expon. (Population) 16
  • 17. FORECASTED POPULATION FOR AHMEDABAD CITY BY 2011,2021&2031 (INCREMENTAL INCREASE METHOD) Pn = P+ n.X + {n (n+1)/2}.Y P2011 = 4525013+1x858338+1x323807 = 5707158 (as per census 2011; 56,33,927) P2021 = 4525013+2x858338+3x323807= 7213110 P2031= 4525013+3x858338+6x323807=9042869 17
  • 18. FORECASTED POPULATION FOR VADODARA CITY BY 2011,2021&2031 (ARITHMETIC INCREASE METHOD) R² = 0.9955 0 200000 400000 600000 800000 1000000 1200000 1400000 1600000 1800000 2000000 1971 1981 1991 2001 2011 POPULATION CENSUS YEAR Forecasted Population for Vadodara by 2011 Population Linear (Population) Pn=P + n.C P2011 = 14,91,045 + 1x3,41,348 = 18,32,393 (as per census 2011; 18,22,221) P2021 = 14,91,045 + 2x3,41,348 = 21,73,741 P2031 = 14,91,045 + 3x3,41,348 = 25,15,089 18
  • 19. USE OF POPULATION FORECASTING  Most of the important decisions can be taken about major land uses and services  Development Planning like housing, employment etc.  Design of water supply and sanitation scheme.  Projection of labor force for estimating the future production of goods and services.  Population Projections by age for requirement of future school enrolments.  Future demand for, food, power, water, waste disposal & transport etc.  To estimate possible recreational demands 19
  • 20. SUMMARY  Geometrical increased method is the method to forecast population.  From the population data urban planners are able to design the different components of urban areas to avoids failure of any system.  Urban planners will be in position to take preventive measures.  It is useful to policy makers in the framework of different urban & rural scheme. “The cities occupy 2% of the earth’s surface, their inhabitantas use 75% of the plantes’s resouces”- UN  Ultimately it helps to create sustainable environment in urban areas. 20
  • 21. REFERENCES  Enrico F. and Tomasz Z. (2018), “Survey Sampling and Small-Area Estimation", An international journal of Mathematical Demography, University of California,vol. 25,pp. 181-183.  Franceso C. (2015), “Integrating Macro and Micro Level Approaches in the Explanation of Population Change", An international journal of Demography, University of California,vol. 69,pp. S11-S20.  Ghosh M. and Jiyon M. (2018), “ Nonparametric Bays and Empirical Bayes Estimation of The Population", An international journal of Mathematical Demography, University of California,vol. 25,pp. 159-167.  Hallie J. and Louis G. (1996), “Demography and Decision Making", An international journal of Mathematical Demography, University of Nebraska,vol. 2,pp. 579-584.  John C. (2013), “World Population Growth; Past, Present, Future", An international journal of Environmental and Economics, London, vol. 55,pp. 75-82.  Mauno K. and Jussi H. (2018), “Register Data in Sample Allocations for Small-Area Estimation", An international journal of Mathematical Demography, University of California,vol. 25,pp. 1-31.  Rainford P. and Masser I. (1986), “ Population Forecasting and Urban Planning Practices: Case Study", Journal of Environmental and Planning, England,vol. 19, pp. 1463-1475.  Report on “ Understanding and Using Population Projections", Population Reference Bureau,USA, 2001. 21