Download to read offline

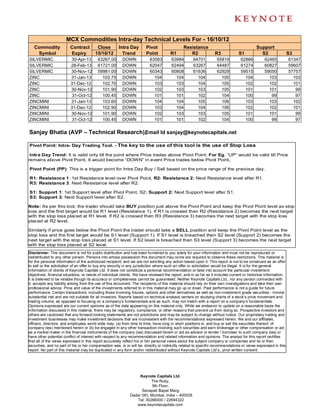

The document provides daily technical analysis for various commodities traded on the MCX exchange in India. It lists the commodity, contract expiration date, previous day's close price, identified intraday trend, pivot point, and resistance and support price levels. The technical analysis is intended to help traders identify potential price movement and trading opportunities for the day.


