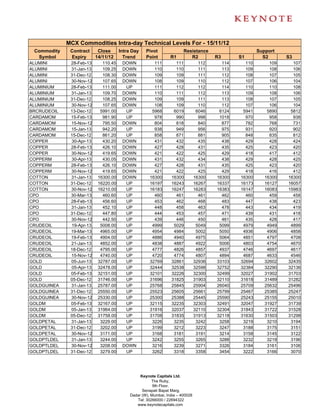
2. MCX Commodities Intra-day Technical Levels For - 15/11/12
Commodity Contract Close Intra Day Pivot Resistance Support
Symbol Expiry 14/11/12 Trend Point R1 R2 R3 S1 S2 S3
KAPAS 30-Mar-13 948.40 UP 948 951 953 957 946 944 940
KAPAS 30-Apr-13 973.60 UP 973 975 977 981 971 969 965
KAPASKHALI 28-Feb-13 1498.50 DOWN 1499 1500 1502 1505 1497 1496 1493
KAPASKHALI 31-Jan-13 1475.00 DOWN 1477 1481 1486 1495 1472 1468 1459
KAPASKHALI 31-Dec-12 1465.50 DOWN 1467 1469 1472 1478 1463 1461 1456
LEAD 28-Feb-13 119.10 DOWN 119 119 120 121 119 118 118
LEAD 31-Jan-13 119.50 UP 119 120 120 121 119 118 117
LEAD 31-Dec-12 119.55 UP 119 120 121 123 119 118 116
LEAD 30-Nov-12 120.00 UP 120 121 122 124 119 118 116
LEADMINI 28-Feb-13 119.25 UP 119 120 120 121 119 118 117
LEADMINI 31-Jan-13 119.25 UP 119 120 121 122 118 118 116
LEADMINI 31-Dec-12 119.50 UP 119 120 121 122 119 118 116
LEADMINI 30-Nov-12 120.00 UP 120 121 122 124 119 118 116
MENTHAOIL 28-Feb-13 1219.30 DOWN 1220 1223 1227 1234 1216 1213 1206
MENTHAOIL 31-Jan-13 1215.00 DOWN 1215 1221 1226 1237 1209 1204 1193
MENTHAOIL 31-Dec-12 1201.60 DOWN 1205 1211 1220 1235 1196 1190 1175
MENTHAOIL 30-Nov-12 1188.30 DOWN 1191 1197 1206 1221 1182 1176 1162
NATURALGAS 28-Jan-13 217.70 UP 217 220 222 227 215 213 208
NATURALGAS 26-Dec-12 216.00 UP 215 219 221 227 213 209 203
NATURALGAS 27-Nov-12 208.50 UP 208 212 215 222 204 200 193
NICKEL 28-Feb-13 918.60 DOWN 919 919 920 921 918 917 916
NICKEL 31-Jan-13 905.60 DOWN 907 910 913 920 903 900 893
NICKEL 31-Dec-12 895.30 DOWN 896 900 905 914 891 887 878
NICKEL 30-Nov-12 887.40 DOWN 888 892 897 906 884 880 871
NICKELM 28-Feb-13 917.90 UP 918 920 923 927 915 913 908
NICKELM 31-Jan-13 906.20 DOWN 907 910 915 922 903 900 892
NICKELM 31-Dec-12 895.60 DOWN 897 900 905 913 892 889 881
NICKELM 30-Nov-12 887.50 DOWN 888 893 899 910 882 876 865
POTATO 15-Apr-13 701.60 DOWN 703 709 715 728 696 691 679
POTATO 15-Mar-13 729.30 UP 729 731 733 737 727 725 722
SILVER 04-May-13 64669.00 UP 64506 64913 65156 65806 64263 63856 63206
SILVER 05-Mar-13 63211.00 UP 62995 63490 63769 64543 62716 62221 61447
SILVER 05-Dec-12 61375.00 UP 61168 61657 61938 62708 60887 60398 59628
SILVER1000 31-Dec-12 61367.00 UP 61274 61644 61922 62570 60996 60626 59978
SILVER1000 30-Nov-12 61166.00 UP 61020 61434 61702 62384 60752 60338 59656
SILVERM 30-Apr-13 64672.00 UP 64496 64930 65187 65878 64239 63805 63114
SILVERM 28-Feb-13 63211.00 UP 63016 63485 63759 64502 62742 62273 61530
SILVERM 30-Nov-12 61375.00 UP 61170 61655 61936 62702 60889 60404 59638
SILVERMIC 30-Apr-13 64663.00 UP 64482 64913 65164 65846 64231 63800 63118
SILVERMIC 28-Feb-13 63200.00 UP 63009 63469 63737 64465 62741 62281 61553
SILVERMIC 30-Nov-12 61374.00 UP 61170 61654 61934 62698 60890 60406 59642
STEELRPR 18-Jan-13 31100.00 UP 31007 31243 31387 31767 30863 30627 30247
STEELRPR 20-Dec-12 30800.00 UP 30663 31017 31233 31803 30447 30093 29523
ZINC 28-Feb-13 108.25 UP 108 109 109 110 108 107 106
ZINC 31-Jan-13 107.40 DOWN 107 108 109 110 107 106 105
ZINC 31-Dec-12 106.40 DOWN 107 107 108 109 106 105 104
Keynote Capitals Ltd.
The Ruby,
9th Floor,
Senapati Bapat Marg,
Dadar (W), Mumbai, India – 400028
Tel: 30266000 / 22694322
www.keynotecapitals.com
3. MCX Commodities Intra-day Technical Levels For - 15/11/12
Commodity Contract Close Intra Day Pivot Resistance Support
Symbol Expiry 14/11/12 Trend Point R1 R2 R3 S1 S2 S3
ZINC 30-Nov-12 105.50 DOWN 106 106 107 109 105 104 102
ZINCMINI 28-Feb-13 108.15 UP 108 109 109 110 108 107 106
ZINCMINI 31-Jan-13 107.45 UP 107 108 109 110 107 106 105
ZINCMINI 31-Dec-12 106.45 UP 106 107 108 110 106 105 103
ZINCMINI 30-Nov-12 105.55 UP 106 107 108 110 104 103 101
Sanjay Bhatia (AVP – Technical Research), Email Id sanjay@keynotecapitals.net
Pivot Point: Intra- Day Trading Tool. - The key to the use of this tool is the use of Stop Loss
Intra Day Trend: It is valid only till the point where Price trades above Pivot Point. For Eg. “UP” would be valid till Price
remains above Pivot Point. It would become “DOWN” in event Price trades below Pivot Point.
Pivot Point (PP): This is a trigger point for Intra Day Buy / Sell based on the price range of the previous day.
R1: Resistance 1: 1st Resistance level over Pivot Point, R2: Resistance 2: Next Resistance level after R1.
R3: Resistance 3: Next Resistance level after R2.
S1: Support 1: 1st Support level after Pivot Point, S2: Support 2: Next Support level after S1.
S3: Support 3: Next Support level after S2.
Note: As per this tool, the trader should take BUY position just above the Pivot Point and keep the Pivot Point level as stop
loss and the first target would be R1 level (Resistance 1). If R1 is crossed then R2 (Resistance 2) becomes the next target
with the stop loss placed at R1 level. If R2 is crossed then R3 (Resistance 3) becomes the next target with the stop loss
placed at R2 level.
Similarly if price goes below the Pivot Point the trader should take a SELL position and keep the Pivot Point level as the
stop loss and the first target would be S1 level (Support 1). If S1 level is breached then S2 level (Support 2) becomes the
next target with the stop loss placed at S1 level. If S2 level is breached then S3 level (Support 3) becomes the next target
with the stop loss placed at S2 level.
Disclaimer: This document is not for public distribution and has been furnished to you solely for your information and must not be reproduced or
redistributed to any other person. Persons into whose possession this document may come are required to observe these restrictions. This material is
for the personal information of the authorized recipient, and we are not soliciting any action based upon it. This report is not to be construed as an offer
to sell or the solicitation of an offer to buy any security in any jurisdiction where such an offer or solicitation would be illegal. It is for the general
information of clients of Keynote Capitals Ltd. It does not constitute a personal recommendation or take into account the particular investment
objectives, financial situations, or needs of individual clients. We have reviewed the report, and in so far as it includes current or historical information,
it is believed to be reliable though its accuracy or completeness cannot be guaranteed. Neither Keynote Capitals Ltd., nor any person connected with
it, accepts any liability arising from the use of this document. The recipients of this material should rely on their own investigations and take their own
professional advice. Price and value of the investments referred to in this material may go up or down. Past performance is not a guide for future
performance. Certain transactions -including those involving futures, options and other derivatives as well as non-investment grade securities - involve
substantial risk and are not suitable for all investors. Reports based on technical analysis centers on studying charts of a stock’s price movement and
trading volume, as opposed to focusing on a company’s fundamentals and as such, may not match with a report on a company’s fundamentals.
Opinions expressed are our current opinions as of the date appearing on this material only. While we endeavor to update on a reasonable basis the
information discussed in this material, there may be regulatory, compliance, or other reasons that prevent us from doing so. Prospective investors and
others are cautioned that any forward-looking statements are not predictions and may be subject to change without notice. Our proprietary trading and
investment businesses may make investment decisions that are inconsistent with the recommendations expressed herein. We and our affiliates,
officers, directors, and employees world wide may: (a) from time to time, have long or short positions in, and buy or sell the securities thereof, of
company (ies) mentioned herein or (b) be engaged in any other transaction involving such securities and earn brokerage or other compensation or act
as a market maker in the financial instruments of the company (ies) discussed herein or act as advisor or lender / borrower to such company (ies) or
have other potential conflict of interest with respect to any recommendation and related information and opinions. The analyst for this report certifies
that all of the views expressed in this report accurately reflect his or her personal views about the subject company or companies and its or their
securities, and no part of his or her compensation was, is or will be, directly or indirectly related to specific recommendations or views expressed in this
report. No part of this material may be duplicated in any form and/or redistributed without Keynote Capitals Ltd’s., prior written consent.
Keynote Capitals Ltd.
The Ruby,
9th Floor,
Senapati Bapat Marg,
Dadar (W), Mumbai, India – 400028
Tel: 30266000 / 22694322
www.keynotecapitals.com