Download to read offline

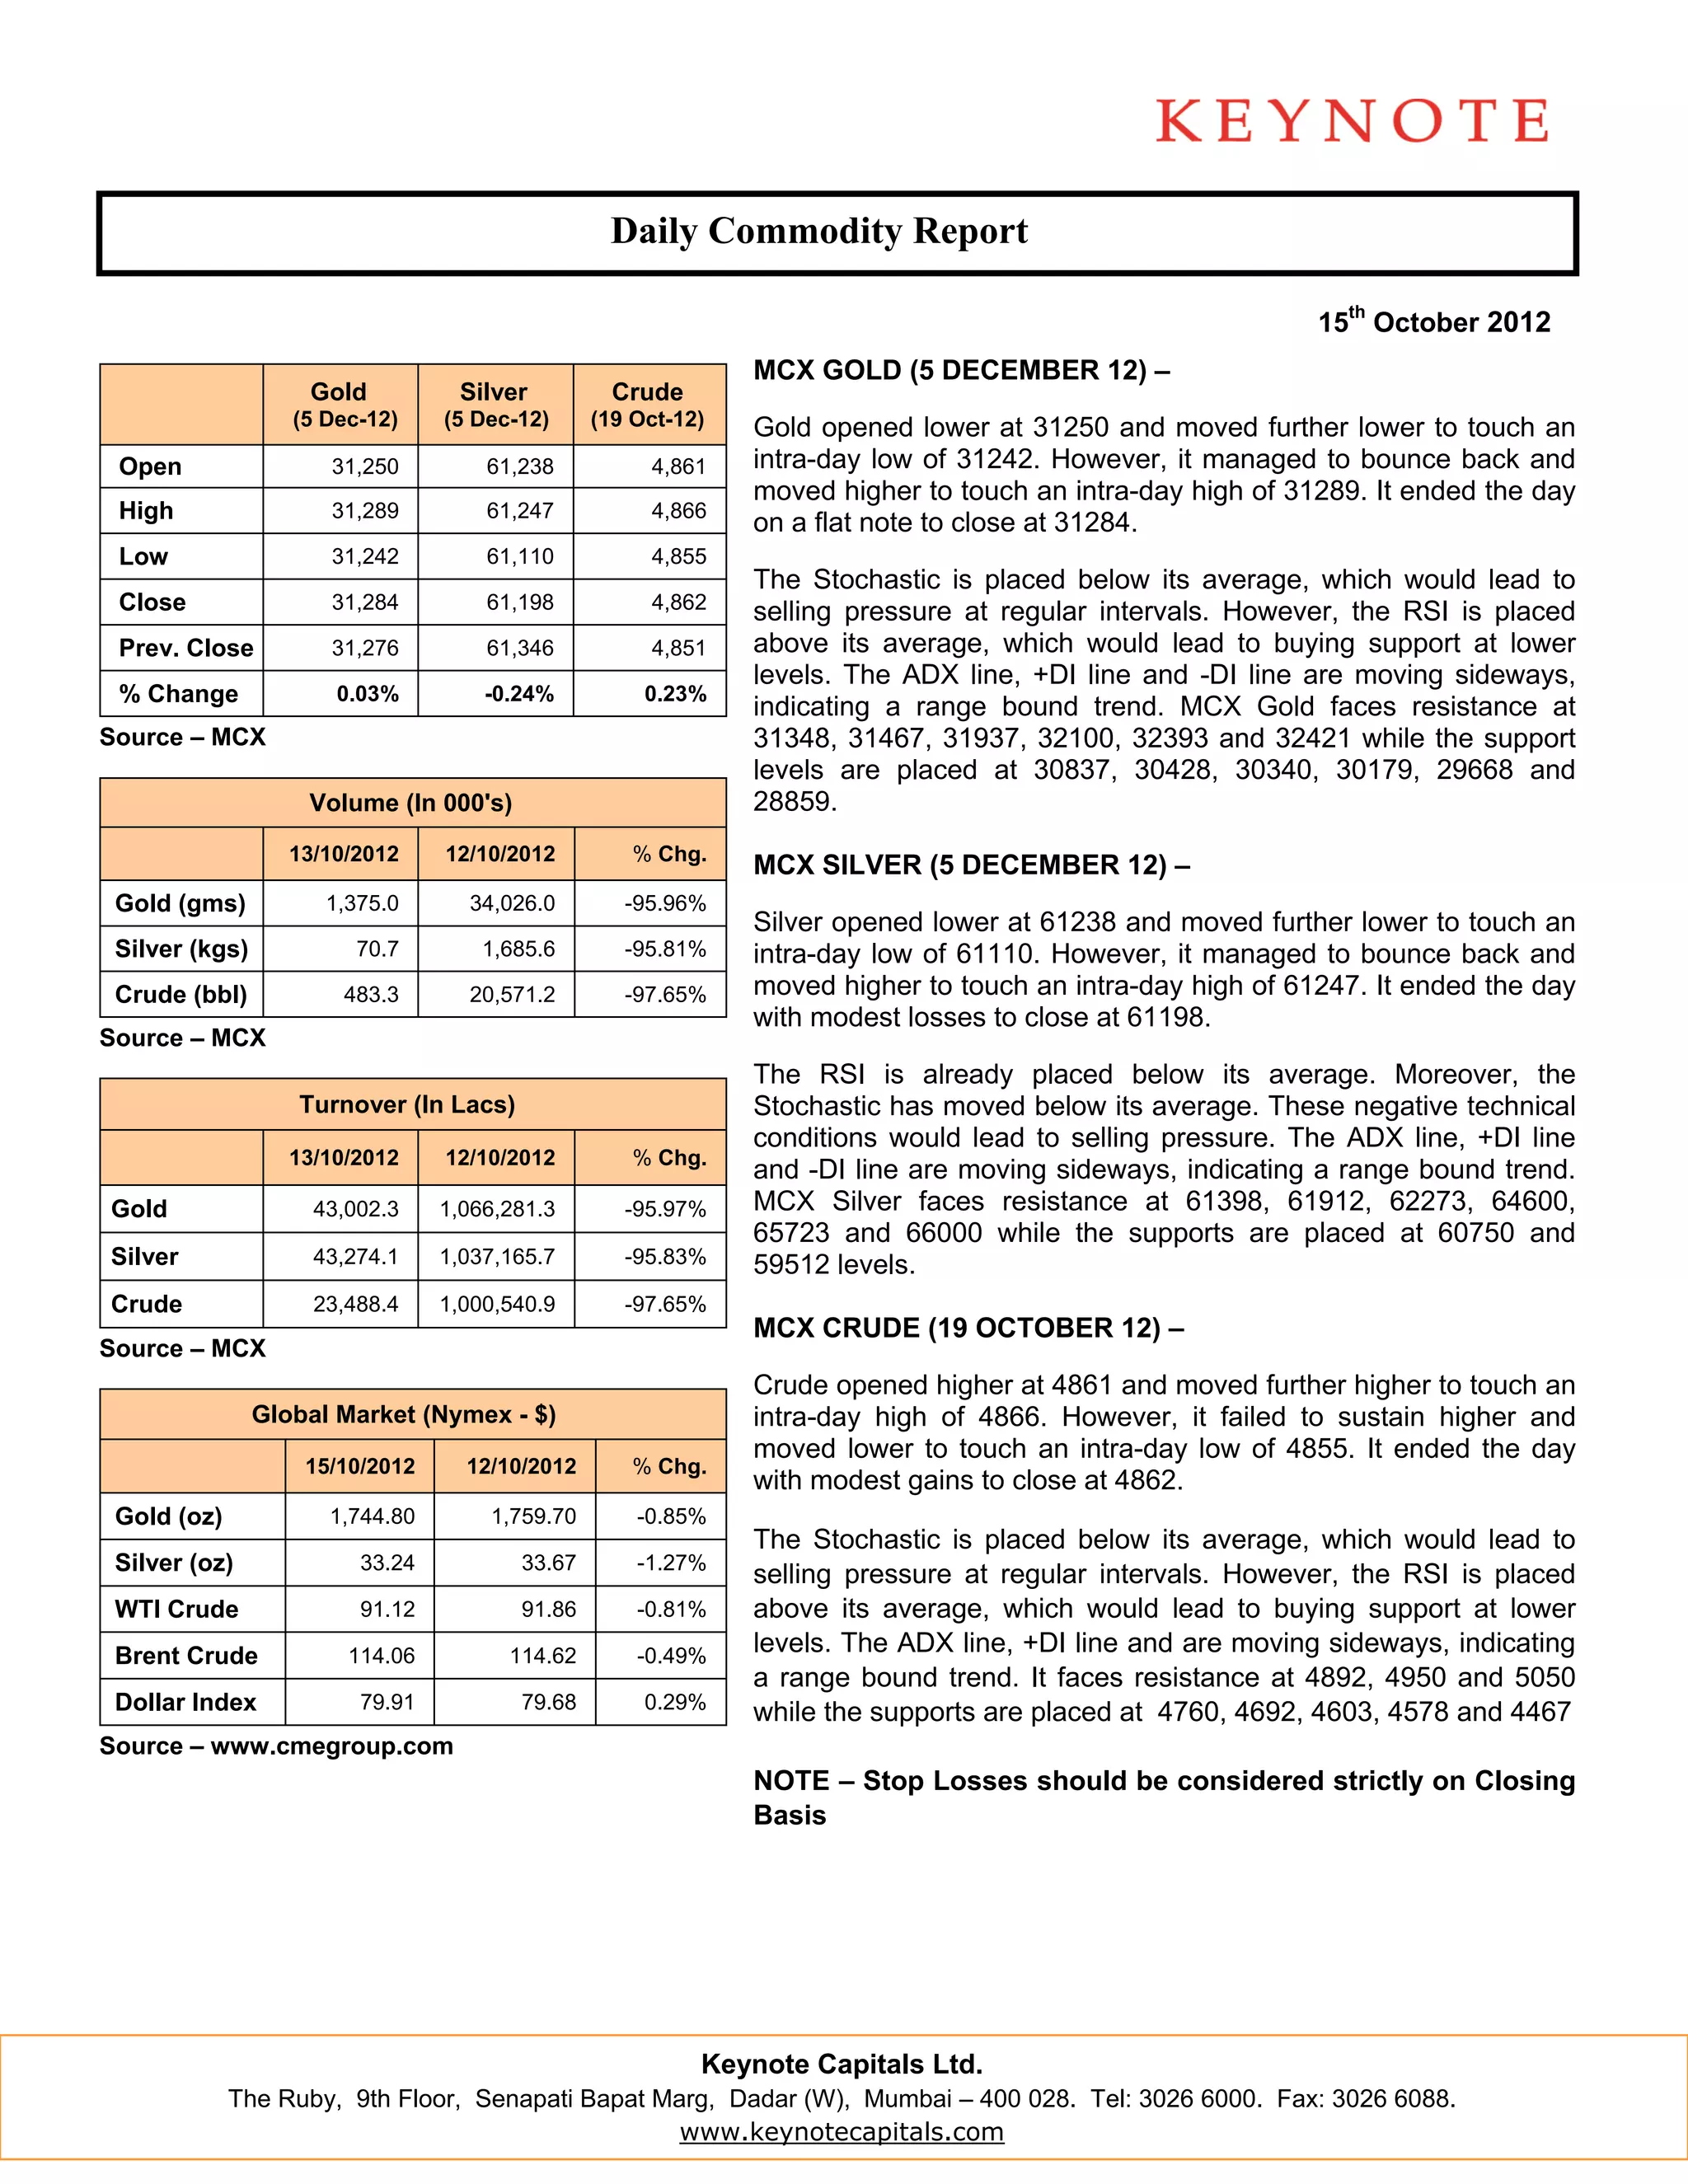

The document provides a daily commodity report for gold, silver, and crude oil futures contracts trading on the MCX exchange in India on October 15, 2012. It summarizes the opening, high, low, and closing prices for each commodity. It also analyzes technical indicators and identifies resistance and support levels. Additionally, it provides commentary on copper and global commodity prices, as well as an economic calendar for upcoming economic data releases.


