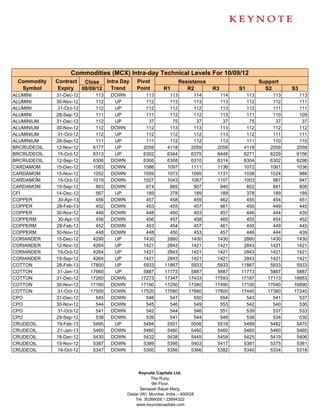
The document provides a table listing the intra-day technical levels for various commodities contracts traded on the Multi Commodity Exchange of India (MCX) as of October 9, 2012. The table includes the commodity symbol, contract expiry date, previous day's close price, intra-day trend, pivot point, resistance and support levels. Technical analysis is used to identify levels of resistance and support for traders of each commodity contract.
The document provides intra-day technical levels for various commodities traded on the MCX exchange for November 9, 2012. It lists the commodity, contract expiry date, previous day's close price, intra-day trend, pivot point, resistance and support levels. Technical analysis is used to determine trading levels and identify potential resistance and support areas for each commodity on an intra-day basis.
The document provides a table listing the intra-day technical levels for various commodities traded on the MCX exchange in India on December 9, 2012. The table includes the commodity name, contract expiry date, previous day's close price, intra-day trend, pivot point, resistance and support levels. Technical analysis is used to identify expected price movement and trading opportunities.
This document provides the intra-day technical levels for various commodities trading on the MCX exchange for June 9, 2012. It lists the commodity, contract expiry date, previous day's close price, intra-day trend, pivot point, and resistance and support levels. The commodities listed include aluminum, crude oil, copper, cotton, gold, nickel, and others.
The document provides a table listing the intra-day technical levels for various commodities traded on the MCX exchange for April 9, 2012. The table includes the commodity symbol, contract expiry date, previous day's close price, intra-day trend, pivot point, resistance and support levels for trading that commodity on that day. Over 25 commodities are listed along with their key technical indicators to guide intra-day trading.
The document provides a table listing the intra-day technical levels for various commodities traded on the MCX exchange in India on March 9, 2012. The table includes the commodity symbol, contract expiry date, previous day's close price, intra-day trend, pivot point, and resistance and support levels for trading that commodity on that day.
The document provides intra-day technical levels for various commodities trading on the Multi Commodity Exchange of India (MCX) as of August 30, 2012. It lists the commodity, contract expiry date, previous day's close price, identified trend (up or down), pivot point, and resistance and support levels for intra-day trading. Pivot points and resistance and support levels are identified based on technical analysis of recent price movements to suggest likely trading ranges.
The document provides intra-day technical levels for various commodities traded on the MCX exchange for August 31, 2012. It lists the commodity symbol, contract expiry date, previous day's close price, intra-day trend, pivot point, and resistance and support levels. The commodities include aluminum, crude oil, copper, cotton, gold, natural gas, nickel, and others. The trends and levels can be used by traders to identify potential support and resistance in prices during the trading session.
The document provides intra-day technical levels for various commodities trading on the MCX exchange for May 9, 2012. It lists the commodity, contract expiry date, previous day's close price, intra-day trend, pivot point, and resistance and support levels for each commodity. The levels can be used by traders to identify potential price points for entries and exits on intra-day trades.
The document provides a technical analysis of various commodity futures contracts traded on the MCX exchange in India. It lists the commodity, contract expiration date, previous day's close price, intraday trend, pivot points, resistance and support levels for each contract. The analysis is intended to help traders identify potential price movement and trading opportunities in these commodities.
The document provides daily technical levels for various MCX commodities including pivot points and resistance and support levels. It lists the commodity, contract expiry date, previous day's close price, calculated pivot point, and resistance and support price levels for intraday trading. The levels are calculated based on previous price data to determine likely trading ranges and support/resistance thresholds for each commodity on the given date.
The document provides daily technical levels for various commodities traded on the MCX commodity exchange in India. It lists the symbol, contract expiry date, previous day's close price, pivot point, and resistance and support levels for each commodity. The levels are used to analyze intraday trading opportunities and gauge market strength and weakness.
This document provides the intra-day technical levels for various MCX commodities on August 22, 2012. It lists the commodity symbol, contract expiry date, previous day's close price, pivot point, and resistance and support levels (R1-R3 and S1-S3). The commodities included are aluminum, crude oil, copper, cotton, gold, natural gas, and others. The levels are used to analyze the commodity's price movement and determine potential resistance and support areas.
The document provides intra-day technical levels for various commodities trading on the MCX exchange for September 25, 2012. It lists the commodity, contract expiry date, previous day's close price, intra-day trend, pivot point, and resistance and support levels for intra-day trading. Technical analysis is used to determine expected price movement and trading levels over the course of the day.
The document provides the intra-day technical levels for various MCX commodities on August 28, 2012. It lists the commodity symbol, contract expiry date, previous day's close price, pivot point, and resistance and support levels (R1, R2, R3, S1, S2, S3). The commodities include aluminum, crude oil, copper, cotton, gold, and natural gas. The levels can be used by traders to identify potential resistance and support levels for intra-day trading on those commodities on the given date.
The document provides daily technical levels for various commodities traded on the MCX exchange in India. It lists the commodity, contract expiry date, previous day's close price, pivot point, and resistance and support levels. The levels can be used by traders to identify potential support and resistance levels for intraday trading. The document contains this information for over 40 commodities traded on MCX.
The document provides daily technical levels for various commodities traded on the MCX exchange in India, including pivot points and resistance and support levels. For each commodity, it lists the contract expiry date, previous day's close price, and calculated pivot point as well as resistance and support price levels. This technical analysis is intended to help traders identify potential price movement zones for intraday trading on August 27, 2012.
The document provides daily technical levels for various commodities traded on the MCX commodity exchange in India. It lists the commodity, contract expiry date, previous day's close price, pivot point, and resistance and support levels for intra-day trading. The levels are used to identify potential price points where buying and selling pressure may occur during the trading day.
This document provides the intraday technical levels for various commodities trading on the Multi Commodity Exchange of India (MCX) as of 28/09/12. It lists the commodity, contract expiry date, previous day's close price, intraday trend, pivot point, and resistance and support levels (R1, R2, R3, S1, S2, S3). Technical levels are used to identify potential resistance and support price points that traders can use as targets or areas to enter/exit positions. The document contains this information for over 40 commodities trading on the MCX.
The document provides the intra-day technical levels for various commodities trading on the MCX exchange in India on September 26, 2012. It includes the commodity name, contract expiry date, previous day's close price, intra-day trend, pivot point, and resistance and support levels. The commodities include metals like aluminum, copper and lead, agricultural commodities like cotton, crude palm oil and spices, and energy commodities like crude oil and natural gas.
This document provides the intra-day technical levels for various commodities trading on the MCX exchange for April 10, 2012. It lists the commodity, contract expiry date, previous day's close price, intra-day trend, pivot point, and resistance and support levels. The pivot point, resistance and support levels are used to analyze the commodity's price movement during the trading day.
The document provides intra-day technical levels for various commodities trading on the MCX exchange for September 20, 2012. It lists the commodity, contract expiry date, previous day's close price, intra-day trend, pivot point, and resistance and support levels for each commodity. Pivot points, resistance and support levels are given to analyze price movement and identify potential trading opportunities.
The document provides a technical analysis of commodity futures contracts traded on the MCX exchange in India. It lists the symbol, expiry date, previous day's close, pivot point, and resistance and support levels for each commodity contract. The commodities include metals like aluminum, copper and zinc, agricultural commodities like cotton, crude palm oil, and spices. The analysis is intended to help traders identify potential resistance and support levels for intraday trading.
This document provides the intraday technical levels for various commodities trading on the MCX exchange in India as of 03/10/12. It lists the commodity, contract expiry date, previous day's close price, intraday trend, pivot point, and resistance and support levels. The commodities included are aluminum, crude oil, copper, cotton, gold, lead, and others. The levels are intended to help traders identify potential resistance and support levels for intraday trading.
The document provides daily technical analysis for various commodities traded on the MCX exchange in India. It lists the commodity, contract expiration date, previous day's close price, identified intraday trend, pivot point, and resistance and support price levels. The technical analysis is intended to help traders identify potential price movement and trading opportunities for the day.
The document provides a technical analysis of various commodity futures contracts traded on the MCX commodity exchange in India. It lists the commodity, contract, previous day's close, intraday trend, pivot points, resistance and support levels for each contract. The analysis is intended to help traders identify potential price movement and trading opportunities for the day.
The document provides intraday technical levels for various commodities traded on the MCX exchange for August 10, 2012. It lists the commodity, contract expiry date, previous day's close price, intraday trend, pivot point, and resistance and support levels. Technical analysis is used to identify levels of resistance and support that could impact the commodity's price movement during the trading day.
The document provides intraday technical levels for various commodities futures contracts traded on the MCX exchange in India. It lists the commodity, contract expiration date, previous day's close price, intraday trend, pivot point, and resistance and support price levels. The levels are used to analyze the commodity's price movement and determine potential support and resistance zones on an intraday basis.
The document provides intra-day technical levels for various commodities trading on the MCX exchange for October 23, 2012. It lists the commodity, contract expiry date, previous day's close price, intra-day trend, pivot point, resistance and support levels. Most commodities were seen to be in a downward trend intra-day. The technical levels provide traders with key price points to watch for potential trade entries or exits during the trading session.
The document provides daily technical analysis for various companies traded on the stock market. It lists the closing price from the previous day, intra-day trend, pivot points, and resistance and support levels for each stock. This technical analysis can be used by traders to identify entry and exit points for trades.
The document provides daily technical levels for various commodities traded on the MCX exchange in India. It lists the commodity, contract expiry date, previous day's close price, pivot point, and resistance and support levels. The levels are used to analyze intraday trading opportunities and gauge market strength and weakness.
The document provides intra-day technical levels for various stocks for February 8, 2012. It lists the stock name, previous day's close price, pivot point, and resistance and support levels R1-R3 and S1-S3. The levels can be used to identify potential high and low prices for intra-day trading on those stocks.
The document provides intra-day technical levels for various stocks listed on the Indian stock market for June 28, 2012. It lists the closing price from June 27, the pivot point, and resistance and support levels for each stock. The levels are intended to help analyze the stock's potential price movement during the trading day.
The key points from the document are:
1) Indian markets gained slightly, with the Sensex rising 0.12% and Nifty 0.22%, as gains were limited amid concerns over China's manufacturing activity and upcoming central bank meetings.
2) Exports declined 5.45% in June while cumulative exports for April-June declined 1.7% from a year ago.
3) Power generators and construction companies rose on hopes of increased sales and plans for highway construction.
The daily commodity report summarizes prices and trading activity for gold, silver, and crude on the MCX exchange on May 25th, 2012. Gold prices closed slightly lower at 28,880 after reaching an intraday high of 29,102. Silver closed with moderate gains at 54,317 after touching 54,785 intraday. Crude oil closed marginally higher at 5092 after hitting an intraday high of 5111. Technical indicators like the RSI and Stochastic showed signs of potential profit taking. Trading volumes declined for gold and silver compared to the previous day.
The document provides daily technical levels for various stocks including resistance and support levels. It lists the company name, previous day's closing price, pivot point, and three resistance and three support levels. The levels will help traders analyze intra-day trading opportunities in the listed stocks.
The document summarizes daily commodity market data for gold, silver, and crude oil. It reports that gold opened lower but closed with a modest loss, silver opened lower and closed with moderate losses, and crude oil opened higher but closed with moderate losses. Technical indicators are described as showing selling pressure for gold and silver but a range-bound trend for crude oil. Resistance and support levels are provided for each commodity.
The document provides intra-day technical levels for various companies trading on the stock market. It lists the company name, previous day's closing price, pivot point, and resistance and support levels for intra-day trading. The levels are meant to indicate price points where buying or selling pressure may increase for short term traders.
- India markets fell yesterday dragged down by an 11.9% drop in Tata Motors stocks after the auto maker reported disappointing quarterly earnings, while caution also prevailed ahead of GDP data and the expiry of derivatives.
- A renewed fall in the rupee to near record lows contributed to the weak sentiment, as did the fall in Asian shares, both because of intensifying worries about Spain's banking woes and its debt yields.
- Volatility ruled the roost as the markets recovered to hit fresh intraday highs in mid-afternoon trade as political worries eased after DMK chief M Karunanidhi said that he never threatened the Centre of a pull-out from the coalition government over petrol
- Gold opened higher at its highest price of the day but failed to sustain gains and closed with a marginal increase.
- Silver also opened higher but moved lower intraday before closing with a small gain.
- Crude oil opened lower, reached a daily low, but recovered slightly to close with a minor loss.
- Technical indicators show mixed signals for gold and silver, suggesting a range-bound trend, while crude oil indicators point to continued buying support.
Do not look where you fell, but where you slipped.Rhea Myers
This document contains a collection of short quotes and phrases on various topics. It encourages doing what you want to do today rather than postponing. It also contains quotes about the impact of online browsing and the capabilities of machines versus people. The document discusses open content business models and applications. It concludes with recommendations to integrate networks and facilitate communities.
IJERD (www.ijerd.com) International Journal of Engineering Research and Devel...IJERD Editor
The document experimentally investigates the effect of air swirl on the performance and emissions of a diesel engine fueled with karanja biodiesel (K20). Three piston configurations with different numbers of elliptical grooves (3, 6, and 9 grooves) were tested and compared to a normal piston. The results showed that the 6-groove piston configuration (GP2) improved brake thermal efficiency by 6.9%, reduced brake specific fuel consumption by 8.8%, decreased ignition delay by 7.3%, and lowered smoke, NOx, HC, and CO emissions compared to the normal piston at 3/4 rated load. The performance enhancements are attributed to better fuel-air mixing and more complete combustion resulting
IJERD (www.ijerd.com) International Journal of Engineering Research and Devel...IJERD Editor
The document discusses privacy issues in cloud computing. It defines privacy and describes privacy enhancing technologies (PETs) that can help protect privacy, such as pseudonymization and federated identity management. It also discusses privacy by design, which aims to embed privacy protections directly into technologies. Ensuring privacy in cloud computing requires measures like access controls, protecting against unauthorized access/copying of data, and specifying privacy controls in agreements. Overall privacy is a major challenge for cloud computing due to issues of data governance, security, and differing international regulations.
Este documento describe las diferentes unidades de volumen, incluyendo el metro cúbico como la unidad principal. Explica que cada unidad de volumen es 1,000 veces mayor que la unidad inmediatamente inferior y 1,000 veces menor que la unidad inmediatamente superior. Además, proporciona ejercicios para convertir entre unidades de volumen como metros cúbicos, decímetros cúbicos, hectómetros cúbicos, etc.
Peijun SHI1,2,3, Jing’ai WANG1,3,4, Wei XU2,3, Jiabing SHUAI1,2, Lili LU1,2, Feng KONG1,2, Qinqing SHI5
1State Key Laboratory of Earth Surface Processes and Resource Ecology of Beijing Normal University, China; 2Key Laboratory of Environmental Change and Natural Disaster of Ministry of Education, Beijing Normal University, China; 3Academy of Disaster Reduction and Emergency Management of Ministry of Civil Affairs and Ministry of Education, Beijing Normal University, China; 4School of Geography, Beijing Normal University, China; 5The University of Maryland, USA;
The document discusses Switzerland's early warning systems, InfoFlash and NetAlert. InfoFlash provides situational updates from cantonal emergency operations centers to the federal government. NetAlert alerts network operators of incidents affecting critical infrastructure. They are merging these systems so the federal crisis management board has a nationwide overview during major incidents. Standard operating procedures and regular tests are important for effective notification between stakeholders when disasters occur.
IJERD (www.ijerd.com) International Journal of Engineering Research and Devel...IJERD Editor
This document describes a study that uses fuzzy logic to control the position and speed of a DC motor. It presents the design of a fuzzy control system to model a DC motor in Simulink. Membership functions are defined for the controller's two inputs (error and change in error) and one output (control signal). Rules are formatted using combinations of the input variables. Simulation results demonstrate the performance of the fuzzy logic controller on a 3D plane. The controller is able to control the motor's speed in response to varying system conditions.
IJERD (www.ijerd.com) International Journal of Engineering Research and Devel...IJERD Editor
This document summarizes the history and mathematical properties of magic squares, which are square grids of numbers where the sums of each row, column, and diagonal are equal. It presents a novel methodology for arranging successive numbers in a square grid (n2) such that the sums are equal in all directions. The methodology involves rules for arranging odd and even numbers in the grid based on operations like addition and placement in specific positions. Examples of magic squares generated from 3x3 to 4x4 grids are provided to demonstrate the methodology. The methodology allows generating magic squares of any size from zero to infinity.
The document summarizes mobile network and handset brand strategies in India. It outlines how different brands communicate their key messages and ideas through creative executions. Virgin focuses on affordability for youth. Airtel emphasizes connectivity. Idea stresses communication and problem solving. Reliance shows it is better and more affordable than competitors. For handsets, Reliance targets middle class families. Virgin again focuses on youth and affordability. Nokia personifies the handset as a communication tool. Micromax emphasizes unique design. Lava differentiates on design and social image. Samsung demonstrates innovation through Amir Khan's association.
The document provides intra-day technical levels for various commodities traded on the MCX exchange in India on August 30, 2012. It lists the commodity, contract expiry date, previous day's close price, identified trend (up or down), pivot point, and resistance and support levels for intra-day trading. The levels are intended to help traders identify potential price points where the market may reverse or stall movement during the trading day.
The document provides the intra-day technical levels for various commodities contracts traded on MCX for November 29, 2012. It lists the commodity, contract expiry, previous day's close price, intra-day trend, pivot point, resistance and support levels. The pivot point is an intra-day trading tool and the trend is valid until the price trades above or below the pivot point. The analysis is provided by Sanjay Bhatia, AVP - Technical Research at Keynote Capital to help traders identify intra-day support and resistance levels.
The document provides a technical analysis of various commodity futures contracts traded on the MCX exchange in India. It lists the commodity, contract expiration, previous day's close price, intraday trend, pivot points, and resistance and support levels. Pivot points and technical price levels are given to analyze price direction and potential trading opportunities for each commodity contract.
The document provides a technical analysis of various commodity futures contracts traded on the MCX exchange in India. It lists the commodity, contract expiration date, previous day's close price, intraday trend, pivot point, and resistance and support price levels. The analysis is intended to help traders identify potential price movement and trading opportunities for over 20 commodities on October 22, 2012.
The document provides intra-day technical levels for various commodities futures contracts traded on the MCX exchange in India. It lists the commodity, contract details, previous day's close, intra-day trend, pivot points, resistance and support levels. Pivot points, resistance and support levels are given to analyze price behavior and identify potential trading opportunities for the day.
The document provides intraday technical levels for various commodities trading on the MCX exchange for November 26, 2012. It lists the commodity, contract expiry date, previous day's close price, intraday trend, pivot point, and resistance and support levels. The levels are used to analyze the commodity's price movement and determine potential support and resistance zones.
The document provides intra-day technical levels for various commodities trading on the MCX exchange, including the previous day's close, intra-day trend, pivot points, and resistance and support levels. Metrics are given for commodities like aluminum, crude oil, gold, silver, and others. The levels are intended to help traders analyze short-term trends and identify potential price points for the day's trading session.
The document provides intra-day technical levels for various commodities traded on the MCX commodity exchange in India on 07/11/12. It lists the commodity, contract expiry date, previous day's close price, intra-day trend, pivot point, and resistance and support levels. The levels are used to analyze the commodity's price movement and determine potential support and resistance zones on that trading day.
The document provides a technical analysis of various commodity futures contracts traded on the MCX exchange in India. It lists the commodity, contract expiration date, previous day's close price, intraday trend, pivot point, and resistance and support price levels. Most commodities were seen to have a downward intraday trend on 26/10/12 according to the analysis. The table provides information to traders on price levels to watch for potential trade entries and exits over the course of the trading session.
The document provides intraday technical levels for various commodities for trading on November 23, 2012. It lists the commodity, contract expiration date, previous day's close price, intraday trend, pivot point, and resistance and support levels. The levels are used to identify potential high and low prices for the day and help inform trading decisions.
Similar to Keynote technicals commodity intraday levels for 100912 (10)
The domestic stock markets opened lower but bounced back to close flat, supported by the 200-day simple moving average. The Nifty closed slightly higher but technical indicators remain negative, suggesting further bouts of selling pressure. Key support levels are at 5624, 5571 and 5447, while resistance levels are at 5747, 5816 and 5885. Stocks such as Adani Ports, HDFC, and HUL are recommended for watching.
The document provides intra-day technical levels for currency futures contracts for various dates. It includes the previous day's close price, intra-day trend, pivot point, and resistance and support levels. The pivot point is used as a trigger for intra-day buy/sell decisions. Resistance levels above and support levels below the pivot point are also provided. The document advises using the pivot point as a stop loss level and taking successive profit targets at the resistance and support levels.
The document provides daily derivatives outlook and recommends several bullish and bearish positional option trades on indices and stocks. It recommends short strangle trades on Nifty, Bank Nifty and USD/INR based on highest call and put open interest levels. It also recommends bullish call option trades on specific stocks like Hindustan Unilever, Ranbaxy, ITC, HDFC and Titan. Bearish put option trades are recommended on stocks like Reliance, Tata Steel, Reliance Power, DLF, Hero Motors.
The key Indian stock indices closed slightly higher, recovering from a seven-day losing streak. The Sensex closed up 0.12% and the Nifty closed up 0.14%. Midcap and small cap shares continued declining with lack of buying support. Shares of Jet Airways and SpiceJet fell on concerns of increased competition from a new AirAsia India joint venture. GAIL shares fell on reports of delays to a gas pipeline project in Tamil Nadu. Overall, six sectors closed lower while seven closed higher. FIIs were net buyers of Indian stocks while domestic institutions were net sellers.
The document provides the intra-day technical levels for various stocks trading on the NSE for March 28, 2013, the day of monthly futures and options expiry. It lists the closing price of each stock from March 26, the intra-day pivot point, and resistance and support levels (R1-R3 and S1-S3). The levels are expected to act as upside and downside barriers for price movement during the trading session.
The document provides intra-day technical levels for various commodities futures contracts traded on the MCX commodity exchange in India. It lists the commodity, contract expiry date, previous day's close price, intra-day trend, pivot point, and resistance and support levels for each commodity contract. The levels are used to analyze the commodity's intra-day price movement and determine potential resistance and support areas.
The daily commodity report summarizes the movement of gold, silver, and crude prices on the MCX exchange on March 6th, 2013. Gold prices opened lower but rose intraday before closing with modest losses. Silver opened higher and peaked intraday but also closed with losses. Crude opened and closed higher with moderate gains. Technical indicators for all three commodities showed sellers were in control but covering shorts, suggesting prices may rise. Upcoming economic reports and data were also summarized.
The domestic markets witnessed negative openings and sustained selling pressure, trading with moderate losses on weak global cues. However, the markets managed to recover from the lows and end the day with modest losses near the highs, supported by short covering and selective buying. Technically, most indicators remain below their averages, signaling impending selling pressure. The markets will take cues from global factors as well as the rupee and crude oil prices.
The document provides technical analysis levels for various currency futures contracts traded on the NSE for intraday trading on March 5, 2013. It lists the pivot point, resistance and support levels for currency pairs such as EUR/INR, GBP/INR, JPY/INR and USD/INR. The pivot point is considered a trigger for intraday buy/sell decisions. Resistance levels R1, R2, R3 are above the pivot point and support levels S1, S2, S3 are below the pivot point. The analysis is meant to guide intraday traders on entry, exit and stop loss levels based on the currency pair's price action relative to the pivot point.
The document provides the intra-day technical levels for various stocks trading on the National Stock Exchange of India (NSE) on March 5, 2013. It lists the stocks, their closing prices from the previous day, identified trends (up or down), pivot points, and resistance and support levels for intra-day trading. The levels are intended to help traders identify potential highs and lows for the stocks during the trading day.
The domestic stock markets witnessed flat opening but selling pressure drove markets lower. However, markets bounced back from lower levels due to short covering and selective buying. The markets closed near the day's highs with modest gains. Technically, positive market breadth amid higher volumes supported the markets. The indices remain above key support levels. However, negative technical indicators could lead to selling pressure at higher levels. The markets will take cues from the upcoming Union Budget.
The document provides the intra-day technical levels for currency futures contracts on various dates. It includes the pivot point, which is a trigger for intra-day buy/sell decisions, and resistance and support levels (R1, R2, R3 and S1, S2, S3). The trader is advised to take a long position above the pivot point and use the pivot as the stop loss, with targets at the resistance levels; and take a short position below the pivot point, using it as the stop loss and targeting the support levels. The intra-day trend is valid until the price trades above or below the pivot point.
The document provides intra-day technical levels for various MCX commodities contracts for February 28, 2013. It lists the commodity, contract expiry date, previous day's close price, intra-day trend, pivot point, resistance and support levels. Technical analysis is used to identify levels of resistance and support for each commodity contract to determine likely price movement and trading opportunities on the given day.
This document provides a daily derivatives outlook and recommends various positional option trades. It summarizes the highest call and put open interest levels for various indices like Nifty and Bank Nifty. It recommends short-term strategies like short strangles and long-term strategies like short straddles. It also provides bullish and bearish positional stock option trades and discusses the US dollar-Indian rupee outlook.
The daily commodity report summarizes prices and trading activity for gold, silver, and crude oil futures on the MCX exchange in India. On February 27th, gold and silver prices closed lower by 1.16% and 1.46% respectively, while crude oil closed lower by 0.42%. Trading volumes declined significantly across all three commodities compared to the previous day. Technical indicators show buying support for gold and silver but strengthening sellers for crude oil. Key support and resistance price levels are provided.
The document provides the intra-day technical levels for various stocks trading on the National Stock Exchange of India (NSE) for February 28, 2013, the expiry date for futures and options contracts. It lists the stock name, previous day's close price, identified trend (up/down), pivot point, and potential resistance and support levels (R1, R2, R3, S1, S2, S3) for each stock based on technical analysis of recent price movements. This is intended to help traders identify potential price points where the market may reverse direction on an intra-day basis.
The domestic markets opened flat but saw selling pressure and losses, especially in mid-cap stocks due to margin funding issues. The markets recovered slightly in the afternoon on short-covering and selective buying but failed to sustain higher levels. Technically, market breadth was weak with higher volumes signaling more downside risk. Most technical indicators were below their averages, signaling impending selling pressure. However, some indicators were in oversold territory, which could lead to short-term bouts of buying at lower levels. The markets will take cues from the upcoming union budget, global markets, the rupee and crude oil prices.
- The document provides intra-day technical levels for currency futures contracts, including pivot points, resistance and support levels.
- The pivot point is a trigger point for intra-day buying and selling based on the previous day's price range, and is used to determine resistance and support levels.
- Traders are advised to take buy positions above the pivot point and sell positions below it, using the pivot point as a stop loss and targeting resistance or support levels.
The document provides intra-day technical levels for various commodities trading on the MCX exchange for February 26, 2013. It lists the commodity, contract expiry date, previous day's close price, intra-day trend, pivot point, resistance and support levels for each commodity. Technical analysis is used to determine the short-term outlook and key price levels.
This document provides a daily outlook on currency, indices, and stock positional option trades for February 26, 2013. It summarizes the highest call and put open interest levels for the Nifty and Bank Nifty indices and recommends short strangle strategies. It also recommends short strangle trades for the USD/INR currency pair in March. On the stock side, it recommends bullish positional calls on specific stocks and bearish positional puts on other stocks. The document provides a ready reckoner on various option strategies and techniques for managing risk.
Discover timeless style with the 2022 Vintage Roman Numerals Men's Ring. Crafted from premium stainless steel, this 6mm wide ring embodies elegance and durability. Perfect as a gift, it seamlessly blends classic Roman numeral detailing with modern sophistication, making it an ideal accessory for any occasion.
https://rb.gy/usj1a2
Easily Verify Compliance and Security with Binance KYCAny kyc Account
Use our simple KYC verification guide to make sure your Binance account is safe and compliant. Discover the fundamentals, appreciate the significance of KYC, and trade on one of the biggest cryptocurrency exchanges with confidence.
Anny Serafina Love - Letter of Recommendation by Kellen Harkins, MS.AnnySerafinaLove
This letter, written by Kellen Harkins, Course Director at Full Sail University, commends Anny Love's exemplary performance in the Video Sharing Platforms class. It highlights her dedication, willingness to challenge herself, and exceptional skills in production, editing, and marketing across various video platforms like YouTube, TikTok, and Instagram.
How to Implement a Strategy: Transform Your Strategy with BSC Designer's Comp...Aleksey Savkin
The Strategy Implementation System offers a structured approach to translating stakeholder needs into actionable strategies using high-level and low-level scorecards. It involves stakeholder analysis, strategy decomposition, adoption of strategic frameworks like Balanced Scorecard or OKR, and alignment of goals, initiatives, and KPIs.
Key Components:
- Stakeholder Analysis
- Strategy Decomposition
- Adoption of Business Frameworks
- Goal Setting
- Initiatives and Action Plans
- KPIs and Performance Metrics
- Learning and Adaptation
- Alignment and Cascading of Scorecards
Benefits:
- Systematic strategy formulation and execution.
- Framework flexibility and automation.
- Enhanced alignment and strategic focus across the organization.
IMPACT Silver is a pure silver zinc producer with over $260 million in revenue since 2008 and a large 100% owned 210km Mexico land package - 2024 catalysts includes new 14% grade zinc Plomosas mine and 20,000m of fully funded exploration drilling.
[To download this presentation, visit:
https://www.oeconsulting.com.sg/training-presentations]
This PowerPoint compilation offers a comprehensive overview of 20 leading innovation management frameworks and methodologies, selected for their broad applicability across various industries and organizational contexts. These frameworks are valuable resources for a wide range of users, including business professionals, educators, and consultants.
Each framework is presented with visually engaging diagrams and templates, ensuring the content is both informative and appealing. While this compilation is thorough, please note that the slides are intended as supplementary resources and may not be sufficient for standalone instructional purposes.
This compilation is ideal for anyone looking to enhance their understanding of innovation management and drive meaningful change within their organization. Whether you aim to improve product development processes, enhance customer experiences, or drive digital transformation, these frameworks offer valuable insights and tools to help you achieve your goals.
INCLUDED FRAMEWORKS/MODELS:
1. Stanford’s Design Thinking
2. IDEO’s Human-Centered Design
3. Strategyzer’s Business Model Innovation
4. Lean Startup Methodology
5. Agile Innovation Framework
6. Doblin’s Ten Types of Innovation
7. McKinsey’s Three Horizons of Growth
8. Customer Journey Map
9. Christensen’s Disruptive Innovation Theory
10. Blue Ocean Strategy
11. Strategyn’s Jobs-To-Be-Done (JTBD) Framework with Job Map
12. Design Sprint Framework
13. The Double Diamond
14. Lean Six Sigma DMAIC
15. TRIZ Problem-Solving Framework
16. Edward de Bono’s Six Thinking Hats
17. Stage-Gate Model
18. Toyota’s Six Steps of Kaizen
19. Microsoft’s Digital Transformation Framework
20. Design for Six Sigma (DFSS)
To download this presentation, visit:
https://www.oeconsulting.com.sg/training-presentations
At Techbox Square, in Singapore, we're not just creative web designers and developers, we're the driving force behind your brand identity. Contact us today.
[To download this presentation, visit:
https://www.oeconsulting.com.sg/training-presentations]
This presentation is a curated compilation of PowerPoint diagrams and templates designed to illustrate 20 different digital transformation frameworks and models. These frameworks are based on recent industry trends and best practices, ensuring that the content remains relevant and up-to-date.
Key highlights include Microsoft's Digital Transformation Framework, which focuses on driving innovation and efficiency, and McKinsey's Ten Guiding Principles, which provide strategic insights for successful digital transformation. Additionally, Forrester's framework emphasizes enhancing customer experiences and modernizing IT infrastructure, while IDC's MaturityScape helps assess and develop organizational digital maturity. MIT's framework explores cutting-edge strategies for achieving digital success.
These materials are perfect for enhancing your business or classroom presentations, offering visual aids to supplement your insights. Please note that while comprehensive, these slides are intended as supplementary resources and may not be complete for standalone instructional purposes.
Frameworks/Models included:
Microsoft’s Digital Transformation Framework
McKinsey’s Ten Guiding Principles of Digital Transformation
Forrester’s Digital Transformation Framework
IDC’s Digital Transformation MaturityScape
MIT’s Digital Transformation Framework
Gartner’s Digital Transformation Framework
Accenture’s Digital Strategy & Enterprise Frameworks
Deloitte’s Digital Industrial Transformation Framework
Capgemini’s Digital Transformation Framework
PwC’s Digital Transformation Framework
Cisco’s Digital Transformation Framework
Cognizant’s Digital Transformation Framework
DXC Technology’s Digital Transformation Framework
The BCG Strategy Palette
McKinsey’s Digital Transformation Framework
Digital Transformation Compass
Four Levels of Digital Maturity
Design Thinking Framework
Business Model Canvas
Customer Journey Map
How MJ Global Leads the Packaging Industry.pdfMJ Global
MJ Global's success in staying ahead of the curve in the packaging industry is a testament to its dedication to innovation, sustainability, and customer-centricity. By embracing technological advancements, leading in eco-friendly solutions, collaborating with industry leaders, and adapting to evolving consumer preferences, MJ Global continues to set new standards in the packaging sector.
The Genesis of BriansClub.cm Famous Dark WEb PlatformSabaaSudozai
BriansClub.cm, a famous platform on the dark web, has become one of the most infamous carding marketplaces, specializing in the sale of stolen credit card data.
HOW TO START UP A COMPANY A STEP-BY-STEP GUIDE.pdf46adnanshahzad
How to Start Up a Company: A Step-by-Step Guide Starting a company is an exciting adventure that combines creativity, strategy, and hard work. It can seem overwhelming at first, but with the right guidance, anyone can transform a great idea into a successful business. Let's dive into how to start up a company, from the initial spark of an idea to securing funding and launching your startup.
Introduction
Have you ever dreamed of turning your innovative idea into a thriving business? Starting a company involves numerous steps and decisions, but don't worry—we're here to help. Whether you're exploring how to start a startup company or wondering how to start up a small business, this guide will walk you through the process, step by step.
Understanding User Needs and Satisfying ThemAggregage
https://www.productmanagementtoday.com/frs/26903918/understanding-user-needs-and-satisfying-them
We know we want to create products which our customers find to be valuable. Whether we label it as customer-centric or product-led depends on how long we've been doing product management. There are three challenges we face when doing this. The obvious challenge is figuring out what our users need; the non-obvious challenges are in creating a shared understanding of those needs and in sensing if what we're doing is meeting those needs.
In this webinar, we won't focus on the research methods for discovering user-needs. We will focus on synthesis of the needs we discover, communication and alignment tools, and how we operationalize addressing those needs.
Industry expert Scott Sehlhorst will:
• Introduce a taxonomy for user goals with real world examples
• Present the Onion Diagram, a tool for contextualizing task-level goals
• Illustrate how customer journey maps capture activity-level and task-level goals
• Demonstrate the best approach to selection and prioritization of user-goals to address
• Highlight the crucial benchmarks, observable changes, in ensuring fulfillment of customer needs
The APCO Geopolitical Radar - Q3 2024 The Global Operating Environment for Bu...APCO
The Radar reflects input from APCO’s teams located around the world. It distils a host of interconnected events and trends into insights to inform operational and strategic decisions. Issues covered in this edition include:
Keynote technicals commodity intraday levels for 100912
1. Commodities (MCX) Intra-day Technical Levels For 10/09/12
Commodity Contract Close Intra Day Pivot Resistance Support
Symbol Expiry 08/09/12 Trend Point R1 R2 R3 S1 S2 S3
ALUMINI 31-Dec-12 113 DOWN 113 113 114 114 113 113 113
ALUMINI 30-Nov-12 112 UP 112 113 113 113 112 112 111
ALUMINI 31-Oct-12 112 UP 112 112 112 113 112 111 111
ALUMINI 28-Sep-12 111 UP 111 112 112 113 111 110 109
ALUMINIUM 31-Dec-12 112 UP 37 75 37 37 75 37 37
ALUMINIUM 30-Nov-12 112 DOWN 112 113 113 113 112 112 112
ALUMINIUM 31-Oct-12 112 UP 112 112 112 113 112 111 111
ALUMINIUM 28-Sep-12 111 UP 111 112 112 113 111 110 110
BRCRUDEOIL 12-Nov-12 6177 UP 2059 4118 2059 2059 4118 2059 2059
BRCRUDEOIL 15-Oct-12 6313 UP 6302 6344 6375 6448 6271 6229 6156
BRCRUDEOIL 12-Sep-12 6306 DOWN 6306 6308 6310 6314 6304 6302 6298
CARDAMOM 15-Dec-12 1083 DOWN 1086 1097 1111 1136 1072 1061 1036
CARDAMOM 15-Nov-12 1052 DOWN 1059 1073 1095 1131 1038 1024 988
CARDAMOM 15-Oct-12 1019 DOWN 1027 1043 1067 1107 1003 987 947
CARDAMOM 15-Sep-12 863 DOWN 874 885 907 940 852 841 808
CFI 14-Dec-12 567 UP 189 378 189 189 378 189 189
COPPER 30-Apr-13 456 DOWN 457 458 459 462 455 454 451
COPPER 28-Feb-13 452 DOWN 453 455 457 461 450 449 445
COPPER 30-Nov-12 448 DOWN 448 450 453 457 446 444 439
COPPERM 30-Apr-13 456 DOWN 456 457 458 460 455 454 452
COPPERM 28-Feb-13 452 DOWN 453 454 457 461 450 449 445
COPPERM 30-Nov-12 448 DOWN 448 450 453 457 446 444 439
CORIANDER 15-Dec-12 4290 UP 1430 2860 1430 1430 2860 1430 1430
CORIANDER 12-Nov-12 4264 UP 1421 2843 1421 1421 2843 1421 1421
CORIANDER 15-Oct-12 4264 UP 1421 2843 1421 1421 2843 1421 1421
CORIANDER 15-Sep-12 4264 UP 1421 2843 1421 1421 2843 1421 1421
COTTON 28-Feb-13 17800 UP 5933 11867 5933 5933 11867 5933 5933
COTTON 31-Jan-13 17660 UP 5887 11773 5887 5887 11773 5887 5887
COTTON 31-Dec-12 17260 DOWN 17273 17347 17433 17593 17187 17113 16953
COTTON 30-Nov-12 17160 DOWN 17190 17250 17340 17490 17100 17040 16890
COTTON 31-Oct-12 17500 DOWN 17520 17580 17660 17800 17440 17380 17240
CPO 31-Dec-12 545 DOWN 546 547 550 554 543 541 537
CPO 30-Nov-12 544 DOWN 545 546 549 553 542 540 536
CPO 31-Oct-12 541 DOWN 542 544 546 551 539 537 533
CPO 29-Sep-12 538 DOWN 539 541 544 548 536 534 530
CRUDEOIL 19-Feb-13 5495 UP 5494 5501 5506 5518 5489 5482 5470
CRUDEOIL 21-Jan-13 5460 DOWN 5460 5460 5460 5460 5460 5460 5460
CRUDEOIL 18-Dec-12 5430 DOWN 5432 5438 5445 5458 5425 5419 5406
CRUDEOIL 15-Nov-12 5387 DOWN 5389 5395 5403 5417 5381 5375 5361
CRUDEOIL 19-Oct-12 5347 DOWN 5350 5356 5366 5382 5340 5334 5318
Keynote Capitals Ltd.
The Ruby,
9th Floor,
Senapati Bapat Marg,
Dadar (W), Mumbai, India – 400028
Tel: 30266000 / 22694322
www.keynotecapitals.com
2. Commodities (MCX) Intra-day Technical Levels For 10/09/12
Commodity Contract Close Intra Day Pivot Resistance Support
Symbol Expiry 08/09/12 Trend Point R1 R2 R3 S1 S2 S3
CRUDEOIL 19-Sep-12 5313 DOWN 5315 5323 5332 5349 5306 5298 5281
GOLD 05-Apr-13 33034 UP 33031 33053 33073 33115 33011 32989 32947
GOLD 05-Feb-13 32652 DOWN 32663 32698 32744 32825 32617 32582 32501
GOLD 05-Dec-12 32275 DOWN 32293 32333 32391 32489 32235 32195 32097
GOLD 05-Oct-12 31896 DOWN 31915 31956 32016 32117 31855 31814 31713
GOLDGUINEA 30-Nov-12 25787 UP 25777 25860 25932 26087 25705 25622 25467
GOLDGUINEA 31-Oct-12 25653 DOWN 25672 25720 25786 25900 25606 25558 25444
GOLDGUINEA 29-Sep-12 25545 DOWN 25561 25597 25649 25737 25509 25473 25385
GOLDM 05-Dec-12 32276 DOWN 32366 32482 32688 33010 32160 32044 31722
GOLDM 05-Nov-12 32081 DOWN 32118 32177 32273 32428 32022 31963 31808
GOLDM 05-Oct-12 31914 DOWN 31959 32025 32137 32315 31847 31781 31603
GOLDPETAL 30-Nov-12 3234 UP 3232 3242 3251 3270 3223 3213 3194
GOLDPETAL 31-Oct-12 3218 DOWN 3219 3223 3228 3237 3214 3210 3201
GOLDPETAL 29-Sep-12 3203 DOWN 3206 3211 3218 3230 3199 3194 3182
GOLDPTLDEL 30-Nov-12 3277 DOWN 3277 3283 3288 3299 3272 3266 3255
GOLDPTLDEL 31-Oct-12 3323 UP 3322 3367 3410 3498 3279 3234 3146
GOLDPTLDEL 29-Sep-12 3315 DOWN 3318 3376 3437 3556 3257 3199 3080
IRONORE 31-Oct-12 4374 UP 1458 2916 1458 1458 2916 1458 1458
IRONORE 28-Sep-12 4358 UP 1453 2905 1453 1453 2905 1453 1453
KAPAS 30-Apr-13 1004 DOWN 1006 1013 1021 1037 997 991 976
KAPAS 30-Mar-13 1001 DOWN 1004 1009 1018 1032 995 989 975
LEAD 31-Dec-12 117 UP 117 118 118 118 117 117 116
LEAD 30-Nov-12 117 UP 117 118 118 120 116 115 114
LEAD 31-Oct-12 117 DOWN 117 119 122 126 115 113 109
LEAD 28-Sep-12 116 UP 116 117 118 119 115 115 113
LEADMINI 31-Dec-12 117 UP 117 118 119 120 116 115 114
LEADMINI 30-Nov-12 117 UP 117 118 118 120 116 115 114
LEADMINI 31-Oct-12 117 DOWN 117 118 119 121 116 114 112
LEADMINI 28-Sep-12 116 DOWN 116 118 119 121 115 114 111
MAIZE 20-Nov-12 1539 UP 513 1026 513 513 1026 513 513
MAIZE 19-Oct-12 1544 UP 515 1029 515 515 1029 515 515
MAIZE 20-Sep-12 1550 UP 517 1033 517 517 1033 517 517
MENTHAOIL 31-Dec-12 1445 UP 1445 1457 1469 1494 1432 1420 1395
MENTHAOIL 30-Nov-12 1413 DOWN 1420 1429 1444 1468 1404 1396 1372
MENTHAOIL 31-Oct-12 1394 DOWN 1400 1412 1430 1459 1383 1371 1342
MENTHAOIL 29-Sep-12 1374 DOWN 1380 1392 1410 1440 1362 1350 1320
NATURALGAS 27-Nov-12 172 DOWN 174 176 181 189 169 166 159
NATURALGAS 26-Oct-12 157 DOWN 158 158 159 161 156 156 154
NATURALGAS 25-Sep-12 148 DOWN 148 149 150 152 147 147 145
NICKEL 31-Dec-12 935 UP 312 624 312 312 624 312 312
Keynote Capitals Ltd.
The Ruby,
9th Floor,
Senapati Bapat Marg,
Dadar (W), Mumbai, India – 400028
Tel: 30266000 / 22694322
www.keynotecapitals.com
3. Commodities (MCX) Intra-day Technical Levels For 10/09/12
Commodity Contract Close Intra Day Pivot Resistance Support
Symbol Expiry 08/09/12 Trend Point R1 R2 R3 S1 S2 S3
NICKEL 30-Nov-12 928 DOWN 928 929 931 934 926 925 922
NICKEL 31-Oct-12 919 DOWN 919 922 924 929 917 915 910
NICKEL 28-Sep-12 910 DOWN 910 913 916 921 907 904 899
NICKELM 31-Dec-12 936 DOWN 936 937 938 939 936 935 934
NICKELM 30-Nov-12 928 DOWN 928 930 931 934 927 926 923
NICKELM 31-Oct-12 919 DOWN 920 921 923 925 918 917 914
NICKELM 28-Sep-12 910 UP 910 913 915 920 908 905 900
POTATO 15-Mar-13 744 DOWN 748 754 765 781 738 732 715
POTATO 15-Oct-12 1122 DOWN 1129 1138 1155 1181 1112 1103 1077
POTATO 15-Sep-12 1026 DOWN 1027 1029 1032 1037 1024 1022 1017
POTATOTRWR 15-Oct-12 953 DOWN 961 975 997 1033 939 925 889
POTATOTRWR 15-Sep-12 901 UP 901 902 903 905 900 899 897
REFSOYOIL 15-Nov-12 785 UP 262 523 262 262 523 262 262
REFSOYOIL 15-Oct-12 785 UP 262 523 262 262 523 262 262
REFSOYOIL 15-Sep-12 781 UP 260 521 260 260 521 260 260
SILVER 04-May-13 67200 DOWN 67200 67200 67200 67200 67200 67200 67200
SILVER 05-Mar-13 65624 DOWN 65709 65926 66227 66745 65408 65191 64673
SILVER 05-Dec-12 63890 DOWN 63936 64108 64326 64716 63718 63546 63156
SILVERM 30-Apr-13 67162 UP 67149 67298 67433 67717 67014 66865 66581
SILVERM 28-Feb-13 65648 DOWN 65675 65832 66017 66359 65490 65333 64991
SILVERM 30-Nov-12 63904 DOWN 63992 64210 64517 65042 63685 63467 62942
SILVERMIC 30-Apr-13 67124 DOWN 67335 67769 68415 69495 66689 66255 65175
SILVERMIC 28-Feb-13 65644 DOWN 65674 65838 66032 66390 65480 65316 64958
SILVERMIC 30-Nov-12 63904 DOWN 63947 64167 64431 64915 63683 63463 62979
SUGARMKOL 20-Dec-12 3555 UP 1185 2370 1185 1185 2370 1185 1185
SUGARMKOL 20-Nov-12 3525 UP 1175 2350 1175 1175 2350 1175 1175
SUGARMKOL 19-Oct-12 3546 UP 1182 2364 1182 1182 2364 1182 1182
SUGARMKOL 20-Sep-12 3551 UP 1184 2367 1184 1184 2367 1184 1184
WHEAT 20-Nov-12 1562 UP 521 1041 521 521 1041 521 521
WHEAT 19-Oct-12 1587 UP 529 1058 529 529 1058 529 529
WHEAT 20-Sep-12 1582 UP 527 1054 527 527 1054 527 527
ZINC 31-Dec-12 110 UP 110 110 111 112 109 109 108
ZINC 30-Nov-12 109 UP 109 110 110 111 109 109 108
ZINC 31-Oct-12 109 DOWN 110 111 113 117 107 106 102
ZINC 28-Sep-12 108 UP 108 109 109 110 108 107 106
ZINCMINI 31-Dec-12 110 DOWN 110 110 111 111 109 109 108
ZINCMINI 30-Nov-12 109 UP 109 110 110 111 109 109 108
Keynote Capitals Ltd.
The Ruby,
9th Floor,
Senapati Bapat Marg,
Dadar (W), Mumbai, India – 400028
Tel: 30266000 / 22694322
www.keynotecapitals.com
4. Commodities (MCX) Intra-day Technical Levels For 10/09/12
Commodity Contract Close Intra Day Pivot Resistance Support
Symbol Expiry 08/09/12 Trend Point R1 R2 R3 S1 S2 S3
ZINCMINI 31-Oct-12 109 DOWN 109 109 110 111 108 108 106
ZINCMINI 28-Sep-12 108 DOWN 108 109 109 111 107 107 106
Sanjay Bhatia (AVP – Technical Research), Email Id sanjay@keynotecapitals.net
Pivot Point: Intra- Day Trading Tool. - The key to the use of this tool is the use of Stop Loss
Intra Day Trend: It is valid only till the point where Price trades above Pivot Point. For Eg. “UP” would be valid till Price
remains above Pivot Point. It would become “DOWN” in event Price trades below Pivot Point.
Pivot Point (PP): This is a trigger point for Intra Day Buy / Sell based on the price range of the previous day.
R1: Resistance 1: 1st Resistance level over Pivot Point, R2: Resistance 2: Next Resistance level after R1.
R3: Resistance 3: Next Resistance level after R2.
S1: Support 1: 1st Support level after Pivot Point, S2: Support 2: Next Support level after S1.
S3: Support 3: Next Support level after S2.
Note: As per this tool, the trader should take BUY position just above the Pivot Point and keep the Pivot Point level as stop
loss and the first target would be R1 level (Resistance 1). If R1 is crossed then R2 (Resistance 2) becomes the next target
with the stop loss placed at R1 level. If R2 is crossed then R3 (Resistance 3) becomes the next target with the stop loss
placed at R2 level.
Similarly if price goes below the Pivot Point the trader should take a SELL position and keep the Pivot Point level as the
stop loss and the first target would be S1 level (Support 1). If S1 level is breached then S2 level (Support 2) becomes the
next target with the stop loss placed at S1 level. If S2 level is breached then S3 level (Support 3) becomes the next target
with the stop loss placed at S2 level.
Disclaimer: This document is not for public distribution and has been furnished to you solely for your information and must not be reproduced or
redistributed to any other person. Persons into whose possession this document may come are required to observe these restrictions. This material is
for the personal information of the authorized recipient, and we are not soliciting any action based upon it. This report is not to be construed as an offer
to sell or the solicitation of an offer to buy any security in any jurisdiction where such an offer or solicitation would be illegal. It is for the general
information of clients of Keynote Capitals Ltd. It does not constitute a personal recommendation or take into account the particular investment objectives,
financial situations, or needs of individual clients. We have reviewed the report, and in so far as it includes current or historical information, it is believed
to be reliable though its accuracy or completeness cannot be guaranteed. Neither Keynote Capitals Ltd., nor any person connected with it, accepts any
liability arising from the use of this document. The recipients of this material should rely on their own investigations and take their own professional
advice. Price and value of the investments referred to in this material may go up or down. Past performance is not a guide for future performance.
Certain transactions -including those involving futures, options and other derivatives as well as non-investment grade securities - involve substantial risk
and are not suitable for all investors. Reports based on technical analysis centers on studying charts of a stock’s price movement and trading volume, as
opposed to focusing on a company’s fundamentals and as such, may not match with a report on a company’s fundamentals. Opinions expressed are our
current opinions as of the date appearing on this material only. While we endeavor to update on a reasonable basis the information discussed in this
material, there may be regulatory, compliance, or other reasons that prevent us from doing so. Prospective investors and others are cautioned that any
forward-looking statements are not predictions and may be subject to change without notice. Our proprietary trading and investment businesses may
make investment decisions that are inconsistent with the recommendations expressed herein. We and our affiliates, officers, directors, and employees
world wide may: (a) from time to time, have long or short positions in, and buy or sell the securities thereof, of company (ies) mentioned herein or (b) be
engaged in any other transaction involving such securities and earn brokerage or other compensation or act as a market maker in the financial
instruments of the company (ies) discussed herein or act as advisor or lender / borrower to such company (ies) or have other potential conflict of interest
with respect to any recommendation and related information and opinions. The analyst for this report certifies that all of the views expressed in this
report accurately reflect his or her personal views about the subject company or companies and its or their securities, and no part of his or her
compensation was, is or will be, directly or indirectly related to specific recommendations or views expressed in this report. No part of this material may
be duplicated in any form and/or redistributed without Keynote Capitals Ltd’s., prior written consent.
Keynote Capitals Ltd.
The Ruby,
9th Floor,
Senapati Bapat Marg,
Dadar (W), Mumbai, India – 400028
Tel: 30266000 / 22694322
www.keynotecapitals.com