Download to read offline
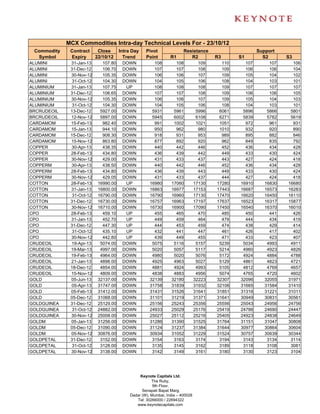
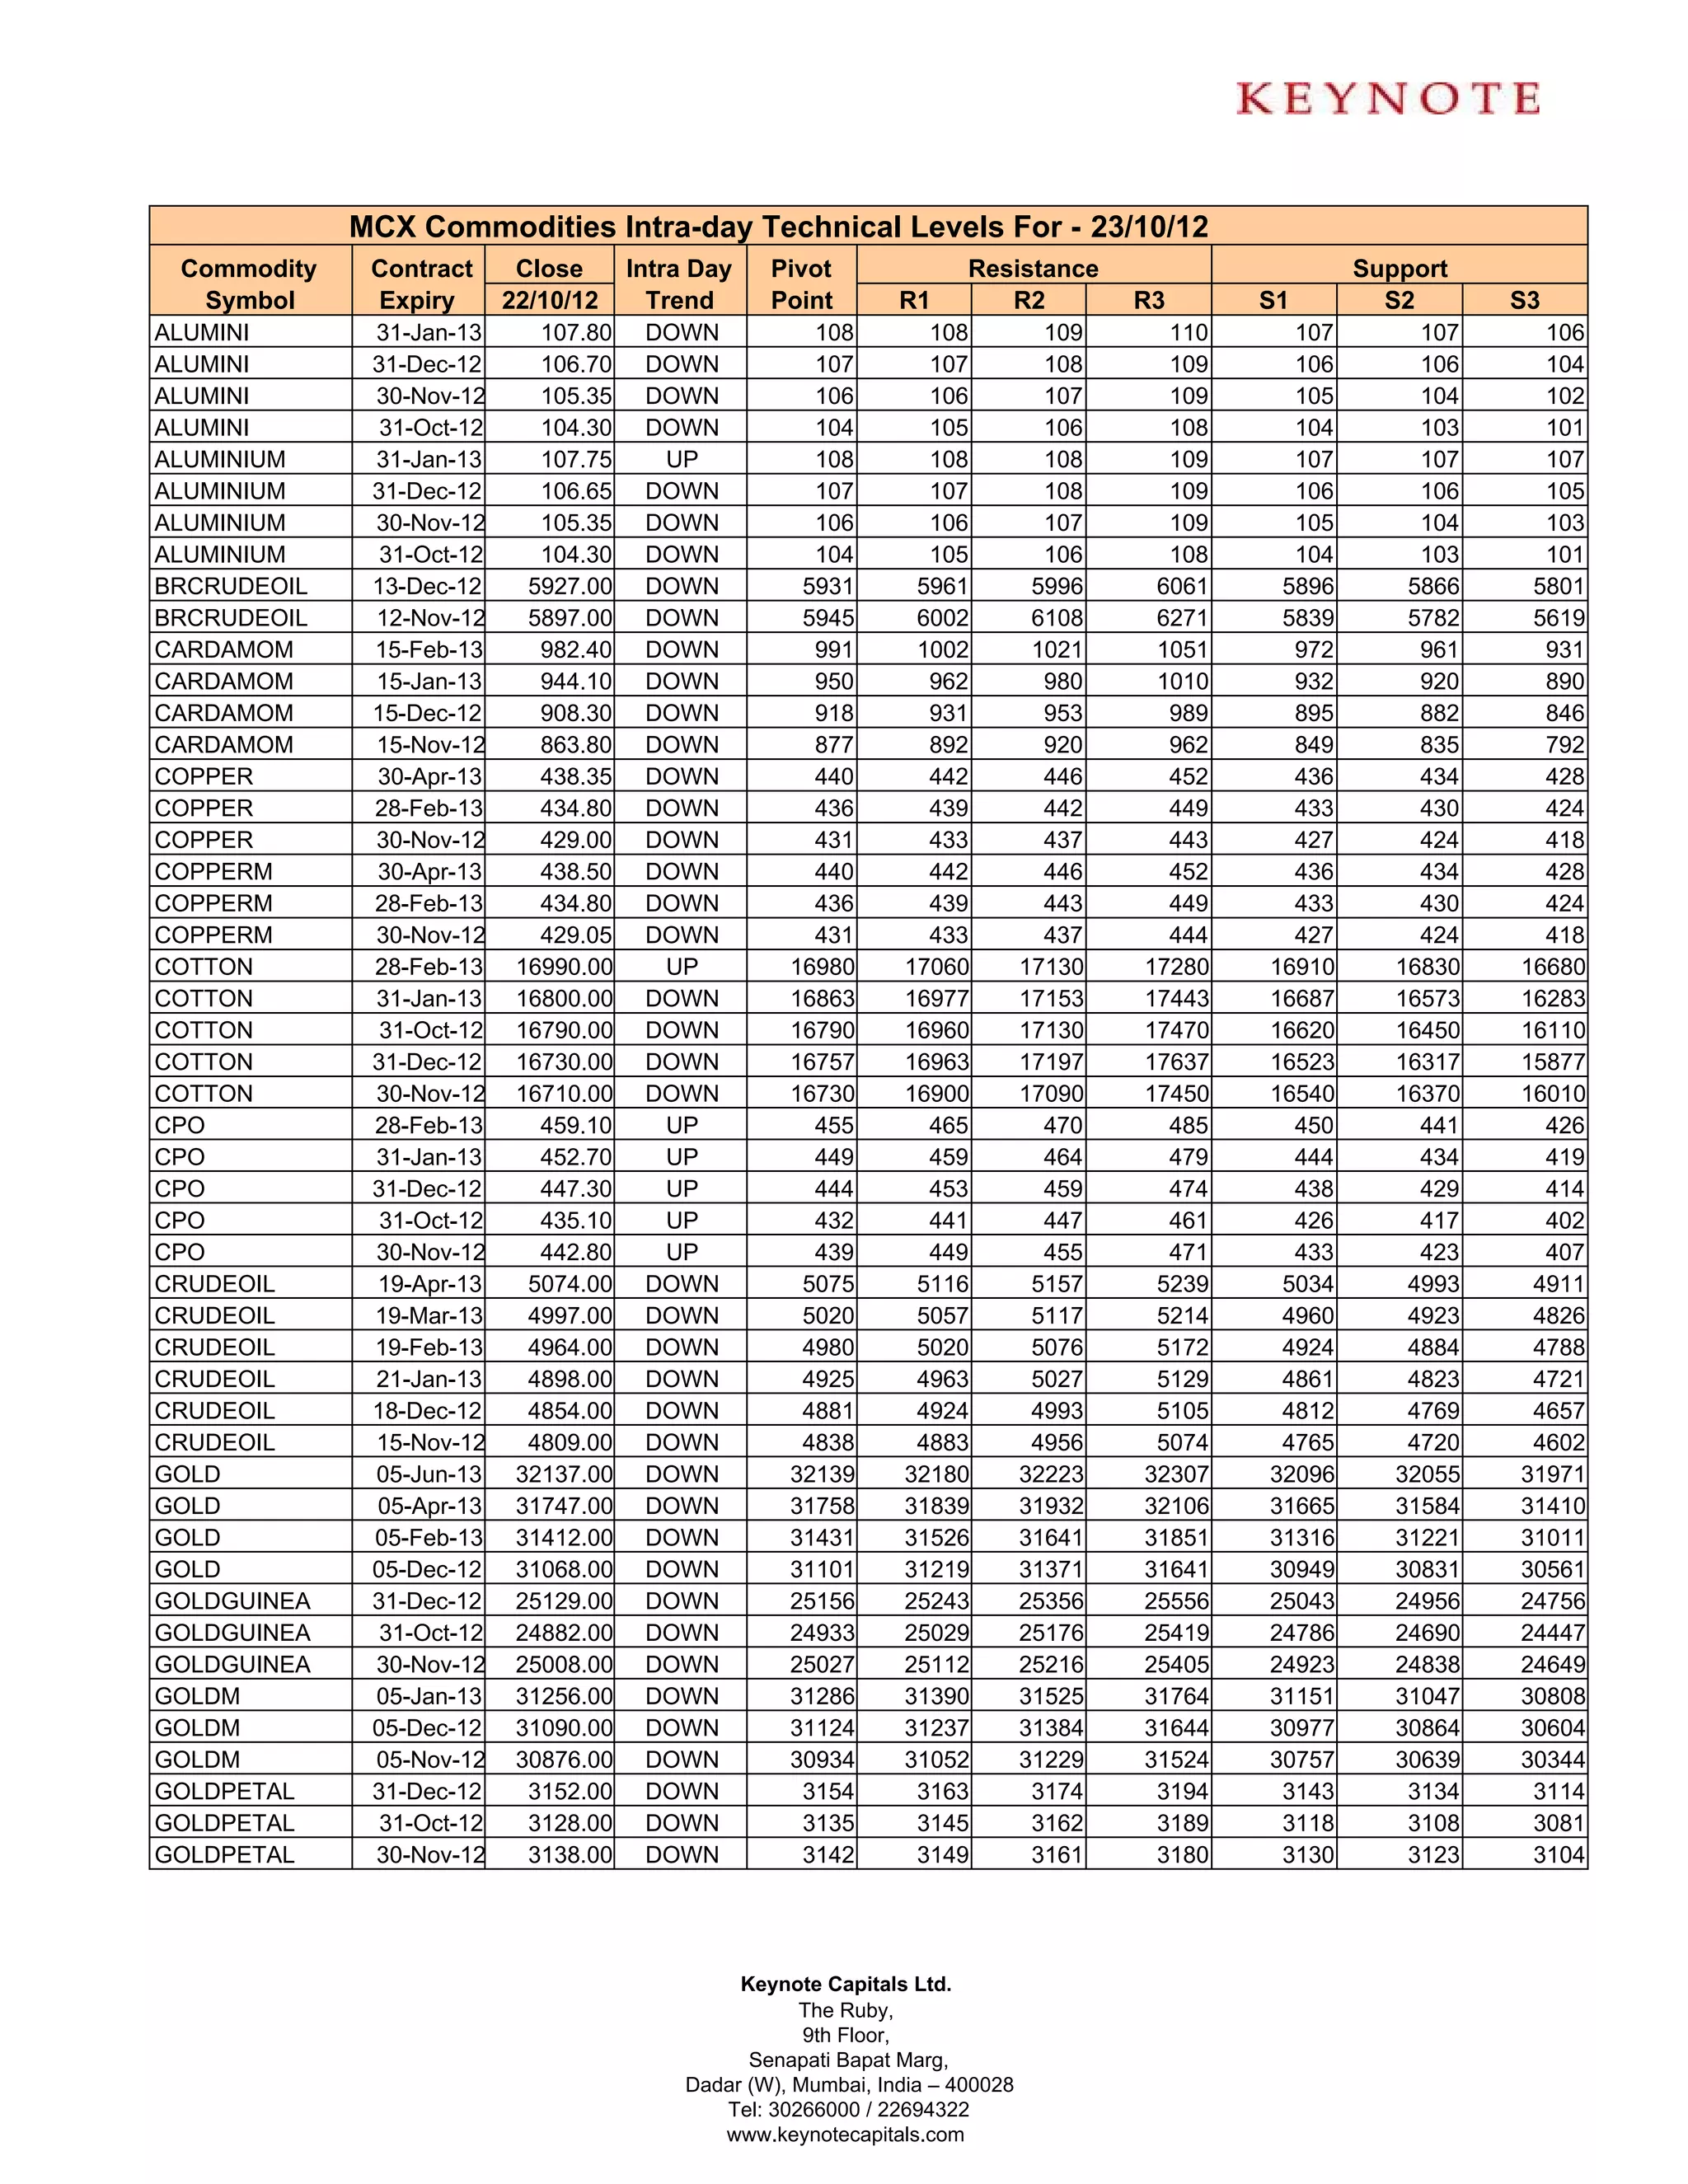
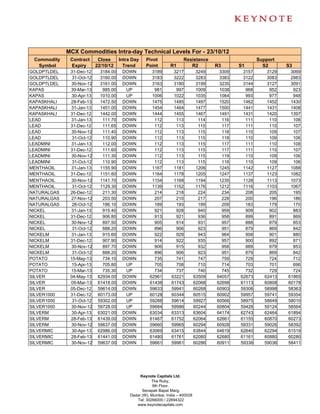

The document provides intra-day technical levels for various commodities trading on the MCX exchange for October 23, 2012. It lists the commodity, contract expiry date, previous day's close price, intra-day trend, pivot point, resistance and support levels. Most commodities were seen to be in a downward trend intra-day. The technical levels provide traders with key price points to watch for potential trade entries or exits during the trading session.


