Call Girls Service Nagpur Maya Call 7001035870 Meet With Nagpur Escorts
Keynote technicals daily report for 110213
1. Daily Technical Outlook
11th February 2013
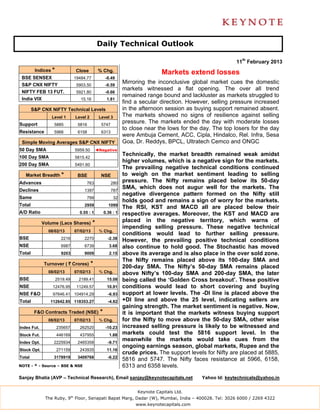
Indices * Close % Chg. Markets extend losses
BSE SENSEX 19484.77 -0.49
S&P CNX NIFTY 5903.50 -0.59
Mirroring the inconclusive global market cues the domestic
markets witnessed a flat opening. The over all trend
NIFTY FEB 13 FUT. 5921.80 -0.66
remained range bound and lackluster as markets struggled to
India VIX 15.16 1.81
find a secular direction. However, selling pressure increased
S&P CNX NIFTY Technical Levels in the afternoon session as buying support remained absent.
Level 1 Level 2 Level 3 The markets showed no signs of resilience against selling
Support 5885 5816 5747
pressure. The markets ended the day with moderate losses
to close near the lows for the day. The top losers for the day
Resistance 5966 6158 6313
were Ambuja Cement, ACC, Cipla, Hindalco, Rel. Infra, Sesa
Simple Moving Averages S&P CNX NIFTY Goa, Dr. Reddys, BPCL, Ultratech Cemco and ONGC
50 Day SMA 5959.50 ◄Negative
100 Day SMA 5815.42
Technically, the market breadth remained weak amidst
higher volumes, which is a negative sign for the markets.
200 Day SMA 5491.60
The prevailing negative technical conditions continued
Market Breadth * BSE NSE to weigh on the market sentiment leading to selling
Advances 763 280
pressure. The Nifty remains placed below its 50-day
Declines 1397 787
SMA, which does not augur well for the markets. The
negative divergence pattern formed on the Nifty still
Same 799 32
holds good and remains a sign of worry for the markets.
Total 2959 1099
The RSI, KST and MACD all are placed below their
A/D Ratio 0.55 : 1 0.36 : 1 respective averages. Moreover, the KST and MACD are
Volume (Lacs Shares) * placed in the negative territory, which warns of
impending selling pressure. These negative technical
08/02/13 07/02/13 % Chg.
conditions would lead to further selling pressure.
BSE 2216 2270 -2.38
However, the prevailing positive technical conditions
NSE 6987 6739 3.68 also continue to hold good. The Stochastic has moved
Total 9203 9009 2.15 above its average and is also place in the over sold zone.
The Nifty remains placed above its 100-day SMA and
Turnover ( ` Crores) * 200-day SMA. The Nifty’s 50-day SMA remains placed
08/02/13 07/02/13 % Chg. above Nifty’s 100-day SMA and 200-day SMA, the later
BSE 2519.49 2189.41 15.08 being called the ‘Golden Cross breakout’. These positive
NSE 12476.95 11249.57 10.91 conditions would lead to short covering and buying
NSE F&O 97646.41 104914.29 -6.93 support at lower levels. The -DI line is placed above the
Total 112642.85 118353.27 -4.82 +DI line and above the 25 level, indicating sellers are
gaining strength. The market sentiment is negative. Now,
F&O Contracts Traded (NSE) * it is important that the markets witness buying support
08/02/13 07/02/13 % Chg. for the Nifty to move above the 50-day SMA, other wise
Index Fut. 235657 262520 -10.23 increased selling pressure is likely to be witnessed and
Stock Fut. 446169 437955 1.88 markets could test the 5816 support level. In the
Index Opt. 2225934 2465358 -9.71
meanwhile the markets would take cues from the
ongoing earnings season, global markets, Rupee and the
Stock Opt. 271159 243935 11.16
crude prices. The support levels for Nifty are placed at 5885,
Total 3178919 3409768 -6.22
5816 and 5747. The Nifty faces resistance at 5966, 6158,
NOTE - * - Source – BSE & NSE 6313 and 6358 levels.
Sanjay Bhatia (AVP – Technical Research), Email sanjay@keynotecapitals.net Yahoo Id: keytechnicals@yahoo.in
Keynote Capitals Ltd.
The Ruby, 9th Floor, Senapati Bapat Marg, Dadar (W), Mumbai, India – 400028. Tel: 3026 6000 / 2269 4322
www.keynotecapitals.com
2. Jaldi 5 (Short Term Technical Ideas for 5 Trading Days)
Stop
Initiation Stop Loss Target
Stock Close Action Price Loss * (%) Target (%) Remarks
Aahok Leyland Fut 23.70 Sell Below 23.40 24.50 4.70 21 10.26
Bank of Baroda Fut 776.40 Sell Below 776.00 788.00 1.55 750 3.35
Bata 789.60 Buy Above 790.00 776.00 1.77 820 3.80
* Stop Losses are to be considered strictly on closing basis.
Intra-day Resistance Intra-day Support
Indices Close Pivot Point R1 R2 R3 S1 S2 S3
BSE SENSEX 19485 19516 19617 19749 19982 19384 19283 19049
S&P CNX NIFTY 5904 5914 5944 5984 6054 5874 5844 5774
NIFTY FEB 13 FUT. 5922 5907 5915 5907 5907 5915 5907 5907
Stocks To Watch Out Today
Bata, Exide, Godrej Inds; Havells, HDFC Bank, Hexaware, PFC, TCS, Tech Mahindra, Wipro
Aban, AB Nuvo, Allahabad Bank, Ambuja Cements, Aurobindo Pharma, Bank of Baroda, BPCL, Cairn, Canara Bank, CESC,
Cipla, Colgate, Dabur, Dish TV, Dr. Reddys Labs; FT, GSPL, Hero Motocorp; Hindalco, IB Realestate, ICICI Bank, IOC,
Karnataka Bank, LIC Hsg; M&M, Maruti, ONGC, Rel. Comm; REC, Rel. Infra, Rel. Power, SBI, Siemens, Sterlite, Tata Power,
Tata Steel
Keynote Capitals Ltd.
The Ruby, 9th Floor, Senapati Bapat Marg, Dadar (W), Mumbai, India – 400028. Tel: 3026 6000 / 2269 4322
www.keynotecapitals.com
3. NOTE:
TECHNICAL ANALYSIS ABBREVATIONS
SMA – Simple Moving Average
EMA – Exponential Moving Average
WMA – Weighted Moving Average
Disclaimer
This document is not for public distribution and has been furnished to you solely for your information and must not be
reproduced or redistributed to any other person. Persons into whose possession this document may come are
required to observe these restrictions.
This material is for the personal information of the authorized recipient, and we are not soliciting any action based
upon it. This report is not to be construed as an offer to sell or the solicitation of an offer to buy any security in any
jurisdiction where such an offer or solicitation would be illegal. It is for the general information of clients of Keynote
Capitals Ltd. It does not constitute a personal recommendation or take into account the particular investment
objectives, financial situations, or needs of individual clients.
We have reviewed the report, and in so far as it includes current or historical information, it is believed to be reliable
though its accuracy or completeness cannot be guaranteed. Neither Keynote Capitals Ltd., nor any person connected
with it, accepts any liability arising from the use of this document. The recipients of this material should rely on their
own investigations and take their own professional advice. Price and value of the investments referred to in this
material may go up or down. Past performance is not a guide for future performance. Certain transactions -including
those involving futures, options and other derivatives as well as non-investment grade securities - involve substantial
risk and are not suitable for all investors. Reports based on technical analysis centers on studying charts of a stock’s
price movement and trading volume, as opposed to focusing on a company’s fundamentals and as such, may not
match with a report on a company’s fundamentals.
Opinions expressed are our current opinions as of the date appearing on this material only. While we endeavor to
update on a reasonable basis the information discussed in this material, there may be regulatory, compliance, or
other reasons that prevent us from doing so. Prospective investors and others are cautioned that any forward-looking
statements are not predictions and may be subject to change without notice. Our proprietary trading and investment
businesses may make investment decisions that are inconsistent with the recommendations expressed herein.
We and our affiliates, officers, directors, and employees world wide may: (a) from time to time, have long or short
positions in, and buy or sell the securities thereof, of company (ies) mentioned herein or (b) be engaged in any other
transaction involving such securities and earn brokerage or other compensation or act as a market maker in the
financial instruments of the company (ies) discussed herein or act as advisor or lender / borrower to such company
(ies) or have other potential conflict of interest with respect to any recommendation and related information and
opinions.
The analyst for this report certifies that all of the views expressed in this report accurately reflect his or her personal
views about the subject company or companies and its or their securities, and no part of his or her compensation
was, is or will be, directly or indirectly related to specific recommendations or views expressed in this report.
No part of this material may be duplicated in any form and/or redistributed without Keynote Capitals Ltd’s., prior
written consent.
Keynote Capitals Ltd.
The Ruby, 9th Floor, Senapati Bapat Marg, Dadar (W), Mumbai, India – 400028. Tel: 3026 6000 / 2269 4322
www.keynotecapitals.com