MCX Commodities Technical Levels For 29/11/12
•
0 likes•431 views

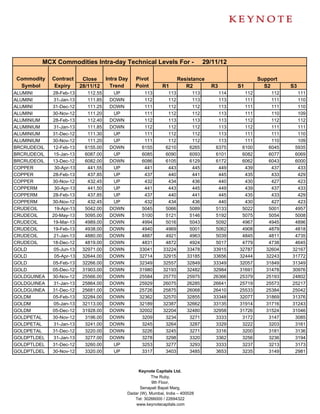
The document provides the intra-day technical levels for various commodities contracts traded on MCX for November 29, 2012. It lists the commodity, contract expiry, previous day's close price, intra-day trend, pivot point, resistance and support levels. The pivot point is an intra-day trading tool and the trend is valid until the price trades above or below the pivot point. The analysis is provided by Sanjay Bhatia, AVP - Technical Research at Keynote Capital to help traders identify intra-day support and resistance levels.

Recommended
Recommended
More Related Content
What's hot
What's hot (20)
Viewers also liked
Viewers also liked (20)
Similar to MCX Commodities Technical Levels For 29/11/12
Similar to MCX Commodities Technical Levels For 29/11/12 (11)
More from Keynote Capitals Ltd.
More from Keynote Capitals Ltd. (20)
Recently uploaded
Recently uploaded (20)
MCX Commodities Technical Levels For 29/11/12
- 1. MCX Commodities Intra-day Technical Levels For - 29/11/12 Commodity Contract Close Intra Day Pivot Resistance Support Symbol Expiry 28/11/12 Trend Point R1 R2 R3 S1 S2 S3 ALUMINI 28-Feb-13 112.55 UP 113 113 113 114 112 112 111 ALUMINI 31-Jan-13 111.85 DOWN 112 112 113 113 111 111 110 ALUMINI 31-Dec-12 111.25 DOWN 111 112 112 113 111 111 110 ALUMINI 30-Nov-12 111.20 UP 111 112 112 113 111 110 109 ALUMINIUM 28-Feb-13 112.40 DOWN 112 113 113 113 112 112 112 ALUMINIUM 31-Jan-13 111.85 DOWN 112 112 112 113 112 111 111 ALUMINIUM 31-Dec-12 111.30 UP 111 112 112 113 111 111 110 ALUMINIUM 30-Nov-12 111.20 UP 111 112 112 113 111 110 109 BRCRUDEOIL 12-Feb-13 6155.00 DOWN 6155 6210 6265 6375 6100 6045 5935 BRCRUDEOIL 15-Jan-13 6087.00 UP 6085 6090 6093 6101 6082 6077 6069 BRCRUDEOIL 13-Dec-12 6082.00 DOWN 6086 6105 6129 6172 6062 6043 6000 COPPER 30-Apr-13 441.55 UP 441 443 445 449 439 437 433 COPPER 28-Feb-13 437.85 UP 437 440 441 445 435 433 429 COPPER 30-Nov-12 432.45 UP 432 434 436 440 430 427 423 COPPERM 30-Apr-13 441.50 UP 441 443 445 449 439 437 433 COPPERM 28-Feb-13 437.85 UP 437 440 441 445 435 433 429 COPPERM 30-Nov-12 432.45 UP 432 434 436 440 430 427 423 CRUDEOIL 19-Apr-13 5042.00 DOWN 5045 5066 5089 5133 5022 5001 4957 CRUDEOIL 20-May-13 5095.00 DOWN 5100 5121 5146 5192 5075 5054 5008 CRUDEOIL 19-Mar-13 4989.00 DOWN 4994 5016 5043 5092 4967 4945 4896 CRUDEOIL 19-Feb-13 4938.00 DOWN 4940 4969 5001 5062 4908 4879 4818 CRUDEOIL 21-Jan-13 4880.00 DOWN 4887 4921 4963 5039 4845 4811 4735 CRUDEOIL 18-Dec-12 4819.00 DOWN 4831 4872 4924 5017 4779 4738 4645 GOLD 05-Jun-13 32971.00 DOWN 33041 33224 33478 33915 32787 32604 32167 GOLD 05-Apr-13 32644.00 DOWN 32714 32915 33185 33656 32444 32243 31772 GOLD 05-Feb-13 32266.00 DOWN 32349 32557 32849 33349 32057 31849 31349 GOLD 05-Dec-12 31903.00 DOWN 31980 32193 32482 32984 31691 31478 30976 GOLDGUINEA 30-Nov-12 25566.00 DOWN 25584 25770 25975 26366 25379 25193 24802 GOLDGUINEA 31-Jan-13 25864.00 DOWN 25929 26075 26285 26641 25719 25573 25217 GOLDGUINEA 31-Dec-12 25681.00 DOWN 25726 25875 26068 26410 25533 25384 25042 GOLDM 05-Feb-13 32284.00 DOWN 32362 32570 32855 33348 32077 31869 31376 GOLDM 05-Jan-13 32113.00 DOWN 32189 32387 32662 33135 31914 31716 31243 GOLDM 05-Dec-12 31928.00 DOWN 32002 32204 32480 32958 31726 31524 31046 GOLDPETAL 30-Nov-12 3196.00 DOWN 3209 3234 3271 3333 3172 3147 3085 GOLDPETAL 31-Jan-13 3241.00 DOWN 3245 3264 3287 3329 3222 3203 3161 GOLDPETAL 31-Dec-12 3220.00 DOWN 3226 3245 3271 3316 3200 3181 3136 GOLDPTLDEL 31-Jan-13 3277.00 DOWN 3278 3298 3320 3362 3256 3236 3194 GOLDPTLDEL 31-Dec-12 3260.00 UP 3253 3277 3293 3333 3237 3213 3173 GOLDPTLDEL 30-Nov-12 3320.00 UP 3317 3403 3485 3653 3235 3149 2981 Keynote Capitals Ltd. The Ruby, 9th Floor, Senapati Bapat Marg, Dadar (W), Mumbai, India – 400028 Tel: 30266000 / 22694322 www.keynotecapitals.com
- 2. MCX Commodities Intra-day Technical Levels For - 29/11/12 Commodity Contract Close Intra Day Pivot Resistance Support Symbol Expiry 28/11/12 Trend Point R1 R2 R3 S1 S2 S3 LEAD 28-Feb-13 121.50 UP 121 122 122 123 121 120 119 LEAD 31-Jan-13 121.45 UP 121 122 123 124 121 120 119 LEAD 31-Dec-12 121.80 UP 122 122 123 124 121 120 119 LEAD 30-Nov-12 121.95 UP 122 123 123 125 121 120 119 LEADMINI 28-Feb-13 121.35 UP 121 122 122 123 121 120 119 LEADMINI 31-Jan-13 121.45 UP 121 122 122 124 121 120 119 LEADMINI 31-Dec-12 121.75 UP 122 122 123 124 121 120 119 LEADMINI 30-Nov-12 121.95 UP 122 123 123 125 121 120 118 NATURALGAS 25-Feb-13 212.40 DOWN 214 216 220 227 210 207 201 NATURALGAS 28-Jan-13 212.10 DOWN 214 217 222 229 209 206 199 NATURALGAS 26-Dec-12 210.30 DOWN 212 215 219 226 208 205 199 NICKEL 28-Feb-13 968.30 UP 965 973 977 989 961 953 941 NICKEL 31-Jan-13 956.80 DOWN 957 963 969 982 951 944 932 NICKEL 31-Dec-12 949.50 DOWN 950 956 963 976 943 936 923 NICKEL 30-Nov-12 942.10 UP 942 950 957 972 934 927 912 NICKELM 28-Feb-13 963.70 UP 963 969 975 986 958 952 940 NICKELM 31-Jan-13 956.30 DOWN 956 963 970 983 950 943 930 NICKELM 31-Dec-12 949.40 DOWN 952 962 975 997 940 930 907 NICKELM 30-Nov-12 942.10 DOWN 942 949 957 971 935 928 913 SILVER 04-May-13 66602.00 UP 66383 67279 67957 69531 65705 64809 63235 SILVER 05-Mar-13 65131.00 UP 64903 65829 66528 68153 64204 63278 61653 SILVER 05-Dec-12 63110.00 UP 62891 63832 64553 66215 62170 61229 59567 SILVER1000 31-Dec-12 63438.00 DOWN 63538 63779 64119 64700 63198 62957 62376 SILVER1000 30-Nov-12 62475.00 DOWN 62485 63271 64066 65647 61690 60904 59323 SILVERM 30-Apr-13 66622.00 UP 66403 67307 67991 69579 65719 64815 63227 SILVERM 28-Feb-13 65141.00 UP 64921 65841 66540 68159 64222 63302 61683 SILVERM 30-Nov-12 63103.00 UP 62890 63829 64556 66222 62163 61224 59558 SILVERMIC 30-Apr-13 66628.00 UP 66407 67324 68020 69633 65711 64794 63181 SILVERMIC 28-Feb-13 65141.00 UP 64925 65844 66548 68171 64221 63302 61679 SILVERMIC 30-Nov-12 63104.00 UP 62883 63840 64577 66271 62146 61189 59495 STEELRPR 20-Feb-13 31280.00 DOWN 31280 31350 31420 31560 31210 31140 31000 STEELRPR 18-Jan-13 31040.00 UP 31033 31137 31233 31433 30937 30833 30633 STEELRPR 20-Dec-12 30690.00 UP 30670 30770 30850 31030 30590 30490 30310 ZINC 31-Jan-13 110.85 UP 111 111 112 113 110 110 109 ZINC 31-Dec-12 110.20 UP 110 111 111 112 110 109 108 ZINC 30-Nov-12 109.50 UP 109 110 111 112 109 108 107 ZINCMINI 28-Feb-13 111.45 UP 111 112 112 113 111 111 110 ZINCMINI 31-Jan-13 110.85 UP 111 111 112 113 110 110 109 ZINCMINI 31-Dec-12 110.20 UP 110 111 111 112 110 109 108 Keynote Capitals Ltd. The Ruby, 9th Floor, Senapati Bapat Marg, Dadar (W), Mumbai, India – 400028 Tel: 30266000 / 22694322 www.keynotecapitals.com
- 3. MCX Commodities Intra-day Technical Levels For - 29/11/12 Commodity Contract Close Intra Day Pivot Resistance Support Symbol Expiry 28/11/12 Trend Point R1 R2 R3 S1 S2 S3 ZINCMINI 30-Nov-12 109.50 UP 109 110 110 112 109 108 107 Sanjay Bhatia (AVP – Technical Research), Email Id sanjay@keynotecapitals.net Pivot Point: Intra- Day Trading Tool. - The key to the use of this tool is the use of Stop Loss Intra Day Trend: It is valid only till the point where Price trades above Pivot Point. For Eg. “UP” would be valid till Price remains above Pivot Point. It would become “DOWN” in event Price trades below Pivot Point. Pivot Point (PP): This is a trigger point for Intra Day Buy / Sell based on the price range of the previous day. R1: Resistance 1: 1st Resistance level over Pivot Point, R2: Resistance 2: Next Resistance level after R1. R3: Resistance 3: Next Resistance level after R2. S1: Support 1: 1st Support level after Pivot Point, S2: Support 2: Next Support level after S1. S3: Support 3: Next Support level after S2. Note: As per this tool, the trader should take BUY position just above the Pivot Point and keep the Pivot Point level as stop loss and the first target would be R1 level (Resistance 1). If R1 is crossed then R2 (Resistance 2) becomes the next target with the stop loss placed at R1 level. If R2 is crossed then R3 (Resistance 3) becomes the next target with the stop loss placed at R2 level. Similarly if price goes below the Pivot Point the trader should take a SELL position and keep the Pivot Point level as the stop loss and the first target would be S1 level (Support 1). If S1 level is breached then S2 level (Support 2) becomes the next target with the stop loss placed at S1 level. If S2 level is breached then S3 level (Support 3) becomes the next target with the stop loss placed at S2 level. Disclaimer: This document is not for public distribution and has been furnished to you solely for your information and must not be reproduced or redistributed to any other person. Persons into whose possession this document may come are required to observe these restrictions. This material is for the personal information of the authorized recipient, and we are not soliciting any action based upon it. This report is not to be construed as an offer to sell or the solicitation of an offer to buy any security in any jurisdiction where such an offer or solicitation would be illegal. It is for the general information of clients of Keynote Capitals Ltd. It does not constitute a personal recommendation or take into account the particular investment objectives, financial situations, or needs of individual clients. We have reviewed the report, and in so far as it includes current or historical information, it is believed to be reliable though its accuracy or completeness cannot be guaranteed. Neither Keynote Capitals Ltd., nor any person connected with it, accepts any liability arising from the use of this document. The recipients of this material should rely on their own investigations and take their own professional advice. Price and value of the investments referred to in this material may go up or down. Past performance is not a guide for future performance. Certain transactions -including those involving futures, options and other derivatives as well as non-investment grade securities - involve substantial risk and are not suitable for all investors. Reports based on technical analysis centers on studying charts of a stock’s price movement and trading volume, as opposed to focusing on a company’s fundamentals and as such, may not match with a report on a company’s fundamentals. Opinions expressed are our current opinions as of the date appearing on this material only. While we endeavor to update on a reasonable basis the information discussed in this material, there may be regulatory, compliance, or other reasons that prevent us from doing so. Prospective investors and others are cautioned that any forward-looking statements are not predictions and may be subject to change without notice. Our proprietary trading and investment businesses may make investment decisions that are inconsistent with the recommendations expressed herein. We and our affiliates, officers, directors, and employees world wide may: (a) from time to time, have long or short positions in, and buy or sell the securities thereof, of company (ies) mentioned herein or (b) be engaged in any other transaction involving such securities and earn brokerage or other compensation or act as a market maker in the financial instruments of the company (ies) discussed herein or act as advisor or lender / borrower to such company (ies) or have other potential conflict of interest with respect to any recommendation and related information and opinions. The analyst for this report certifies that all of the views expressed in this report accurately reflect his or her personal views about the subject company or companies and its or their securities, and no part of his or her compensation was, is or will be, directly or indirectly related to specific recommendations or views expressed in this report. No part of this material may be duplicated in any form and/or redistributed without Keynote Capitals Ltd’s., prior written consent. Keynote Capitals Ltd. The Ruby, 9th Floor, Senapati Bapat Marg, Dadar (W), Mumbai, India – 400028 Tel: 30266000 / 22694322 www.keynotecapitals.com