The CMO Survey - Highlights and Insights Report - Spring 2024
Keynote technicals commodity intraday levels for 120912
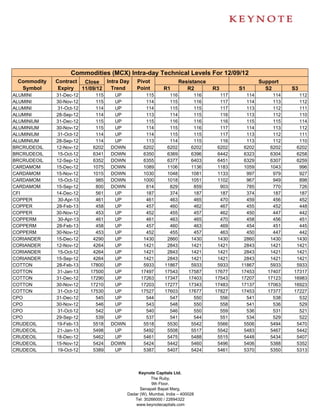
1. Commodities (MCX) Intra-day Technical Levels For 12/09/12
Commodity Contract Close Intra Day Pivot Resistance Support
Symbol Expiry 11/09/12 Trend Point R1 R2 R3 S1 S2 S3
ALUMINI 31-Dec-12 115 UP 115 116 116 117 114 114 112
ALUMINI 30-Nov-12 115 UP 114 115 116 117 114 113 112
ALUMINI 31-Oct-12 114 UP 114 115 115 117 113 112 111
ALUMINI 28-Sep-12 114 UP 113 114 115 116 113 112 110
ALUMINIUM 31-Dec-12 115 UP 115 116 116 116 115 115 114
ALUMINIUM 30-Nov-12 115 UP 114 115 116 117 114 113 112
ALUMINIUM 31-Oct-12 114 UP 114 115 115 117 113 112 111
ALUMINIUM 28-Sep-12 114 UP 113 114 115 116 113 112 110
BRCRUDEOIL 12-Nov-12 6202 DOWN 6202 6202 6202 6202 6202 6202 6202
BRCRUDEOIL 15-Oct-12 6341 DOWN 6350 6369 6396 6442 6323 6304 6258
BRCRUDEOIL 12-Sep-12 6352 DOWN 6355 6377 6403 6451 6329 6307 6259
CARDAMOM 15-Dec-12 1075 DOWN 1089 1106 1136 1183 1059 1043 996
CARDAMOM 15-Nov-12 1015 DOWN 1030 1048 1081 1133 997 979 927
CARDAMOM 15-Oct-12 985 DOWN 1000 1018 1051 1102 967 949 898
CARDAMOM 15-Sep-12 800 DOWN 814 829 859 903 785 770 726
CFI 14-Dec-12 561 UP 187 374 187 187 374 187 187
COPPER 30-Apr-13 461 UP 461 463 465 470 459 456 452
COPPER 28-Feb-13 458 UP 457 460 462 467 455 452 448
COPPER 30-Nov-12 453 UP 452 455 457 462 450 447 442
COPPERM 30-Apr-13 461 UP 461 463 465 470 458 456 451
COPPERM 28-Feb-13 458 UP 457 460 463 469 454 451 445
COPPERM 30-Nov-12 453 UP 452 455 457 463 450 447 442
CORIANDER 15-Dec-12 4290 UP 1430 2860 1430 1430 2860 1430 1430
CORIANDER 12-Nov-12 4264 UP 1421 2843 1421 1421 2843 1421 1421
CORIANDER 15-Oct-12 4264 UP 1421 2843 1421 1421 2843 1421 1421
CORIANDER 15-Sep-12 4264 UP 1421 2843 1421 1421 2843 1421 1421
COTTON 28-Feb-13 17800 UP 5933 11867 5933 5933 11867 5933 5933
COTTON 31-Jan-13 17500 UP 17497 17543 17587 17677 17453 17407 17317
COTTON 31-Dec-12 17290 UP 17263 17347 17403 17543 17207 17123 16983
COTTON 30-Nov-12 17210 UP 17203 17277 17343 17483 17137 17063 16923
COTTON 31-Oct-12 17530 UP 17527 17603 17677 17827 17453 17377 17227
CPO 31-Dec-12 545 UP 544 547 550 556 541 538 532
CPO 30-Nov-12 546 UP 543 548 550 558 541 536 529
CPO 31-Oct-12 542 UP 540 546 550 559 536 531 521
CPO 29-Sep-12 539 UP 537 541 544 551 534 529 522
CRUDEOIL 19-Feb-13 5518 DOWN 5518 5530 5542 5566 5506 5494 5470
CRUDEOIL 21-Jan-13 5498 UP 5492 5508 5517 5542 5483 5467 5442
CRUDEOIL 18-Dec-12 5462 UP 5461 5475 5488 5515 5448 5434 5407
CRUDEOIL 15-Nov-12 5424 DOWN 5424 5442 5460 5496 5406 5388 5352
CRUDEOIL 19-Oct-12 5389 UP 5387 5407 5424 5461 5370 5350 5313
Keynote Capitals Ltd.
The Ruby,
9th Floor,
Senapati Bapat Marg,
Dadar (W), Mumbai, India – 400028
Tel: 30266000 / 22694322
www.keynotecapitals.com
2. Commodities (MCX) Intra-day Technical Levels For 12/09/12
Commodity Contract Close Intra Day Pivot Resistance Support
Symbol Expiry 11/09/12 Trend Point R1 R2 R3 S1 S2 S3
CRUDEOIL 19-Sep-12 5356 UP 5351 5377 5398 5445 5330 5304 5257
GOLD 05-Apr-13 33025 DOWN 33031 33081 33138 33245 32974 32924 32817
GOLD 05-Feb-13 32593 DOWN 32625 32688 32783 32941 32530 32467 32309
GOLD 05-Dec-12 32252 DOWN 32266 32339 32427 32588 32178 32105 31944
GOLD 05-Oct-12 31876 DOWN 31886 31963 32051 32216 31798 31721 31556
GOLDGUINEA 30-Nov-12 25774 DOWN 25788 25836 25897 26006 25727 25679 25570
GOLDGUINEA 31-Oct-12 25629 DOWN 25643 25694 25759 25875 25578 25527 25411
GOLDGUINEA 29-Sep-12 25571 DOWN 25581 25640 25710 25839 25511 25452 25323
GOLDM 05-Dec-12 32266 DOWN 32279 32359 32451 32623 32187 32107 31935
GOLDM 05-Nov-12 32058 DOWN 32073 32147 32236 32399 31984 31910 31747
GOLDM 05-Oct-12 31896 DOWN 31906 31982 32067 32228 31821 31745 31584
GOLDPETAL 30-Nov-12 3234 UP 3229 3265 3296 3363 3198 3162 3095
GOLDPETAL 31-Oct-12 3217 DOWN 3218 3225 3233 3248 3210 3203 3188
GOLDPETAL 29-Sep-12 3205 DOWN 3205 3213 3220 3235 3198 3190 3175
GOLDPTLDEL 30-Nov-12 3319 DOWN 3322 3334 3349 3376 3307 3295 3268
GOLDPTLDEL 31-Oct-12 3285 DOWN 3289 3308 3331 3373 3266 3247 3205
GOLDPTLDEL 29-Sep-12 3303 DOWN 3308 3317 3331 3354 3294 3285 3262
IRONORE 31-Oct-12 4549 UP 1516 3033 1516 1516 3033 1516 1516
IRONORE 28-Sep-12 4532 UP 1511 3021 1511 1511 3021 1511 1511
KAPAS 30-Apr-13 1023 UP 1018 1034 1046 1073 1007 991 963
KAPAS 30-Mar-13 1014 UP 1010 1024 1034 1058 1000 986 962
LEAD 31-Dec-12 117 UP 117 118 119 120 117 116 114
LEAD 30-Nov-12 117 UP 117 118 118 120 117 116 115
LEAD 31-Oct-12 117 UP 117 118 118 120 116 115 114
LEAD 28-Sep-12 117 UP 116 117 118 119 116 115 114
LEADMINI 31-Dec-12 117 UP 117 118 118 120 117 116 115
LEADMINI 30-Nov-12 118 UP 117 118 119 120 117 116 114
LEADMINI 31-Oct-12 117 UP 117 118 118 120 116 115 114
LEADMINI 28-Sep-12 117 UP 116 117 118 119 116 115 114
MAIZE 20-Nov-12 1524 UP 508 1016 508 508 1016 508 508
MAIZE 19-Oct-12 1528 UP 509 1019 509 509 1019 509 509
MAIZE 20-Sep-12 1534 UP 511 1023 511 511 1023 511 511
MENTHAOIL 31-Dec-12 1375 DOWN 1385 1395 1415 1446 1364 1354 1324
MENTHAOIL 30-Nov-12 1353 DOWN 1369 1384 1416 1463 1337 1322 1274
MENTHAOIL 31-Oct-12 1335 DOWN 1352 1370 1404 1457 1317 1300 1248
MENTHAOIL 29-Sep-12 1315 DOWN 1331 1347 1379 1427 1299 1283 1234
NATURALGAS 27-Nov-12 186 UP 183 189 192 202 179 173 164
NATURALGAS 26-Oct-12 173 UP 169 177 181 194 165 157 144
NATURALGAS 25-Sep-12 166 UP 162 171 177 192 156 147 132
NICKEL 31-Dec-12 952 UP 952 955 959 966 948 945 937
Keynote Capitals Ltd.
The Ruby,
9th Floor,
Senapati Bapat Marg,
Dadar (W), Mumbai, India – 400028
Tel: 30266000 / 22694322
www.keynotecapitals.com
3. Commodities (MCX) Intra-day Technical Levels For 12/09/12
Commodity Contract Close Intra Day Pivot Resistance Support
Symbol Expiry 11/09/12 Trend Point R1 R2 R3 S1 S2 S3
NICKEL 30-Nov-12 945 UP 944 950 954 965 939 933 922
NICKEL 31-Oct-12 936 UP 936 941 946 956 931 926 916
NICKEL 28-Sep-12 927 UP 927 932 937 947 922 917 907
NICKELM 31-Dec-12 952 UP 952 955 959 966 948 945 938
NICKELM 30-Nov-12 945 UP 945 949 954 963 940 936 927
NICKELM 31-Oct-12 936 UP 936 941 946 957 931 925 915
NICKELM 28-Sep-12 927 UP 927 932 937 947 922 917 907
POTATO 15-Mar-13 739 UP 731 753 768 805 716 694 657
POTATO 15-Oct-12 1060 UP 1055 1071 1082 1109 1044 1028 1002
POTATO 15-Sep-12 975 DOWN 985 1001 1028 1071 958 942 899
POTATOTRWR 15-Oct-12 899 UP 895 909 919 942 885 872 848
POTATOTRWR 15-Sep-12 896 UP 299 597 299 299 597 299 299
REFSOYOIL 15-Nov-12 785 UP 262 523 262 262 523 262 262
REFSOYOIL 15-Oct-12 785 UP 262 523 262 262 523 262 262
REFSOYOIL 15-Sep-12 781 UP 260 521 260 260 521 260 260
SILVER 04-May-13 67079 DOWN 67111 67317 67554 67997 66874 66668 66225
SILVER 05-Mar-13 65536 DOWN 65642 65907 66277 66912 65272 65007 64372
SILVER 05-Dec-12 63804 DOWN 63911 64183 64563 65215 63531 63259 62607
SILVERM 30-Apr-13 67054 DOWN 67156 67411 67768 68380 66799 66544 65932
SILVERM 28-Feb-13 65556 DOWN 65668 65935 66314 66960 65289 65022 64376
SILVERM 30-Nov-12 63818 DOWN 63931 64207 64595 65259 63543 63267 62603
SILVERMIC 30-Apr-13 67064 DOWN 67171 67443 67821 68471 66793 66521 65871
SILVERMIC 28-Feb-13 65561 DOWN 65666 65932 66303 66940 65295 65029 64392
SILVERMIC 30-Nov-12 63818 DOWN 63925 64193 64567 65209 63551 63283 62641
SUGARMKOL 20-Dec-12 3555 UP 1185 2370 1185 1185 2370 1185 1185
SUGARMKOL 20-Nov-12 3525 UP 1175 2350 1175 1175 2350 1175 1175
SUGARMKOL 19-Oct-12 3546 UP 1182 2364 1182 1182 2364 1182 1182
SUGARMKOL 20-Sep-12 3551 UP 1184 2367 1184 1184 2367 1184 1184
WHEAT 20-Nov-12 1562 UP 521 1041 521 521 1041 521 521
WHEAT 19-Oct-12 1587 UP 529 1058 529 529 1058 529 529
WHEAT 20-Sep-12 1582 UP 527 1054 527 527 1054 527 527
ZINC 31-Dec-12 112 UP 112 113 113 115 111 110 108
ZINC 30-Nov-12 112 UP 111 112 113 115 110 109 107
ZINC 31-Oct-12 111 UP 111 112 113 115 110 109 107
ZINC 28-Sep-12 110 UP 110 111 112 114 109 108 106
ZINCMINI 31-Dec-12 112 UP 112 113 113 115 111 110 109
ZINCMINI 30-Nov-12 111 UP 111 112 113 115 110 109 107
Keynote Capitals Ltd.
The Ruby,
9th Floor,
Senapati Bapat Marg,
Dadar (W), Mumbai, India – 400028
Tel: 30266000 / 22694322
www.keynotecapitals.com
4. Commodities (MCX) Intra-day Technical Levels For 12/09/12
Commodity Contract Close Intra Day Pivot Resistance Support
Symbol Expiry 11/09/12 Trend Point R1 R2 R3 S1 S2 S3
ZINCMINI 31-Oct-12 111 UP 111 112 113 115 110 109 107
ZINCMINI 28-Sep-12 110 UP 110 111 112 114 109 108 106
Sanjay Bhatia (AVP – Technical Research), Email Id sanjay@keynotecapitals.net
Pivot Point: Intra- Day Trading Tool. - The key to the use of this tool is the use of Stop Loss
Intra Day Trend: It is valid only till the point where Price trades above Pivot Point. For Eg. “UP” would be valid till Price
remains above Pivot Point. It would become “DOWN” in event Price trades below Pivot Point.
Pivot Point (PP): This is a trigger point for Intra Day Buy / Sell based on the price range of the previous day.
R1: Resistance 1: 1st Resistance level over Pivot Point, R2: Resistance 2: Next Resistance level after R1.
R3: Resistance 3: Next Resistance level after R2.
S1: Support 1: 1st Support level after Pivot Point, S2: Support 2: Next Support level after S1.
S3: Support 3: Next Support level after S2.
Note: As per this tool, the trader should take BUY position just above the Pivot Point and keep the Pivot Point level as stop
loss and the first target would be R1 level (Resistance 1). If R1 is crossed then R2 (Resistance 2) becomes the next target
with the stop loss placed at R1 level. If R2 is crossed then R3 (Resistance 3) becomes the next target with the stop loss
placed at R2 level.
Similarly if price goes below the Pivot Point the trader should take a SELL position and keep the Pivot Point level as the
stop loss and the first target would be S1 level (Support 1). If S1 level is breached then S2 level (Support 2) becomes the
next target with the stop loss placed at S1 level. If S2 level is breached then S3 level (Support 3) becomes the next target
with the stop loss placed at S2 level.
Disclaimer: This document is not for public distribution and has been furnished to you solely for your information and must not be reproduced or
redistributed to any other person. Persons into whose possession this document may come are required to observe these restrictions. This material is
for the personal information of the authorized recipient, and we are not soliciting any action based upon it. This report is not to be construed as an offer
to sell or the solicitation of an offer to buy any security in any jurisdiction where such an offer or solicitation would be illegal. It is for the general
information of clients of Keynote Capitals Ltd. It does not constitute a personal recommendation or take into account the particular investment objectives,
financial situations, or needs of individual clients. We have reviewed the report, and in so far as it includes current or historical information, it is believed
to be reliable though its accuracy or completeness cannot be guaranteed. Neither Keynote Capitals Ltd., nor any person connected with it, accepts any
liability arising from the use of this document. The recipients of this material should rely on their own investigations and take their own professional
advice. Price and value of the investments referred to in this material may go up or down. Past performance is not a guide for future performance.
Certain transactions -including those involving futures, options and other derivatives as well as non-investment grade securities - involve substantial risk
and are not suitable for all investors. Reports based on technical analysis centers on studying charts of a stock’s price movement and trading volume, as
opposed to focusing on a company’s fundamentals and as such, may not match with a report on a company’s fundamentals. Opinions expressed are our
current opinions as of the date appearing on this material only. While we endeavor to update on a reasonable basis the information discussed in this
material, there may be regulatory, compliance, or other reasons that prevent us from doing so. Prospective investors and others are cautioned that any
forward-looking statements are not predictions and may be subject to change without notice. Our proprietary trading and investment businesses may
make investment decisions that are inconsistent with the recommendations expressed herein. We and our affiliates, officers, directors, and employees
world wide may: (a) from time to time, have long or short positions in, and buy or sell the securities thereof, of company (ies) mentioned herein or (b) be
engaged in any other transaction involving such securities and earn brokerage or other compensation or act as a market maker in the financial
instruments of the company (ies) discussed herein or act as advisor or lender / borrower to such company (ies) or have other potential conflict of interest
with respect to any recommendation and related information and opinions. The analyst for this report certifies that all of the views expressed in this
report accurately reflect his or her personal views about the subject company or companies and its or their securities, and no part of his or her
compensation was, is or will be, directly or indirectly related to specific recommendations or views expressed in this report. No part of this material may
be duplicated in any form and/or redistributed without Keynote Capitals Ltd’s., prior written consent.
Keynote Capitals Ltd.
The Ruby,
9th Floor,
Senapati Bapat Marg,
Dadar (W), Mumbai, India – 400028
Tel: 30266000 / 22694322
www.keynotecapitals.com