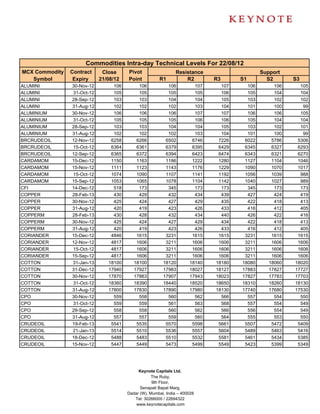
This document provides the intra-day technical levels for various MCX commodities on August 22, 2012. It lists the commodity symbol, contract expiry date, previous day's close price, pivot point, and resistance and support levels (R1-R3 and S1-S3). The commodities included are aluminum, crude oil, copper, cotton, gold, natural gas, and others. The levels are used to analyze the commodity's price movement and determine potential resistance and support areas.
The document provides daily technical levels for various commodities traded on the MCX commodity exchange in India. It lists the symbol, contract expiry date, previous day's close price, pivot point, and resistance and support levels for each commodity. The levels are used to analyze intraday trading opportunities and gauge market strength and weakness.
The document provides daily technical levels for various MCX commodities including pivot points and resistance and support levels. It lists the commodity, contract expiry date, previous day's close price, calculated pivot point, and resistance and support price levels for intraday trading. The levels are calculated based on previous price data to determine likely trading ranges and support/resistance thresholds for each commodity on the given date.
The document provides daily technical levels for various commodities traded on the MCX exchange in India, including pivot points and resistance and support levels. For each commodity, it lists the contract expiry date, previous day's close price, and calculated pivot point as well as resistance and support price levels. This technical analysis is intended to help traders identify potential price movement zones for intraday trading on August 27, 2012.
The document provides a technical analysis of commodity futures contracts traded on the MCX exchange in India. It lists the symbol, expiry date, previous day's close, pivot point, and resistance and support levels for each commodity contract. The commodities include metals like aluminum, copper and zinc, agricultural commodities like cotton, crude palm oil, and spices. The analysis is intended to help traders identify potential resistance and support levels for intraday trading.
The document provides daily technical levels for various commodities traded on the MCX exchange in India. It lists the commodity, contract expiry date, previous day's close price, pivot point, and resistance and support levels. The levels can be used by traders to identify potential support and resistance levels for intraday trading. The document contains this information for over 40 commodities traded on MCX.
The document provides daily technical levels for various commodities traded on the MCX commodity exchange in India. It lists the commodity, contract expiry date, previous day's close price, pivot point, and resistance and support levels for intra-day trading. The levels are used to identify potential price points where buying and selling pressure may occur during the trading day.
The document provides the intra-day technical levels for various MCX commodities on August 28, 2012. It lists the commodity symbol, contract expiry date, previous day's close price, pivot point, and resistance and support levels (R1, R2, R3, S1, S2, S3). The commodities include aluminum, crude oil, copper, cotton, gold, and natural gas. The levels can be used by traders to identify potential resistance and support levels for intra-day trading on those commodities on the given date.
The document provides daily technical levels for various commodities traded on the MCX exchange in India. It lists the commodity, contract expiry date, previous day's close price, pivot point, and resistance and support levels. The levels are used to analyze intraday trading opportunities and gauge market strength and weakness.
The document provides intra-day technical levels for various commodities traded on the MCX exchange for August 31, 2012. It lists the commodity symbol, contract expiry date, previous day's close price, intra-day trend, pivot point, and resistance and support levels. The commodities include aluminum, crude oil, copper, cotton, gold, natural gas, nickel, and others. The trends and levels can be used by traders to identify potential support and resistance in prices during the trading session.
The document provides intra-day technical levels for various commodities trading on the Multi Commodity Exchange of India (MCX) as of August 30, 2012. It lists the commodity, contract expiry date, previous day's close price, identified trend (up or down), pivot point, and resistance and support levels for intra-day trading. Pivot points and resistance and support levels are identified based on technical analysis of recent price movements to suggest likely trading ranges.
The document provides a table listing the intra-day technical levels for various commodities contracts traded on the Multi Commodity Exchange of India (MCX) as of October 9, 2012. The table includes the commodity symbol, contract expiry date, previous day's close price, intra-day trend, pivot point, resistance and support levels. Technical analysis is used to identify levels of resistance and support for traders of each commodity contract.
The document provides a table listing the intra-day technical levels for various commodities traded on the MCX exchange for April 9, 2012. The table includes the commodity symbol, contract expiry date, previous day's close price, intra-day trend, pivot point, resistance and support levels for trading that commodity on that day. Over 25 commodities are listed along with their key technical indicators to guide intra-day trading.
The document provides a table listing the intra-day technical levels for various commodities traded on the MCX exchange in India on December 9, 2012. The table includes the commodity name, contract expiry date, previous day's close price, intra-day trend, pivot point, resistance and support levels. Technical analysis is used to identify expected price movement and trading opportunities.
The document provides a table listing the intra-day technical levels for various commodities traded on the MCX exchange in India on March 9, 2012. The table includes the commodity symbol, contract expiry date, previous day's close price, intra-day trend, pivot point, and resistance and support levels for trading that commodity on that day.
This document provides the intra-day technical levels for various commodities trading on the MCX exchange for June 9, 2012. It lists the commodity, contract expiry date, previous day's close price, intra-day trend, pivot point, and resistance and support levels. The commodities listed include aluminum, crude oil, copper, cotton, gold, nickel, and others.
The document provides intra-day technical levels for various commodities traded on the MCX exchange for November 9, 2012. It lists the commodity, contract expiry date, previous day's close price, intra-day trend, pivot point, resistance and support levels. Technical analysis is used to determine trading levels and identify potential resistance and support areas for each commodity on an intra-day basis.
The document provides a technical analysis of various commodity futures contracts traded on the MCX exchange in India. It lists the commodity, contract expiration date, previous day's close price, intraday trend, pivot points, resistance and support levels for each contract. The analysis is intended to help traders identify potential price movement and trading opportunities in these commodities.
The document provides intra-day technical levels for various commodities trading on the MCX exchange for May 9, 2012. It lists the commodity, contract expiry date, previous day's close price, intra-day trend, pivot point, and resistance and support levels for each commodity. The levels can be used by traders to identify potential price points for entries and exits on intra-day trades.
The document provides intra-day technical levels for various commodities trading on the MCX exchange for September 20, 2012. It lists the commodity, contract expiry date, previous day's close price, intra-day trend, pivot point, and resistance and support levels for each commodity. Pivot points, resistance and support levels are given to analyze price movement and identify potential trading opportunities.
The document provides the intra-day technical levels for various commodities trading on the MCX exchange in India on September 26, 2012. It includes the commodity name, contract expiry date, previous day's close price, intra-day trend, pivot point, and resistance and support levels. The commodities include metals like aluminum, copper and lead, agricultural commodities like cotton, crude palm oil and spices, and energy commodities like crude oil and natural gas.
The document provides intra-day technical levels for various commodities traded on the MCX commodity exchange in India on 07/11/12. It lists the commodity, contract expiry date, previous day's close price, intra-day trend, pivot point, and resistance and support levels. The levels are used to analyze the commodity's price movement and determine potential support and resistance zones on that trading day.
The document provides a technical analysis of various commodity futures contracts traded on the MCX commodity exchange in India. It lists the commodity, contract, previous day's close, intraday trend, pivot points, resistance and support levels for each contract. The analysis is intended to help traders identify potential price movement and trading opportunities for the day.
The document provides intraday technical levels for various commodities futures contracts traded on the MCX exchange in India. It lists the commodity, contract expiration date, previous day's close price, intraday trend, pivot point, and resistance and support price levels. The levels are used to analyze the commodity's price movement and determine potential support and resistance zones on an intraday basis.
The document provides intra-day technical levels for various commodities for different contract expiry dates. It includes the commodity name, contract expiry, previous day's close price, intra-day trend, pivot point, resistance and support levels. For example, for aluminum expiring on 28-Feb-2013, the previous close was 107.05, the intra-day trend is down, and the pivot, resistance and support levels are provided.
The document provides the intra-day technical levels for various commodities contracts traded on MCX for November 29, 2012. It lists the commodity, contract expiry, previous day's close price, intra-day trend, pivot point, resistance and support levels. The pivot point is an intra-day trading tool and the trend is valid until the price trades above or below the pivot point. The analysis is provided by Sanjay Bhatia, AVP - Technical Research at Keynote Capital to help traders identify intra-day support and resistance levels.
The document provides intraday technical levels for various commodities for November 15, 2012. It lists the commodity, contract expiry date, previous day's close price, intraday trend, pivot point, resistance and support levels. Technical analysis is used to identify pivot points and potential resistance and support levels for each commodity on an intraday basis.
The document provides intra-day technical levels for various Indian stock market indices and companies for September 27, 2012 futures contracts. It lists the closing price from September 18, the intra-day trend, pivot points and resistance and support levels for each stock. This information can help traders identify potential support and resistance levels to inform their trading decisions on these contracts.
The document provides the intra-day technical levels including pivot points, resistance levels, and support levels for various stocks on the NSE for September 24, 2012. The levels are given for over 100 companies and are intended to help analyze the short term trend and potential price movements for each stock.
- Gold opened lower but touched a high of 29,400 before closing lower at 29,265. Silver opened higher at 52,722, touched a high of 52,912 and closed at 52,735. Crude opened lower at 4,744, touched a high of 4,792 and closed at 4,773.
- Technical indicators suggest further selling pressure for gold and silver but crude faces resistance at 4,855, 4,900 and 5,005 while support is at 4,720, 4,624, 4,421 and 4,259.
- Turnover decreased for gold and silver on the MCX while crude saw an increase compared to the previous day.
Daily commodity report for October 16th, 2012. Gold, silver and crude oil futures closed lower due to selling pressure from technical indicators being placed below their averages. Gold faces resistance at multiple levels up to 32421 and support down to 28859. Silver faces resistance up to 64600 and support down to 53621. Crude oil faces resistance at 5050 and support down to 4467. The report also provides commodity news, economic calendar and disclaimer.
- The Indian stock market opened cautiously after the GDP growth of 6.1% in the third quarter missed estimates and led to losses the previous day.
- Key indices were up marginally, with the Sensex gaining 0.12% and Nifty 0.18%, while mid and small cap indices rose over 1%.
- ONGC and other energy stocks gained, while banks and capital goods stocks declined slightly on concerns over the lower GDP growth.
- Asian markets were mixed in early trade while investors awaited further cues from global economic data releases through the week.
The Indian stock market snapped a five-day losing streak as the Larsen & Toubro stock surged after positive results. Global risk sentiment and RBI intervention in currency markets provided some stability. Most sector indices closed positively, with capital goods, metals, IT and pharma stocks among the major gainers. Market breadth was higher, with advances outnumbering declines. Asian markets fell sharply on concerns about Greece's political impasse forcing new elections. The Indian rupee weakened against the dollar and euro. Key corporate developments included GAIL setting up a joint venture in Tamil Nadu and Adani Gas hiking CNG and industrial gas prices.
The document provides intra-day technical levels for various companies trading on the stock market on 08/08/11. It lists the previous day's closing price and establishes pivot points, resistance levels (R1, R2, R3) and support levels (S1, S2, S3) for each stock based on technical analysis. The levels can be used by traders to identify potential support and resistance as the stocks fluctuate through the trading day.
The document provides daily technical levels for various stocks traded on the Indian stock market, including pivot points and resistance and support levels. It lists the stock ticker, previous day's close, calculated pivot point, and potential resistance and support price points for intraday trading. Over 50 stocks are listed with their corresponding technical analysis indicators.
- The Indian markets opened higher but failed to sustain gains and closed lower due to profit taking following the arrest of Anna Hazare. Trading volumes remained low.
- Technically, market breadth was negative with declines outnumbering advances. Most technical indicators are signaling that sellers have the upper hand, suggesting further downside potential.
- Support levels for Nifty are at 4987, 4806 and 4757. Resistance is at 5195, 5262 and 5364. The markets may see intermittent volatility and take cues from domestic and global news.
The document provides daily technical levels for various stocks including resistance and support levels. It lists the stock name, previous day's close, pivot point, and resistance and support levels R1 through R3 and S1 through S3 respectively for intraday trading on 18/10/11. Over 50 stocks from different sectors are included with their corresponding technical analysis indicators.
The domestic stock markets opened positively but failed to hold gains due to weak European market sentiment and profit taking. The markets ended flat, with the Nifty closing near the day's lows. Technically, indicators show buying support but negatives could weigh on sentiment as earnings season approaches. The Nifty needs to sustain above 4,987 resistance for an upward move.
The domestic markets opened positively but failed to sustain gains due to a lack of follow up buying support and increased selling pressure at higher levels. The markets closed with marginal gains near the day's lows. Technically, market breadth was negative with lower trading volumes, indicating buying was concentrated in large stocks. The Nifty remains below its 50-day simple moving average, and various technical indicators are signaling impending downside risk. The markets may see further selling if the Nifty is unable to move above the 50-day SMA, potentially testing the 5816 support level.
The daily commodity report summarizes prices and trading activity for gold, silver, and crude oil futures on May 29, 2012. Gold prices closed slightly higher after fluctuating during the day between gains and losses. Silver prices also closed modestly higher despite failing to sustain an early price increase. Crude oil prices bounced back from early lows to close with small gains. Technical indicators suggest prices may trade in a narrow range with potential for both further gains and losses.
This document provides tips and exercises for developing flexible thinking and future-proofing yourself against changes. It recommends reinventing yourself, focusing on bringing value, and being the best. Various exercises are presented to train different types of thinking and strengthen mental abilities like noticing details or making connections. Principles of creating memorable messages are outlined. The conclusion encourages developing both logical and creative thinking skills to be adaptive.
The world equally needs builders, explorers, directors and negotiators.Rhea Myers
This document touches on several topics including:
1. The importance of different roles in society such as builders, explorers, directors and negotiators.
2. Quotes about the future potential of the internet and persistence.
3. Brief discussions around issues like defect-free software, social media policies, mapping insignificant places, and the influence of media.
4. Mentions engaging on public platforms, shifting from push to pull communications, and recognizing the role of both human and non-human agents in information creation.
El documento presenta varias preguntas de selección múltiple sobre diversos temas como geometría, geografía, historia e información general. Las preguntas incluyen el número de lados de un cuadrado, la capital de Brasil, el inventor del teléfono, el caballo de El Cid, la esposa del huevo, la esposa de Brad Pitt, el símbolo sexual de Colombia, la montaña más alta del mundo y el mejor equipo de fútbol de Colombia.
The document provides a product datasheet for the AUBTM-23 Bluetooth V2.0 Class 2 module. Key specifications of the module include Bluetooth V2.0+EDR compliance, support for profiles like A2DP and HFP, and interfaces like UART, USB, PCM and I2C. The module is designed to enable cable replacement in applications such as wireless headsets, speakers, car kits and multimedia dongles.
IJERD (www.ijerd.com) International Journal of Engineering Research and Devel...IJERD Editor
This document summarizes a study on improving the performance of an air conditioning system by using a matrix heat exchanger. The study found that adding a matrix heat exchanger between the condenser and expansion valve improved the system's coefficient of performance (COP) and reduced power consumption compared to the standard vapor compression cycle without a heat exchanger. Specifically, the system using the matrix heat exchanger saw a 33.84% reduction in energy consumption and higher COP at different cooling loads compared to the standard system. The results indicate that integrating a matrix heat exchanger enhances the efficiency of an air conditioning system.
IJERD (www.ijerd.com) International Journal of Engineering Research and Devel...IJERD Editor
This document summarizes research on optimizing query retrieval from object-oriented databases using signature declustering trees (SD Trees). SD Trees store signatures for database objects in a clustered format based on set bits, allowing faster retrieval. The researchers stored both set and unset bits in the SD Tree. In experiments, searching signatures with over 50% weight using unset bits in the SD Tree improved search time by approximately 43%. Analytically, the researchers proved the superiority of their approach over alternatives like sequential signature files.
I am convinced we do not only love ourselves in others but hate ourselves in ...Rhea Myers
This document contains a collection of quotes and passages on various topics. Some of the key points discussed include the changing music industry, networks and how they adapt, the importance of deeds over knowledge, and the future of human interaction with technology. The document also provides contact information for the author and credits the sources of content.
The document provides intra-day technical levels for various commodities traded on the MCX exchange in India on August 30, 2012. It lists the commodity, contract expiry date, previous day's close price, identified trend (up or down), pivot point, and resistance and support levels for intra-day trading. The levels are intended to help traders identify potential price points where the market may reverse or stall movement during the trading day.
The document provides intra-day technical levels for various commodities trading on the MCX exchange for September 25, 2012. It lists the commodity, contract expiry date, previous day's close price, intra-day trend, pivot point, and resistance and support levels for intra-day trading. Technical analysis is used to determine expected price movement and trading levels over the course of the day.
This document provides the intraday technical levels for various commodities trading on the Multi Commodity Exchange of India (MCX) as of 28/09/12. It lists the commodity, contract expiry date, previous day's close price, intraday trend, pivot point, and resistance and support levels (R1, R2, R3, S1, S2, S3). Technical levels are used to identify potential resistance and support price points that traders can use as targets or areas to enter/exit positions. The document contains this information for over 40 commodities trading on the MCX.
This document provides the intra-day technical levels for various commodities trading on the MCX exchange for April 10, 2012. It lists the commodity, contract expiry date, previous day's close price, intra-day trend, pivot point, and resistance and support levels. The pivot point, resistance and support levels are used to analyze the commodity's price movement during the trading day.
The document provides intraday technical levels for various commodities traded on the MCX exchange for August 10, 2012. It lists the commodity, contract expiry date, previous day's close price, intraday trend, pivot point, and resistance and support levels. Technical analysis is used to identify levels of resistance and support that could impact the commodity's price movement during the trading day.
The document provides daily technical analysis for various commodities traded on the MCX exchange in India. It lists the commodity, contract expiration date, previous day's close price, identified intraday trend, pivot point, and resistance and support price levels. The technical analysis is intended to help traders identify potential price movement and trading opportunities for the day.
This document provides the intraday technical levels for various commodities trading on the MCX exchange in India as of 03/10/12. It lists the commodity, contract expiry date, previous day's close price, intraday trend, pivot point, and resistance and support levels. The commodities included are aluminum, crude oil, copper, cotton, gold, lead, and others. The levels are intended to help traders identify potential resistance and support levels for intraday trading.
The document provides intra-day technical levels for various commodities trading on the MCX exchange for October 23, 2012. It lists the commodity, contract expiry date, previous day's close price, intra-day trend, pivot point, resistance and support levels. Most commodities were seen to be in a downward trend intra-day. The technical levels provide traders with key price points to watch for potential trade entries or exits during the trading session.
The document provides intra-day technical levels for various commodities traded on the MCX exchange for September 10, 2012. It lists the commodity, contract expiry date, previous day's close price, intra-day trend, pivot point, and resistance and support levels. The levels are used to analyze the commodity's price movement and determine potential support and resistance zones for the day's trading.
The document provides a technical analysis of various commodity futures contracts traded on the MCX exchange in India. It lists the commodity, contract expiration date, previous day's close price, intraday trend, pivot point, and resistance and support price levels. The analysis is intended to help traders identify potential price movement and trading opportunities for over 20 commodities on October 22, 2012.
The document provides a technical analysis of various commodity futures contracts traded on the MCX exchange in India. It lists the commodity, contract expiration, previous day's close price, intraday trend, pivot points, and resistance and support levels. Pivot points and technical price levels are given to analyze price direction and potential trading opportunities for each commodity contract.
The document provides a technical analysis of various commodity futures contracts traded on the MCX exchange in India. It lists the commodity, contract expiration date, previous day's close price, intraday trend, pivot point, and resistance and support price levels. Most commodities were seen to have a downward intraday trend on 26/10/12 according to the analysis. The table provides information to traders on price levels to watch for potential trade entries and exits over the course of the trading session.
The document provides intra-day technical levels for various commodities for October 15, 2012. It lists the commodity, contract expiry date, previous day's close price, intra-day trend, pivot point, and resistance and support levels. Technical analysis is used to determine pivot points and predict likely price movement and price range over the course of the trading day.
The document provides intra-day technical levels for various commodities traded on the MCX, including the pivot point and resistance and support levels for each commodity on different contract expiry dates. Details include the commodity name, contract expiry, previous day's close price, intra-day trend, and key technical levels that traders can use to identify potential resistance and support levels for each commodity on intra-day trading.
The document provides intra-day technical levels for various commodities futures contracts traded on the MCX exchange in India. It lists the commodity, contract details, previous day's close, intra-day trend, pivot points, resistance and support levels. Pivot points, resistance and support levels are given to analyze price behavior and identify potential trading opportunities for the day.
The document provides daily technical analysis for various commodities traded on the MCX exchange in India. It lists the commodity, contract expiration date, previous day's close price, identified intraday trend, pivot point, and resistance and support price levels. The technical analysis is intended to help traders identify potential price movement and trading opportunities for the day.
Similar to Keynote technicals commodity intraday levels for 220812 (16)
The domestic stock markets opened lower but bounced back to close flat, supported by the 200-day simple moving average. The Nifty closed slightly higher but technical indicators remain negative, suggesting further bouts of selling pressure. Key support levels are at 5624, 5571 and 5447, while resistance levels are at 5747, 5816 and 5885. Stocks such as Adani Ports, HDFC, and HUL are recommended for watching.
The document provides intra-day technical levels for currency futures contracts for various dates. It includes the previous day's close price, intra-day trend, pivot point, and resistance and support levels. The pivot point is used as a trigger for intra-day buy/sell decisions. Resistance levels above and support levels below the pivot point are also provided. The document advises using the pivot point as a stop loss level and taking successive profit targets at the resistance and support levels.
The document provides daily derivatives outlook and recommends several bullish and bearish positional option trades on indices and stocks. It recommends short strangle trades on Nifty, Bank Nifty and USD/INR based on highest call and put open interest levels. It also recommends bullish call option trades on specific stocks like Hindustan Unilever, Ranbaxy, ITC, HDFC and Titan. Bearish put option trades are recommended on stocks like Reliance, Tata Steel, Reliance Power, DLF, Hero Motors.
The key Indian stock indices closed slightly higher, recovering from a seven-day losing streak. The Sensex closed up 0.12% and the Nifty closed up 0.14%. Midcap and small cap shares continued declining with lack of buying support. Shares of Jet Airways and SpiceJet fell on concerns of increased competition from a new AirAsia India joint venture. GAIL shares fell on reports of delays to a gas pipeline project in Tamil Nadu. Overall, six sectors closed lower while seven closed higher. FIIs were net buyers of Indian stocks while domestic institutions were net sellers.
The document provides the intra-day technical levels for various stocks trading on the NSE for March 28, 2013, the day of monthly futures and options expiry. It lists the closing price of each stock from March 26, the intra-day pivot point, and resistance and support levels (R1-R3 and S1-S3). The levels are expected to act as upside and downside barriers for price movement during the trading session.
The document provides intra-day technical levels for various commodities futures contracts traded on the MCX commodity exchange in India. It lists the commodity, contract expiry date, previous day's close price, intra-day trend, pivot point, and resistance and support levels for each commodity contract. The levels are used to analyze the commodity's intra-day price movement and determine potential resistance and support areas.
The daily commodity report summarizes the movement of gold, silver, and crude prices on the MCX exchange on March 6th, 2013. Gold prices opened lower but rose intraday before closing with modest losses. Silver opened higher and peaked intraday but also closed with losses. Crude opened and closed higher with moderate gains. Technical indicators for all three commodities showed sellers were in control but covering shorts, suggesting prices may rise. Upcoming economic reports and data were also summarized.
The domestic markets witnessed negative openings and sustained selling pressure, trading with moderate losses on weak global cues. However, the markets managed to recover from the lows and end the day with modest losses near the highs, supported by short covering and selective buying. Technically, most indicators remain below their averages, signaling impending selling pressure. The markets will take cues from global factors as well as the rupee and crude oil prices.
The document provides technical analysis levels for various currency futures contracts traded on the NSE for intraday trading on March 5, 2013. It lists the pivot point, resistance and support levels for currency pairs such as EUR/INR, GBP/INR, JPY/INR and USD/INR. The pivot point is considered a trigger for intraday buy/sell decisions. Resistance levels R1, R2, R3 are above the pivot point and support levels S1, S2, S3 are below the pivot point. The analysis is meant to guide intraday traders on entry, exit and stop loss levels based on the currency pair's price action relative to the pivot point.
The document provides the intra-day technical levels for various stocks trading on the National Stock Exchange of India (NSE) on March 5, 2013. It lists the stocks, their closing prices from the previous day, identified trends (up or down), pivot points, and resistance and support levels for intra-day trading. The levels are intended to help traders identify potential highs and lows for the stocks during the trading day.
The domestic stock markets witnessed flat opening but selling pressure drove markets lower. However, markets bounced back from lower levels due to short covering and selective buying. The markets closed near the day's highs with modest gains. Technically, positive market breadth amid higher volumes supported the markets. The indices remain above key support levels. However, negative technical indicators could lead to selling pressure at higher levels. The markets will take cues from the upcoming Union Budget.
The document provides the intra-day technical levels for currency futures contracts on various dates. It includes the pivot point, which is a trigger for intra-day buy/sell decisions, and resistance and support levels (R1, R2, R3 and S1, S2, S3). The trader is advised to take a long position above the pivot point and use the pivot as the stop loss, with targets at the resistance levels; and take a short position below the pivot point, using it as the stop loss and targeting the support levels. The intra-day trend is valid until the price trades above or below the pivot point.
The document provides intra-day technical levels for various MCX commodities contracts for February 28, 2013. It lists the commodity, contract expiry date, previous day's close price, intra-day trend, pivot point, resistance and support levels. Technical analysis is used to identify levels of resistance and support for each commodity contract to determine likely price movement and trading opportunities on the given day.
This document provides a daily derivatives outlook and recommends various positional option trades. It summarizes the highest call and put open interest levels for various indices like Nifty and Bank Nifty. It recommends short-term strategies like short strangles and long-term strategies like short straddles. It also provides bullish and bearish positional stock option trades and discusses the US dollar-Indian rupee outlook.
The daily commodity report summarizes prices and trading activity for gold, silver, and crude oil futures on the MCX exchange in India. On February 27th, gold and silver prices closed lower by 1.16% and 1.46% respectively, while crude oil closed lower by 0.42%. Trading volumes declined significantly across all three commodities compared to the previous day. Technical indicators show buying support for gold and silver but strengthening sellers for crude oil. Key support and resistance price levels are provided.
The document provides the intra-day technical levels for various stocks trading on the National Stock Exchange of India (NSE) for February 28, 2013, the expiry date for futures and options contracts. It lists the stock name, previous day's close price, identified trend (up/down), pivot point, and potential resistance and support levels (R1, R2, R3, S1, S2, S3) for each stock based on technical analysis of recent price movements. This is intended to help traders identify potential price points where the market may reverse direction on an intra-day basis.
The domestic markets opened flat but saw selling pressure and losses, especially in mid-cap stocks due to margin funding issues. The markets recovered slightly in the afternoon on short-covering and selective buying but failed to sustain higher levels. Technically, market breadth was weak with higher volumes signaling more downside risk. Most technical indicators were below their averages, signaling impending selling pressure. However, some indicators were in oversold territory, which could lead to short-term bouts of buying at lower levels. The markets will take cues from the upcoming union budget, global markets, the rupee and crude oil prices.
- The document provides intra-day technical levels for currency futures contracts, including pivot points, resistance and support levels.
- The pivot point is a trigger point for intra-day buying and selling based on the previous day's price range, and is used to determine resistance and support levels.
- Traders are advised to take buy positions above the pivot point and sell positions below it, using the pivot point as a stop loss and targeting resistance or support levels.
The document provides intra-day technical levels for various commodities trading on the MCX exchange for February 26, 2013. It lists the commodity, contract expiry date, previous day's close price, intra-day trend, pivot point, resistance and support levels for each commodity. Technical analysis is used to determine the short-term outlook and key price levels.
This document provides a daily outlook on currency, indices, and stock positional option trades for February 26, 2013. It summarizes the highest call and put open interest levels for the Nifty and Bank Nifty indices and recommends short strangle strategies. It also recommends short strangle trades for the USD/INR currency pair in March. On the stock side, it recommends bullish positional calls on specific stocks and bearish positional puts on other stocks. The document provides a ready reckoner on various option strategies and techniques for managing risk.
Zodiac Signs and Food Preferences_ What Your Sign Says About Your Tastemy Pandit
Know what your zodiac sign says about your taste in food! Explore how the 12 zodiac signs influence your culinary preferences with insights from MyPandit. Dive into astrology and flavors!
Cover Story - China's Investment Leader - Dr. Alyce SUmsthrill
In World Expo 2010 Shanghai – the most visited Expo in the World History
https://www.britannica.com/event/Expo-Shanghai-2010
China’s official organizer of the Expo, CCPIT (China Council for the Promotion of International Trade https://en.ccpit.org/) has chosen Dr. Alyce Su as the Cover Person with Cover Story, in the Expo’s official magazine distributed throughout the Expo, showcasing China’s New Generation of Leaders to the World.
❼❷⓿❺❻❷❽❷❼❽ Dpboss Matka Result Satta Matka Guessing Satta Fix jodi Kalyan Final ank Satta Matka Dpbos Final ank Satta Matta Matka 143 Kalyan Matka Guessing Final Matka Final ank Today Matka 420 Satta Batta Satta 143 Kalyan Chart Main Bazar Chart vip Matka Guessing Dpboss 143 Guessing Kalyan night
[To download this presentation, visit:
https://www.oeconsulting.com.sg/training-presentations]
This presentation is a curated compilation of PowerPoint diagrams and templates designed to illustrate 20 different digital transformation frameworks and models. These frameworks are based on recent industry trends and best practices, ensuring that the content remains relevant and up-to-date.
Key highlights include Microsoft's Digital Transformation Framework, which focuses on driving innovation and efficiency, and McKinsey's Ten Guiding Principles, which provide strategic insights for successful digital transformation. Additionally, Forrester's framework emphasizes enhancing customer experiences and modernizing IT infrastructure, while IDC's MaturityScape helps assess and develop organizational digital maturity. MIT's framework explores cutting-edge strategies for achieving digital success.
These materials are perfect for enhancing your business or classroom presentations, offering visual aids to supplement your insights. Please note that while comprehensive, these slides are intended as supplementary resources and may not be complete for standalone instructional purposes.
Frameworks/Models included:
Microsoft’s Digital Transformation Framework
McKinsey’s Ten Guiding Principles of Digital Transformation
Forrester’s Digital Transformation Framework
IDC’s Digital Transformation MaturityScape
MIT’s Digital Transformation Framework
Gartner’s Digital Transformation Framework
Accenture’s Digital Strategy & Enterprise Frameworks
Deloitte’s Digital Industrial Transformation Framework
Capgemini’s Digital Transformation Framework
PwC’s Digital Transformation Framework
Cisco’s Digital Transformation Framework
Cognizant’s Digital Transformation Framework
DXC Technology’s Digital Transformation Framework
The BCG Strategy Palette
McKinsey’s Digital Transformation Framework
Digital Transformation Compass
Four Levels of Digital Maturity
Design Thinking Framework
Business Model Canvas
Customer Journey Map
During the budget session of 2024-25, the finance minister, Nirmala Sitharaman, introduced the “solar Rooftop scheme,” also known as “PM Surya Ghar Muft Bijli Yojana.” It is a subsidy offered to those who wish to put up solar panels in their homes using domestic power systems. Additionally, adopting photovoltaic technology at home allows you to lower your monthly electricity expenses. Today in this blog we will talk all about what is the PM Surya Ghar Muft Bijli Yojana. How does it work? Who is eligible for this yojana and all the other things related to this scheme?
𝐔𝐧𝐯𝐞𝐢𝐥 𝐭𝐡𝐞 𝐅𝐮𝐭𝐮𝐫𝐞 𝐨𝐟 𝐄𝐧𝐞𝐫𝐠𝐲 𝐄𝐟𝐟𝐢𝐜𝐢𝐞𝐧𝐜𝐲 𝐰𝐢𝐭𝐡 𝐍𝐄𝐖𝐍𝐓𝐈𝐃𝐄’𝐬 𝐋𝐚𝐭𝐞𝐬𝐭 𝐎𝐟𝐟𝐞𝐫𝐢𝐧𝐠𝐬
Explore the details in our newly released product manual, which showcases NEWNTIDE's advanced heat pump technologies. Delve into our energy-efficient and eco-friendly solutions tailored for diverse global markets.
SATTA MATKA DPBOSS KALYAN MATKA RESULTS KALYAN CHART KALYAN MATKA MATKA RESULT KALYAN MATKA TIPS SATTA MATKA MATKA COM MATKA PANA JODI TODAY BATTA SATKA MATKA PATTI JODI NUMBER MATKA RESULTS MATKA CHART MATKA JODI SATTA COM INDIA SATTA MATKA MATKA TIPS MATKA WAPKA ALL MATKA RESULT LIVE ONLINE MATKA RESULT KALYAN MATKA RESULT DPBOSS MATKA 143 MAIN MATKA KALYAN MATKA RESULTS KALYAN CHART
The APCO Geopolitical Radar - Q3 2024 The Global Operating Environment for Bu...APCO
The Radar reflects input from APCO’s teams located around the world. It distils a host of interconnected events and trends into insights to inform operational and strategic decisions. Issues covered in this edition include:
Industrial Tech SW: Category Renewal and CreationChristian Dahlen
Every industrial revolution has created a new set of categories and a new set of players.
Multiple new technologies have emerged, but Samsara and C3.ai are only two companies which have gone public so far.
Manufacturing startups constitute the largest pipeline share of unicorns and IPO candidates in the SF Bay Area, and software startups dominate in Germany.
Starting a business is like embarking on an unpredictable adventure. It’s a journey filled with highs and lows, victories and defeats. But what if I told you that those setbacks and failures could be the very stepping stones that lead you to fortune? Let’s explore how resilience, adaptability, and strategic thinking can transform adversity into opportunity.
Unveiling the Dynamic Personalities, Key Dates, and Horoscope Insights: Gemin...my Pandit
Explore the fascinating world of the Gemini Zodiac Sign. Discover the unique personality traits, key dates, and horoscope insights of Gemini individuals. Learn how their sociable, communicative nature and boundless curiosity make them the dynamic explorers of the zodiac. Dive into the duality of the Gemini sign and understand their intellectual and adventurous spirit.
Prescriptive analytics BA4206 Anna University PPTFreelance
Business analysis - Prescriptive analytics Introduction to Prescriptive analytics
Prescriptive Modeling
Non Linear Optimization
Demonstrating Business Performance Improvement
4. Commodities Intra-day Technical Levels For 22/08/12
MCX Commodity Contract Close Pivot Resistance Support
Symbol Expiry 21/08/12 Point R1 R2 R3 S1 S2 S3
ZINCMINI 31-Oct-12 102 102 102 103 104 102 101 101
ZINCMINI 28-Sep-12 101 101 102 102 103 101 100 99
ZINCMINI 31-Aug-12 100 100 100 101 102 99 99 98
Sanjay Bhatia (AVP – Technical Research), Email Id sanjay@keynotecapitals.net
Pivot Point: This is an Intra- Day Trading Tool. The key to the use of this tool is the use of Stop Loss.
Pivot Point (PP): This is a trigger point for Intra Day Buy / Sell based on the price range of the previous day.
R1: Resistance 1: 1st Resistance level over Pivot Point, R2: Resistance 2: Next Resistance level after R1.
R3: Resistance 3: Next Resistance level after R2.
S1: Support 1: 1st Support level after Pivot Point, S2: Support 2: Next Support level after S1.
S3: Support 3: Next Support level after S2.
Note: As per this tool, the trader should take BUY position just above the Pivot Point and keep the Pivot Point level as stop loss
and the first target would be R1 level (Resistance 1). If R1 is crossed then R2 (Resistance 2) becomes the next target with the
stop loss placed at R1 level. If R2 is crossed then R3 (Resistance 3) becomes the next target with the stop loss placed at R2 level.
Similarly if price goes below the Pivot Point the trader should take a SELL position and keep the Pivot Point level as the stop loss
and the first target would be S1 level (Support 1). If S1 level is breached then S2 level (Support 2) becomes the next target with
the stop loss placed at S1 level. If S2 level is breached then S3 level (Support 3) becomes the next target with the stop loss placed
at S2 level.
Disclaimer: This document is not for public distribution and has been furnished to you solely for your information and must not be reproduced or
redistributed to any other person. Persons into whose possession this document may come are required to observe these restrictions. This material
is for the personal information of the authorized recipient, and we are not soliciting any action based upon it. This report is not to be construed as
an offer to sell or the solicitation of an offer to buy any security in any jurisdiction where such an offer or solicitation would be illegal. It is for the
general information of clients of Keynote Capitals Ltd. It does not constitute a personal recommendation or take into account the particular
investment objectives, financial situations, or needs of individual clients. We have reviewed the report, and in so far as it includes current or
historical information, it is believed to be reliable though its accuracy or completeness cannot be guaranteed. Neither Keynote Capitals Ltd., nor any
person connected with it, accepts any liability arising from the use of this document. The recipients of this material should rely on their own
investigations and take their own professional advice. Price and value of the investments referred to in this material may go up or down. Past
performance is not a guide for future performance. Certain transactions -including those involving futures, options and other derivatives as well as
non-investment grade securities - involve substantial risk and are not suitable for all investors. Reports based on technical analysis centers on
studying charts of a stock’s price movement and trading volume, as opposed to focusing on a company’s fundamentals and as such, may not
match with a report on a company’s fundamentals. Opinions expressed are our current opinions as of the date appearing on this material only.
While we endeavor to update on a reasonable basis the information discussed in this material, there may be regulatory, compliance, or other
reasons that prevent us from doing so. Prospective investors and others are cautioned that any forward-looking statements are not predictions and
may be subject to change without notice. Our proprietary trading and investment businesses may make investment decisions that are inconsistent
with the recommendations expressed herein. We and our affiliates, officers, directors, and employees world wide may: (a) from time to time, have
long or short positions in, and buy or sell the securities thereof, of company (ies) mentioned herein or (b) be engaged in any other transaction
involving such securities and earn brokerage or other compensation or act as a market maker in the financial instruments of the company (ies)
discussed herein or act as advisor or lender / borrower to such company (ies) or have other potential conflict of interest with respect to any
recommendation and related information and opinions. The analyst for this report certifies that all of the views expressed in this report accurately
reflect his or her personal views about the subject company or companies and its or their securities, and no part of his or her compensation was, is
or will be, directly or indirectly related to specific recommendations or views expressed in this report. No part of this material may be duplicated in
any form and/or redistributed without Keynote Capitals Ltd’s., prior written consent.
Keynote Capitals Ltd.
The Ruby,
9th Floor,
Senapati Bapat Marg,
Dadar (W), Mumbai, India – 400028
Tel: 30266000 / 22694322
www.keynotecapitals.com