Download to read offline

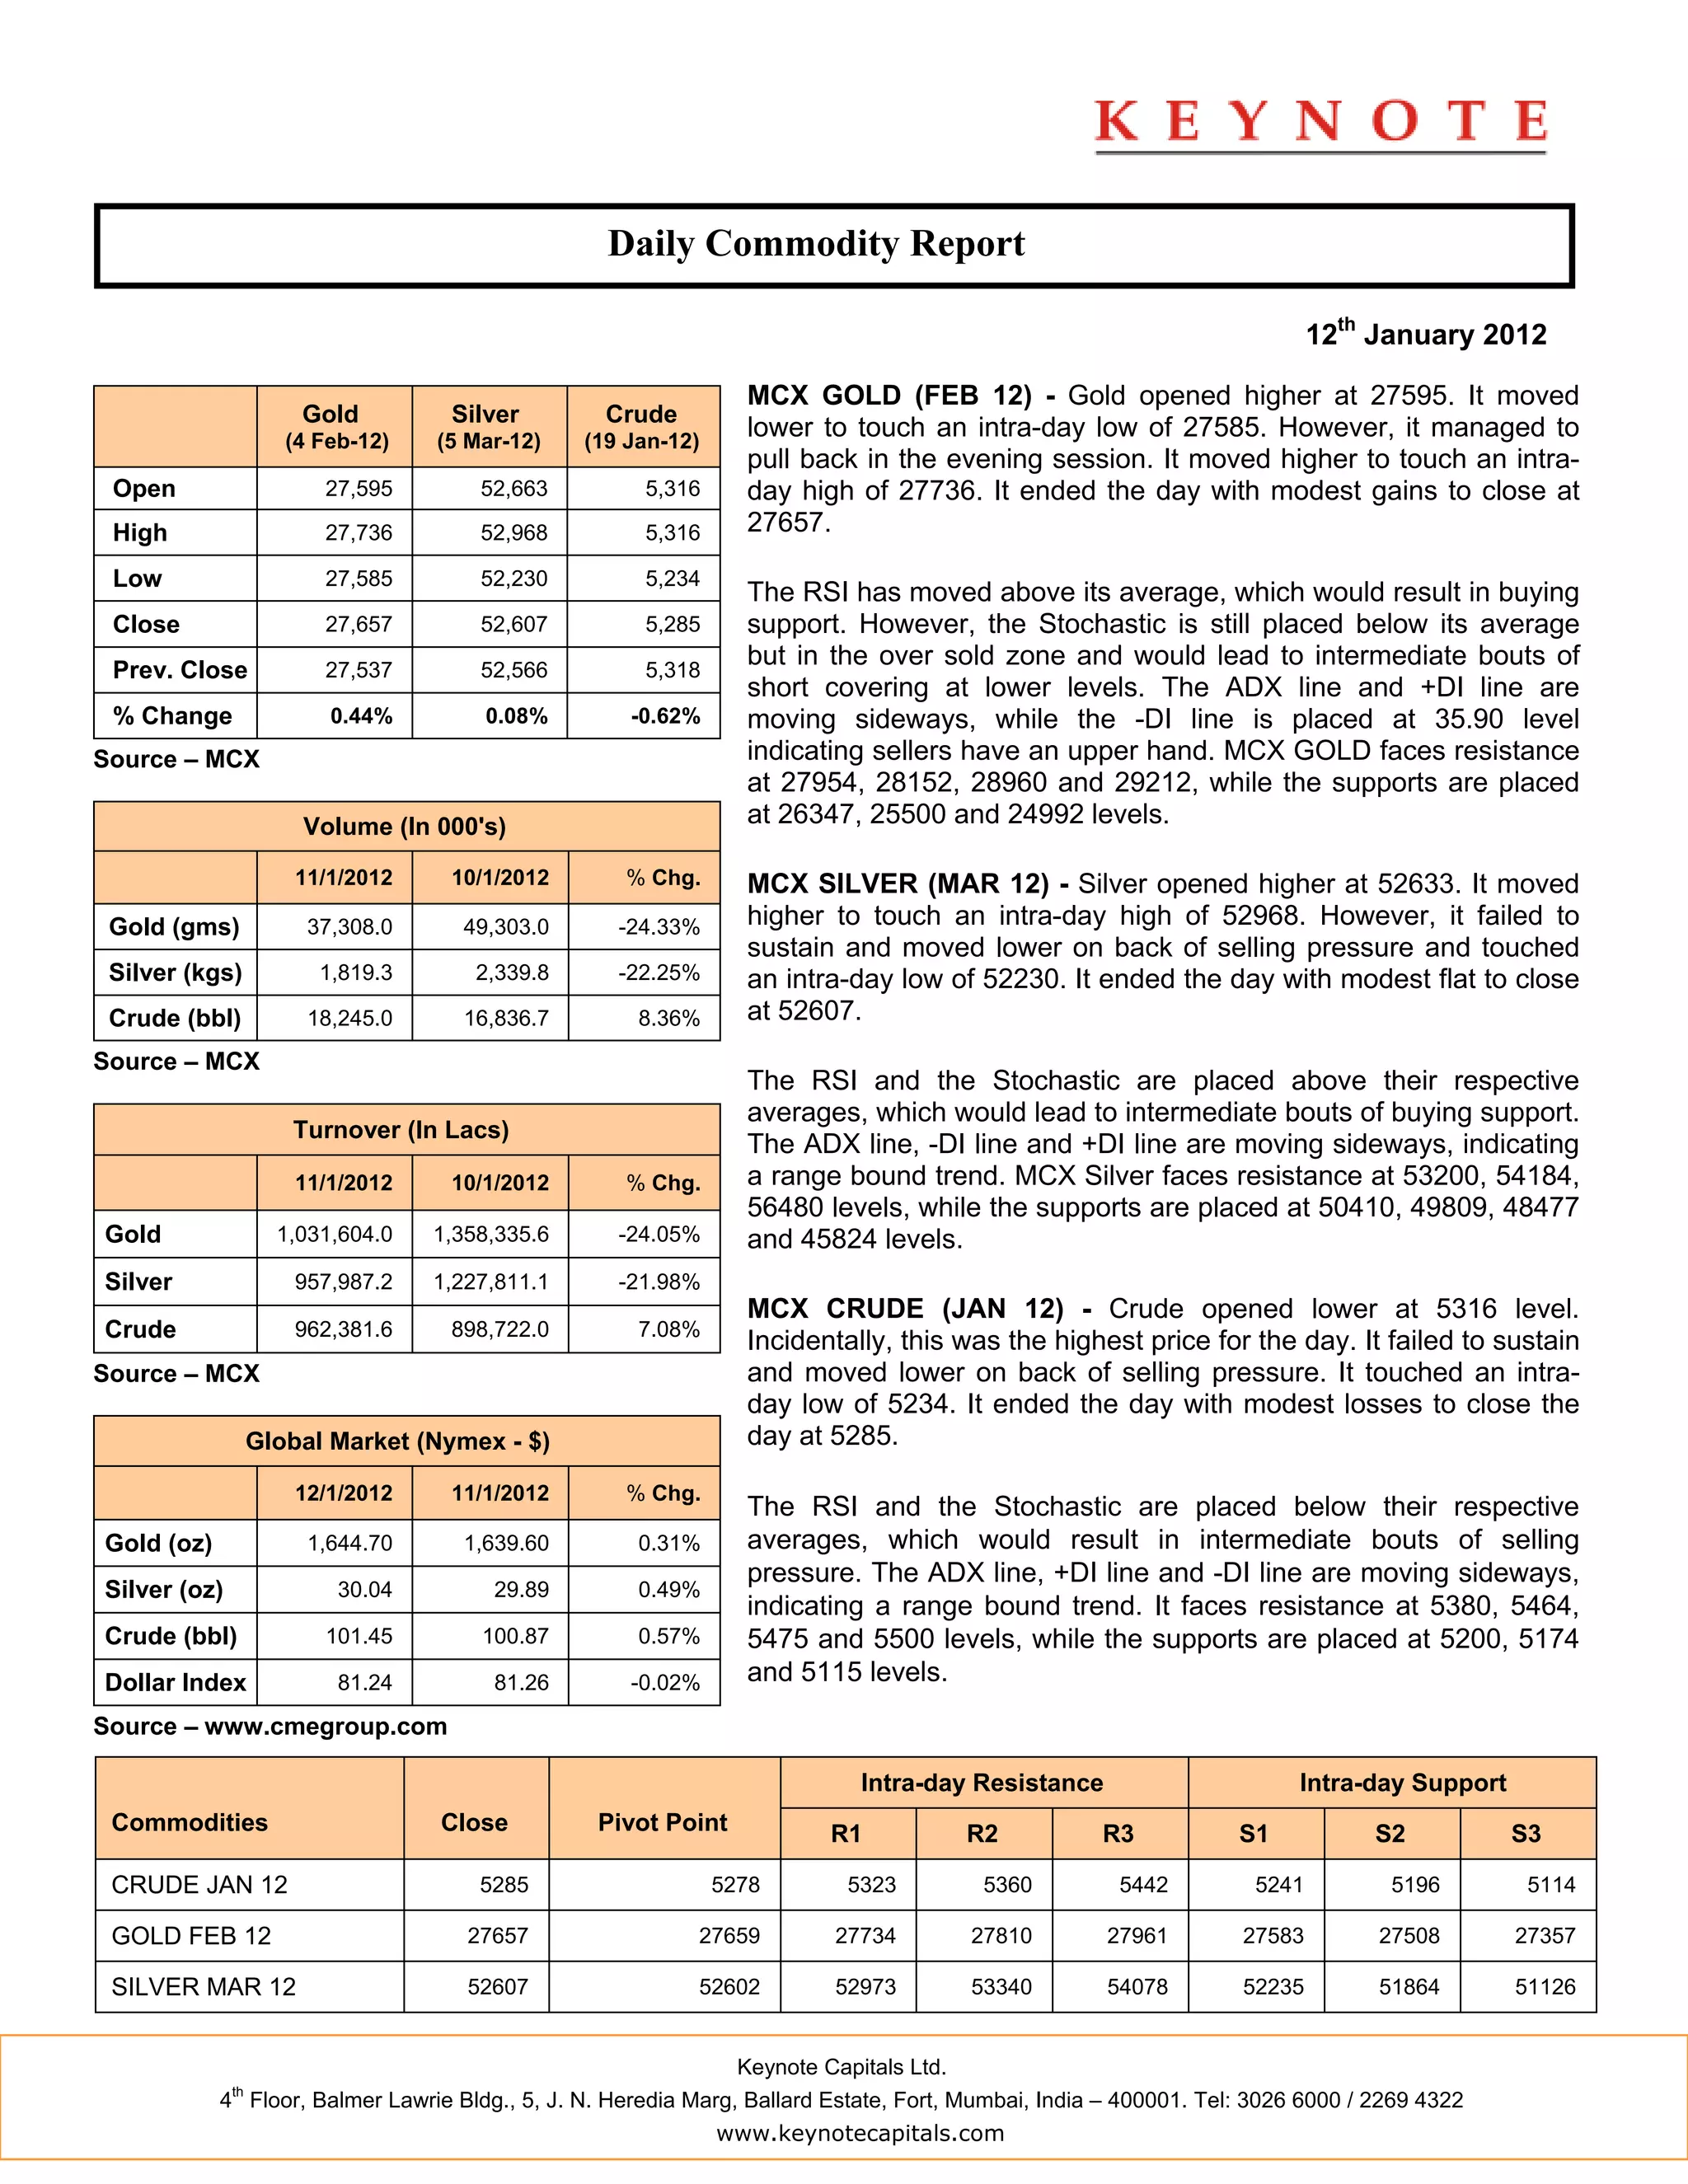
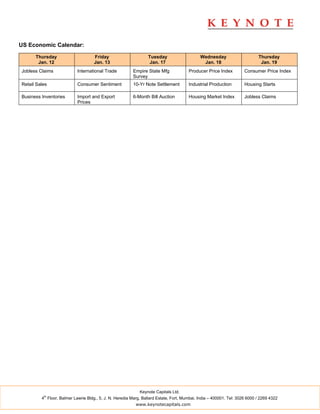

The document provides a daily commodity report for gold, silver, and crude on the MCX for January 12, 2012. It summarizes the opening, high, low, and closing prices for each commodity. It also analyzes technical indicators like RSI, Stochastic, ADX, and identifies key resistance and support levels. Volume and turnover data for gold, silver, and crude are also provided for the current date and compared to the previous date. Upcoming economic reports from the US are listed. Resistance and support levels are provided for intraday trading of crude, gold and silver futures.


