Download to read offline
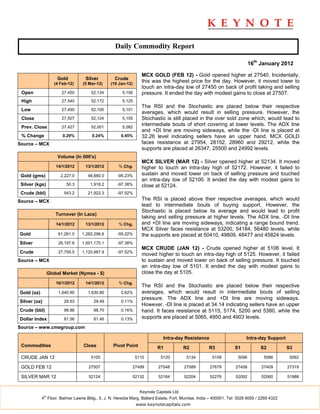

- The daily commodity report summarizes prices and trading activity for gold, silver, and crude on the MCX exchange on January 16th, 2012. - Gold prices opened higher but fell to an intra-day low before closing with modest gains. Silver and crude also opened higher but saw selling pressure and fell to intra-day lows before closing slightly higher. - Technical indicators like the RSI, Stochastic, ADX, and DI lines suggest sellers have an advantage in gold and crude, while buyers have short-term support in silver.


