
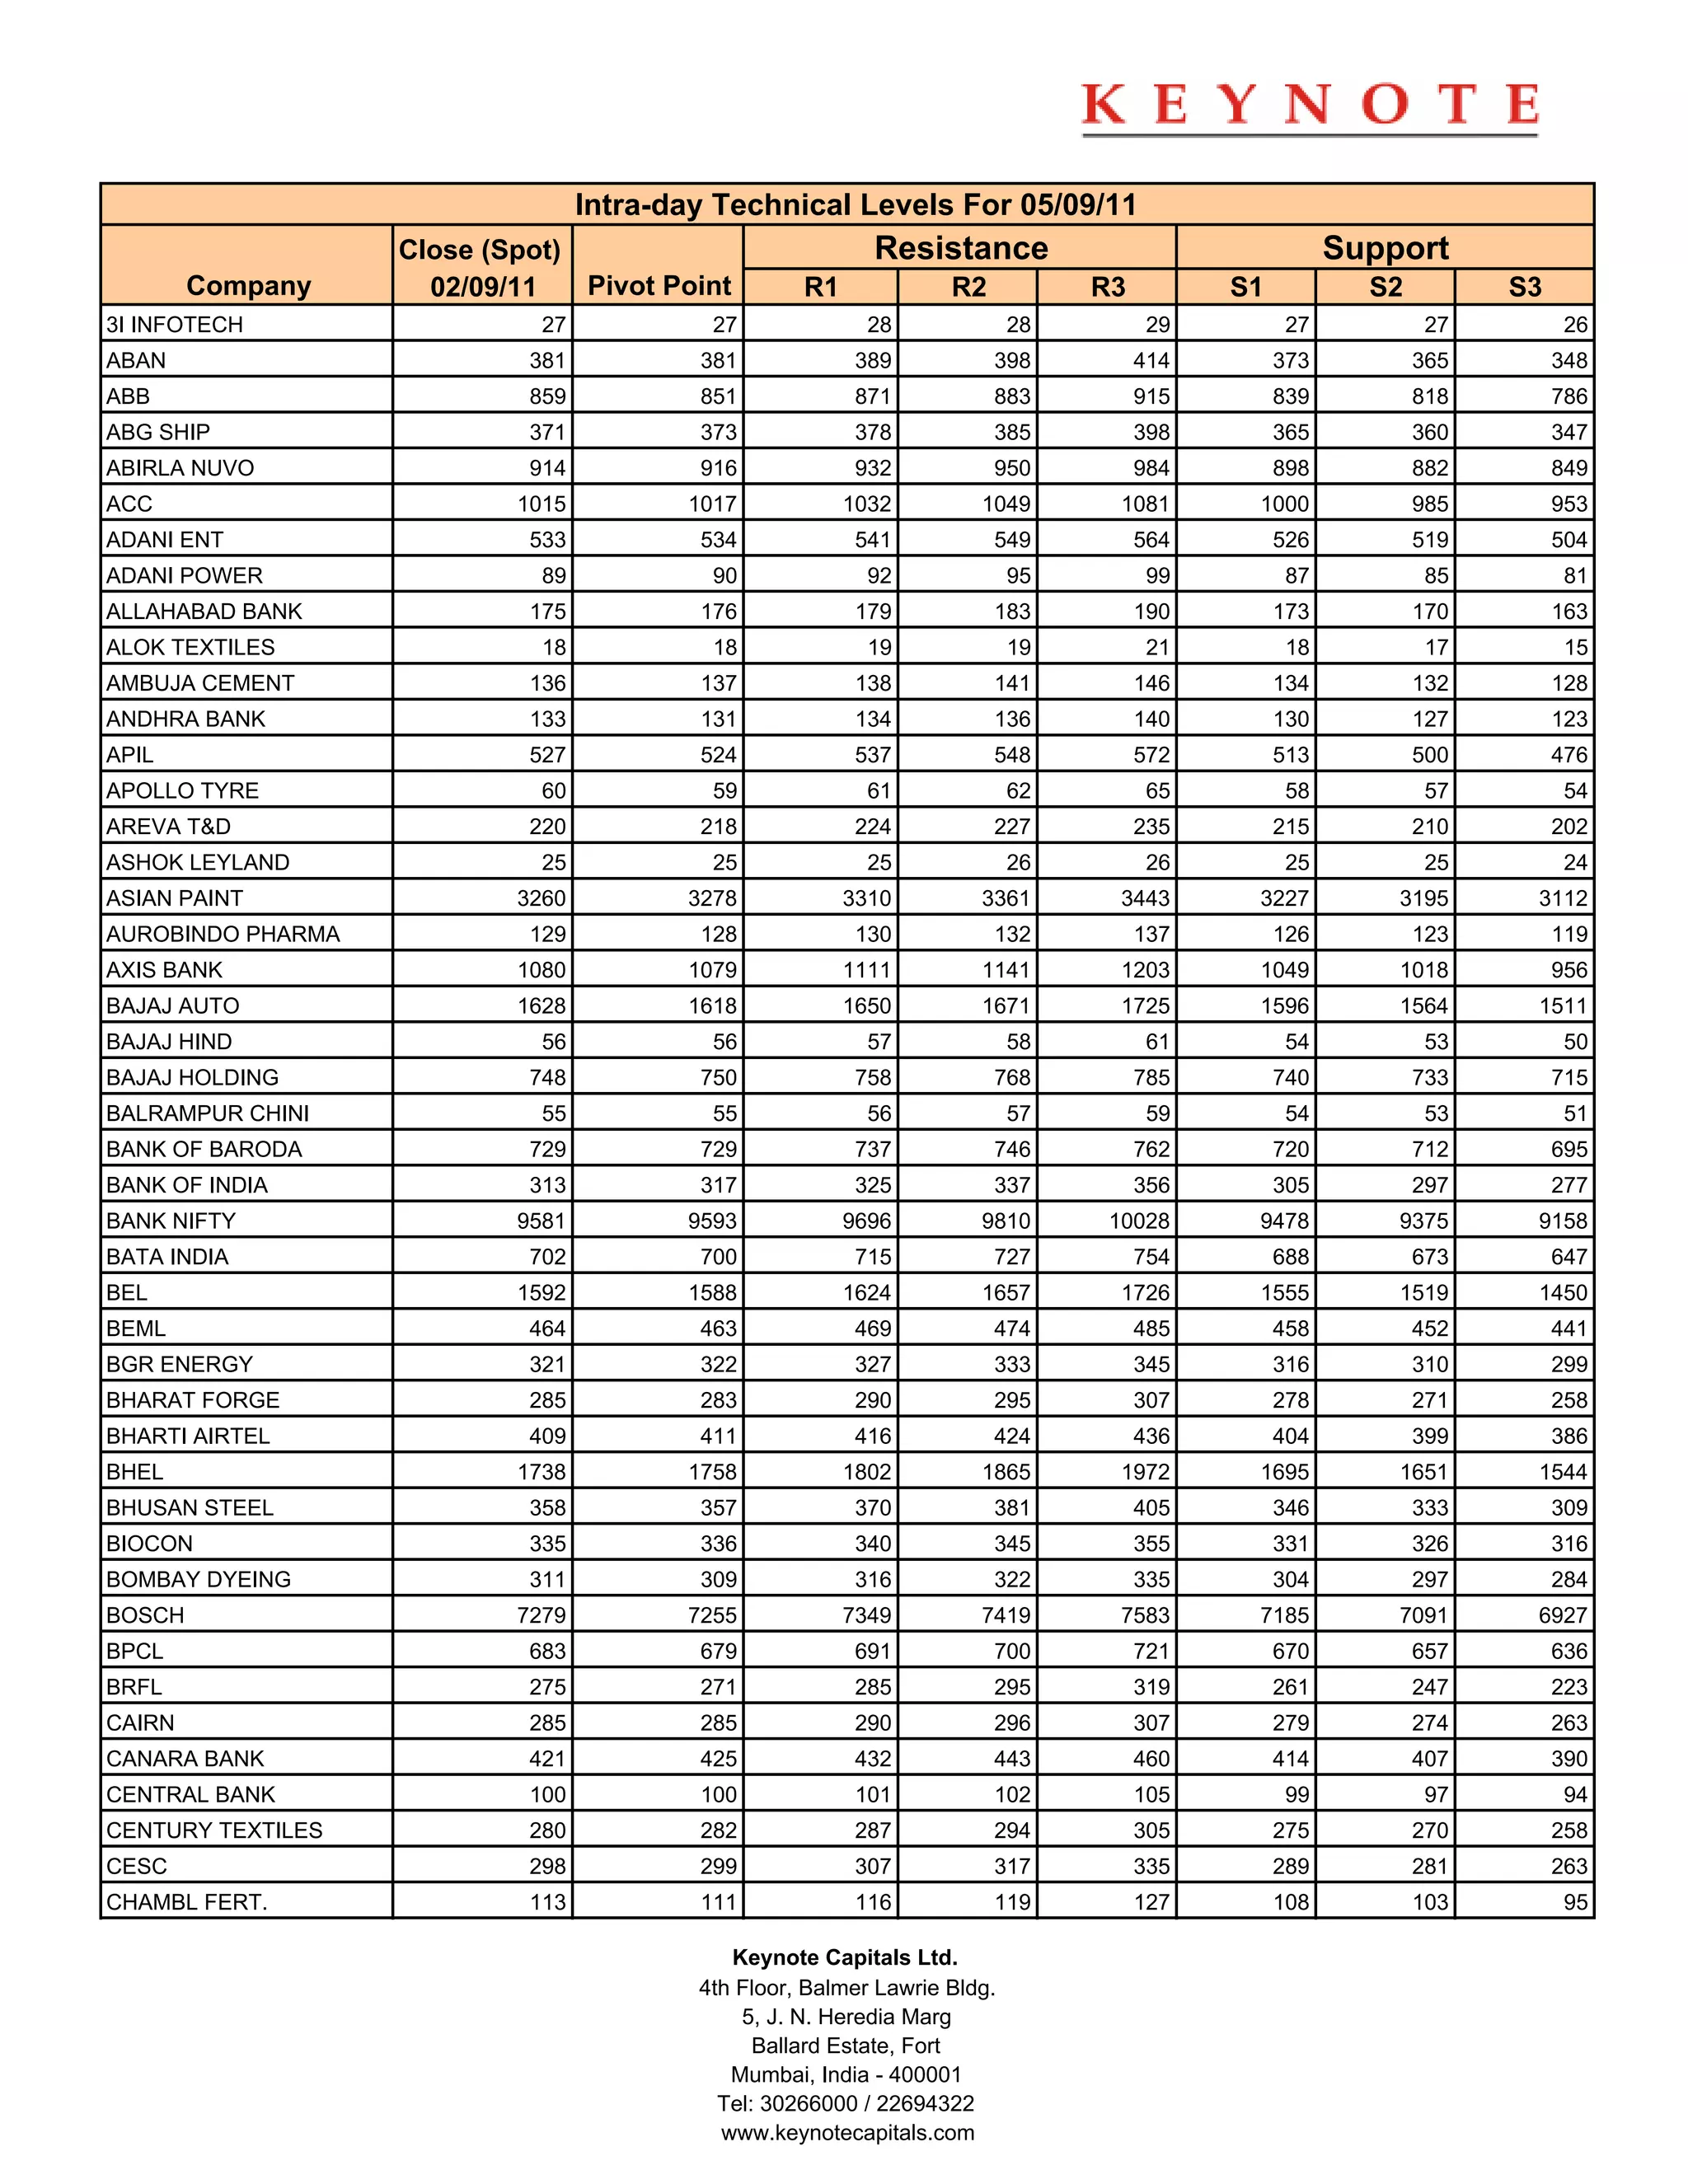
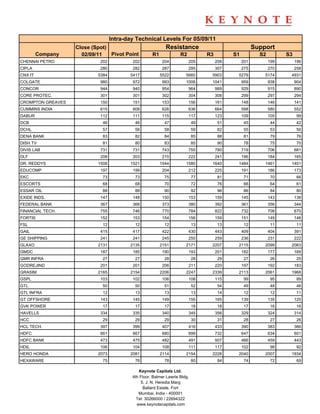
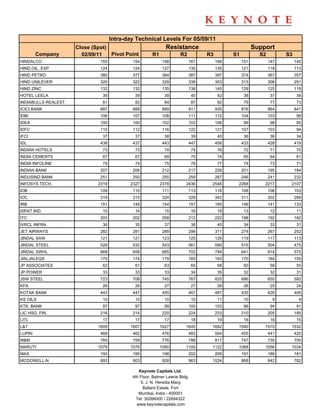
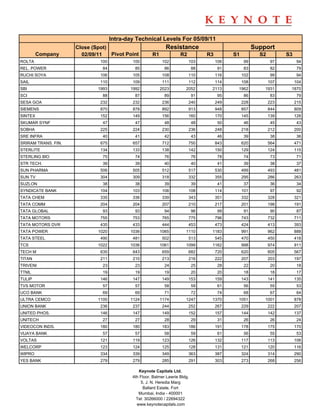
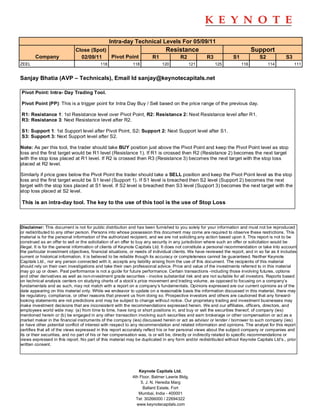

The document provides daily technical analysis levels for various Indian companies for May 9, 2011. It lists the previous day's closing price, pivot point, and resistance and support levels for each stock. The resistance levels are R1, R2, and R3, with R1 being the nearest, while the support levels are S1, S2, and S3, with S1 being the nearest. This technical analysis is intended to help traders identify potential price points where buying or selling pressure may increase for these stocks.


