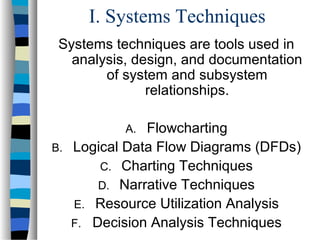
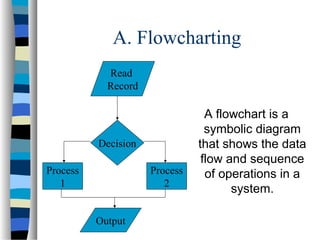
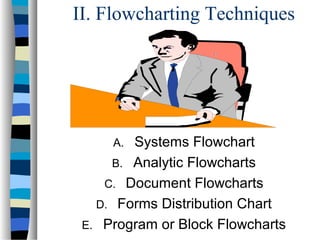
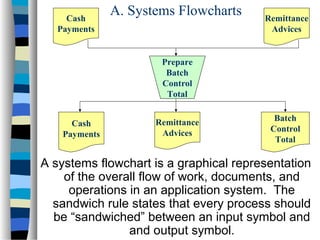
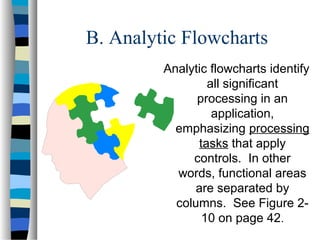
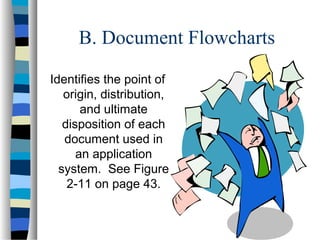
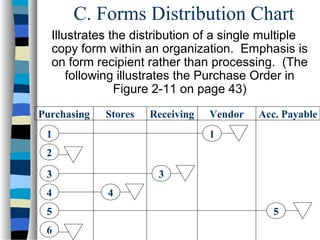
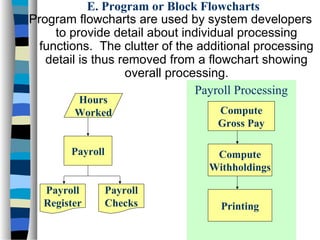
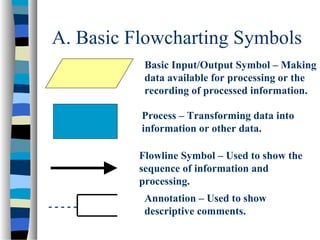
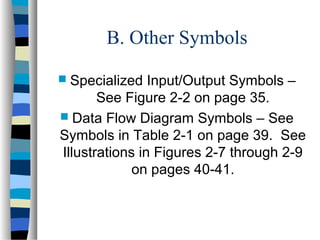
Chapter 2
Systems Techniques and
Documentation
Presentation Outline
How does
this
system
work?

Systems Techniques
II.
Flowcharting Techniques
III. System Technique Symbols
IV. The Use of Systems Techniques
I.
I. Systems Techniques
Systems techniques are tools used in
analysis, design, and documentation
of system and subsystem
relationships.
Flowcharting
B. Logical Data Flow Diagrams (DFDs)
C. Charting Techniques
D. Narrative Techniques
E. Resource Utilization Analysis
F. Decision Analysis Techniques
A.
A. Flowcharting
Read
Record

Decision
Process
1

Process
2
Output

A flowchart is a
symbolic diagram
that shows the data
flow and sequence
of operations in a
system.
B. Logical Data Flow Diagrams (DFDs)
A systems analyst often acts as the communication link
between users of a system and the programmers/systems
support staff who will physically design the system to
meet the user needs.

The intent of using DFDs is to separate clearly the
logical process of systems analysis from the
physical process of systems design. The
systems analyst provides a logical description to
the systems designer/programmer, who then
designs the physical specification..
C. Charting Techniques
Hierarchy chart
breaking down
processing tasks into
modules. See Figure
2-6 on page 38.
 IPO (Input-ProcessOutput) chart
describing the inputprocess-output
requirements of each
module. See Figure
2-5 on page 38.


HIPO charts
consist of two
segments.
D. Narrative Techniques
Narrative techniques are
often particularly
useful in the fact
finding stage of
systems analysis.
Various techniques
include:
1. In depth and
structured interviews
2. Open-ended and
closed-ended
questionnaires
3. Document reviews
E. Resource Utilization Analysis
Work measurement
involves techniques
used to identify tasks,
obtain and adjust time
estimates for the tasks,
and analyze
requirements in terms of
total task time and
capacity utilization
 Work distribution
analysis involves
assignment of tasks to
employees. See Table 22 on page 50.

F. Decision Analysis Techniques
A decision symbol in a
flowchart can only
show two flow
condition. More
complex decision
functions may be
represented using
one of the following:
1. Branching tables
2. Decision tables
1. Branching Tables
A branching table consists of a single condition
that can result in more than two paths of
processing.
Code
Equal to Freshman Sophomore Junior Senior
Go to

A

Orientation

B
Exit
Evaluation

The “Go to” section contains either a connector symbol
reference or a single flowline to another symbol.
2. Decision Tables
A decision table is similar to a branching table but
more complex in that it incorporates multiple
decision criteria.

Illustration
An analyst wishes to prepare a decision table for
purchase order procedures. First, there is a credit
check of the customer. If credit is approved, the
order is accepted. If the order calls for 0 to 25 units,
there is no discount on the order. If the order calls
for 26 to 55 units, it is eligible for a 5 percent
discount; if more than 55 units are ordered, the
discount is 10 percent.
An Example of a Limited-Entry Decision Table
Condition entries are limited to Y, N, or N/A (-).
Processing actions are either present or absent.
Credit
approved

N

Y

Y

Y

0 - 25 units

-

Y

-

-

26 - 55 units

-

-

Y

-

Over 55 units

-

-

-

Y

Reject order

X

Accept order

X

X

X

No discount

X

5% discount
10% discount

X
X
An Example of an Extended-Entry Decision Table
Entries indicate specific conditions, specific actions
to be taken, or reference to other decision tables.
Credit
approval

N

Units in order
Order
Acceptance
Discount
given

Y
-

N

Y

Y

0 – 25

26 – 55

Over 55

Y

Y

Y

0%

5%

10%
II. Flowcharting Techniques

Systems Flowchart
B. Analytic Flowcharts
C. Document Flowcharts
D. Forms Distribution Chart
E. Program or Block Flowcharts
A.
Cash
Payments

A. Systems Flowcharts

Remittance
Advices

Prepare
Batch
Control
Total
Cash
Payments

Remittance
Advices

Batch
Control
Total

A systems flowchart is a graphical representation
of the overall flow of work, documents, and
operations in an application system. The
sandwich rule states that every process should
be “sandwiched” between an input symbol and
and output symbol.
B. Analytic Flowcharts
Analytic flowcharts identify
all significant
processing in an
application,
emphasizing processing
tasks that apply
controls. In other
words, functional areas
are separated by
columns. See Figure 210 on page 42.
B. Document Flowcharts
Identifies the point of
origin, distribution,
and ultimate
disposition of each
document used in
an application
system. See Figure
2-11 on page 43.
C. Forms Distribution Chart
Illustrates the distribution of a single multiple
copy form within an organization. Emphasis is
on form recipient rather than processing. (The
following illustrates the Purchase Order in
Figure 2-11 on page 43)
Purchasing

Stores

Receiving

1

Vendor

Acc. Payable

1

2
3
4
5
6

3
4
5
E. Program or Block Flowcharts
Program flowcharts are used by system developers
to provide detail about individual processing
functions. The clutter of the additional processing
detail is thus removed from a flowchart showing
overall processing.
Payroll Processing
Hours
Worked

Payroll

Payroll
Register

Compute
Gross Pay
Compute
Withholdings

Payroll
Checks

Printing
III. System Technique Symbols
A.

Basic Flowcharting Symbols
B. Other Symbols
A. Basic Flowcharting Symbols
Basic Input/Output Symbol – Making
data available for processing or the
recording of processed information.
Process – Transforming data into
information or other data.
Flowline Symbol – Used to show the
sequence of information and
processing.
-----

Annotation – Used to show
descriptive comments.
B. Other Symbols
 Specialized

Input/Output Symbols –
See Figure 2-2 on page 35.
 Data Flow Diagram Symbols – See
Symbols in Table 2-1 on page 39. See
Illustrations in Figures 2-7 through 2-9
on pages 40-41.
IV. The Use of Systems
Techniques

Auditing
B. Systems Development
A.
A. Auditing

Two basic components of an external
audit of financial statements include:




Compliance testing is used to determine the
extent to which established control procedures
are actually being carried out.
Substantive testing to verify amounts shown on
financial statements. The level of substantive
testing will depend on the extent to which the
auditor depends on an entity’s system of internal
control.
B. Systems Development
Systems development generally consists of the
following three phases:





Systems Analysis – Logical data flow diagrams
and analytic flowcharts help in providing an
overall picture of the how the organization
functions.
Systems Design – A blueprint of how the
proposed system will function.
Systems Implementation – Taking steps to put
system into operation by doing things like
training personnel, and acquiring equipment and
software.
Summary
I.
II.
III.
IV.

Five Types of Systems Techniques
Five Types of Flowcharting
Techniques
Basic Flowcharting Symbols
Uses of Systems Techniques

Jzanzig chapter 2 lecture

  • 1.
  • 2.
    Presentation Outline How does this system work? SystemsTechniques II. Flowcharting Techniques III. System Technique Symbols IV. The Use of Systems Techniques I.
  • 3.
    I. Systems Techniques Systemstechniques are tools used in analysis, design, and documentation of system and subsystem relationships. Flowcharting B. Logical Data Flow Diagrams (DFDs) C. Charting Techniques D. Narrative Techniques E. Resource Utilization Analysis F. Decision Analysis Techniques A.
  • 4.
    A. Flowcharting Read Record Decision Process 1 Process 2 Output A flowchartis a symbolic diagram that shows the data flow and sequence of operations in a system.
  • 5.
    B. Logical DataFlow Diagrams (DFDs) A systems analyst often acts as the communication link between users of a system and the programmers/systems support staff who will physically design the system to meet the user needs. The intent of using DFDs is to separate clearly the logical process of systems analysis from the physical process of systems design. The systems analyst provides a logical description to the systems designer/programmer, who then designs the physical specification..
  • 6.
    C. Charting Techniques Hierarchychart breaking down processing tasks into modules. See Figure 2-6 on page 38.  IPO (Input-ProcessOutput) chart describing the inputprocess-output requirements of each module. See Figure 2-5 on page 38.  HIPO charts consist of two segments.
  • 7.
    D. Narrative Techniques Narrativetechniques are often particularly useful in the fact finding stage of systems analysis. Various techniques include: 1. In depth and structured interviews 2. Open-ended and closed-ended questionnaires 3. Document reviews
  • 8.
    E. Resource UtilizationAnalysis Work measurement involves techniques used to identify tasks, obtain and adjust time estimates for the tasks, and analyze requirements in terms of total task time and capacity utilization  Work distribution analysis involves assignment of tasks to employees. See Table 22 on page 50. 
  • 9.
    F. Decision AnalysisTechniques A decision symbol in a flowchart can only show two flow condition. More complex decision functions may be represented using one of the following: 1. Branching tables 2. Decision tables
  • 10.
    1. Branching Tables Abranching table consists of a single condition that can result in more than two paths of processing. Code Equal to Freshman Sophomore Junior Senior Go to A Orientation B Exit Evaluation The “Go to” section contains either a connector symbol reference or a single flowline to another symbol.
  • 11.
    2. Decision Tables Adecision table is similar to a branching table but more complex in that it incorporates multiple decision criteria. Illustration An analyst wishes to prepare a decision table for purchase order procedures. First, there is a credit check of the customer. If credit is approved, the order is accepted. If the order calls for 0 to 25 units, there is no discount on the order. If the order calls for 26 to 55 units, it is eligible for a 5 percent discount; if more than 55 units are ordered, the discount is 10 percent.
  • 12.
    An Example ofa Limited-Entry Decision Table Condition entries are limited to Y, N, or N/A (-). Processing actions are either present or absent. Credit approved N Y Y Y 0 - 25 units - Y - - 26 - 55 units - - Y - Over 55 units - - - Y Reject order X Accept order X X X No discount X 5% discount 10% discount X X
  • 13.
    An Example ofan Extended-Entry Decision Table Entries indicate specific conditions, specific actions to be taken, or reference to other decision tables. Credit approval N Units in order Order Acceptance Discount given Y - N Y Y 0 – 25 26 – 55 Over 55 Y Y Y 0% 5% 10%
  • 14.
    II. Flowcharting Techniques SystemsFlowchart B. Analytic Flowcharts C. Document Flowcharts D. Forms Distribution Chart E. Program or Block Flowcharts A.
  • 15.
    Cash Payments A. Systems Flowcharts Remittance Advices Prepare Batch Control Total Cash Payments Remittance Advices Batch Control Total Asystems flowchart is a graphical representation of the overall flow of work, documents, and operations in an application system. The sandwich rule states that every process should be “sandwiched” between an input symbol and and output symbol.
  • 16.
    B. Analytic Flowcharts Analyticflowcharts identify all significant processing in an application, emphasizing processing tasks that apply controls. In other words, functional areas are separated by columns. See Figure 210 on page 42.
  • 17.
    B. Document Flowcharts Identifiesthe point of origin, distribution, and ultimate disposition of each document used in an application system. See Figure 2-11 on page 43.
  • 18.
    C. Forms DistributionChart Illustrates the distribution of a single multiple copy form within an organization. Emphasis is on form recipient rather than processing. (The following illustrates the Purchase Order in Figure 2-11 on page 43) Purchasing Stores Receiving 1 Vendor Acc. Payable 1 2 3 4 5 6 3 4 5
  • 19.
    E. Program orBlock Flowcharts Program flowcharts are used by system developers to provide detail about individual processing functions. The clutter of the additional processing detail is thus removed from a flowchart showing overall processing. Payroll Processing Hours Worked Payroll Payroll Register Compute Gross Pay Compute Withholdings Payroll Checks Printing
  • 20.
    III. System TechniqueSymbols A. Basic Flowcharting Symbols B. Other Symbols
  • 21.
    A. Basic FlowchartingSymbols Basic Input/Output Symbol – Making data available for processing or the recording of processed information. Process – Transforming data into information or other data. Flowline Symbol – Used to show the sequence of information and processing. ----- Annotation – Used to show descriptive comments.
  • 22.
    B. Other Symbols Specialized Input/Output Symbols – See Figure 2-2 on page 35.  Data Flow Diagram Symbols – See Symbols in Table 2-1 on page 39. See Illustrations in Figures 2-7 through 2-9 on pages 40-41.
  • 23.
    IV. The Useof Systems Techniques Auditing B. Systems Development A.
  • 24.
    A. Auditing Two basiccomponents of an external audit of financial statements include:   Compliance testing is used to determine the extent to which established control procedures are actually being carried out. Substantive testing to verify amounts shown on financial statements. The level of substantive testing will depend on the extent to which the auditor depends on an entity’s system of internal control.
  • 25.
    B. Systems Development Systemsdevelopment generally consists of the following three phases:    Systems Analysis – Logical data flow diagrams and analytic flowcharts help in providing an overall picture of the how the organization functions. Systems Design – A blueprint of how the proposed system will function. Systems Implementation – Taking steps to put system into operation by doing things like training personnel, and acquiring equipment and software.
  • 26.
    Summary I. II. III. IV. Five Types ofSystems Techniques Five Types of Flowcharting Techniques Basic Flowcharting Symbols Uses of Systems Techniques