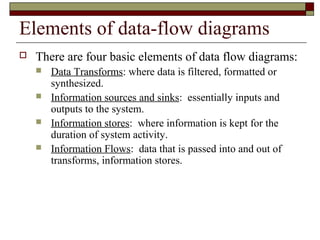
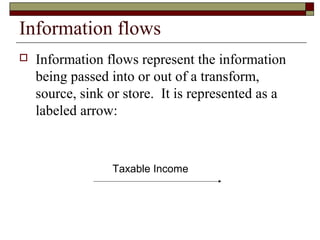
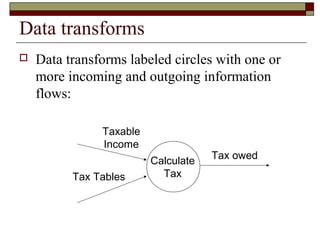
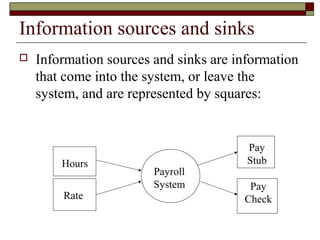
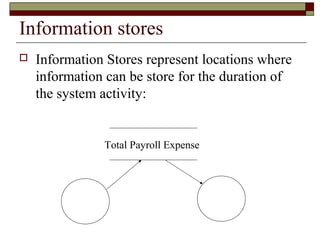
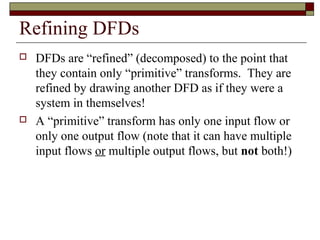
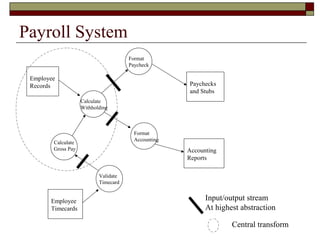
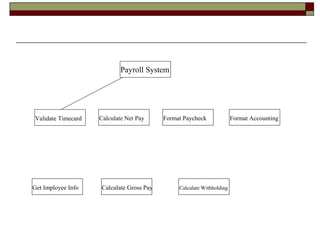
There are four basic elements of data flow diagrams: data transforms, information sources and sinks, information stores, and information flows. Data transforms represent processes, sources and sinks represent inputs and outputs, stores represent data storage, and flows represent the movement of data. Data flow diagrams are refined by decomposing transforms into more detail. Heritage numbers are used to identify the hierarchical relationships between diagrams. A data dictionary defines the data elements. Structure charts show the control flow and relationships between processes represented in data flow diagrams.