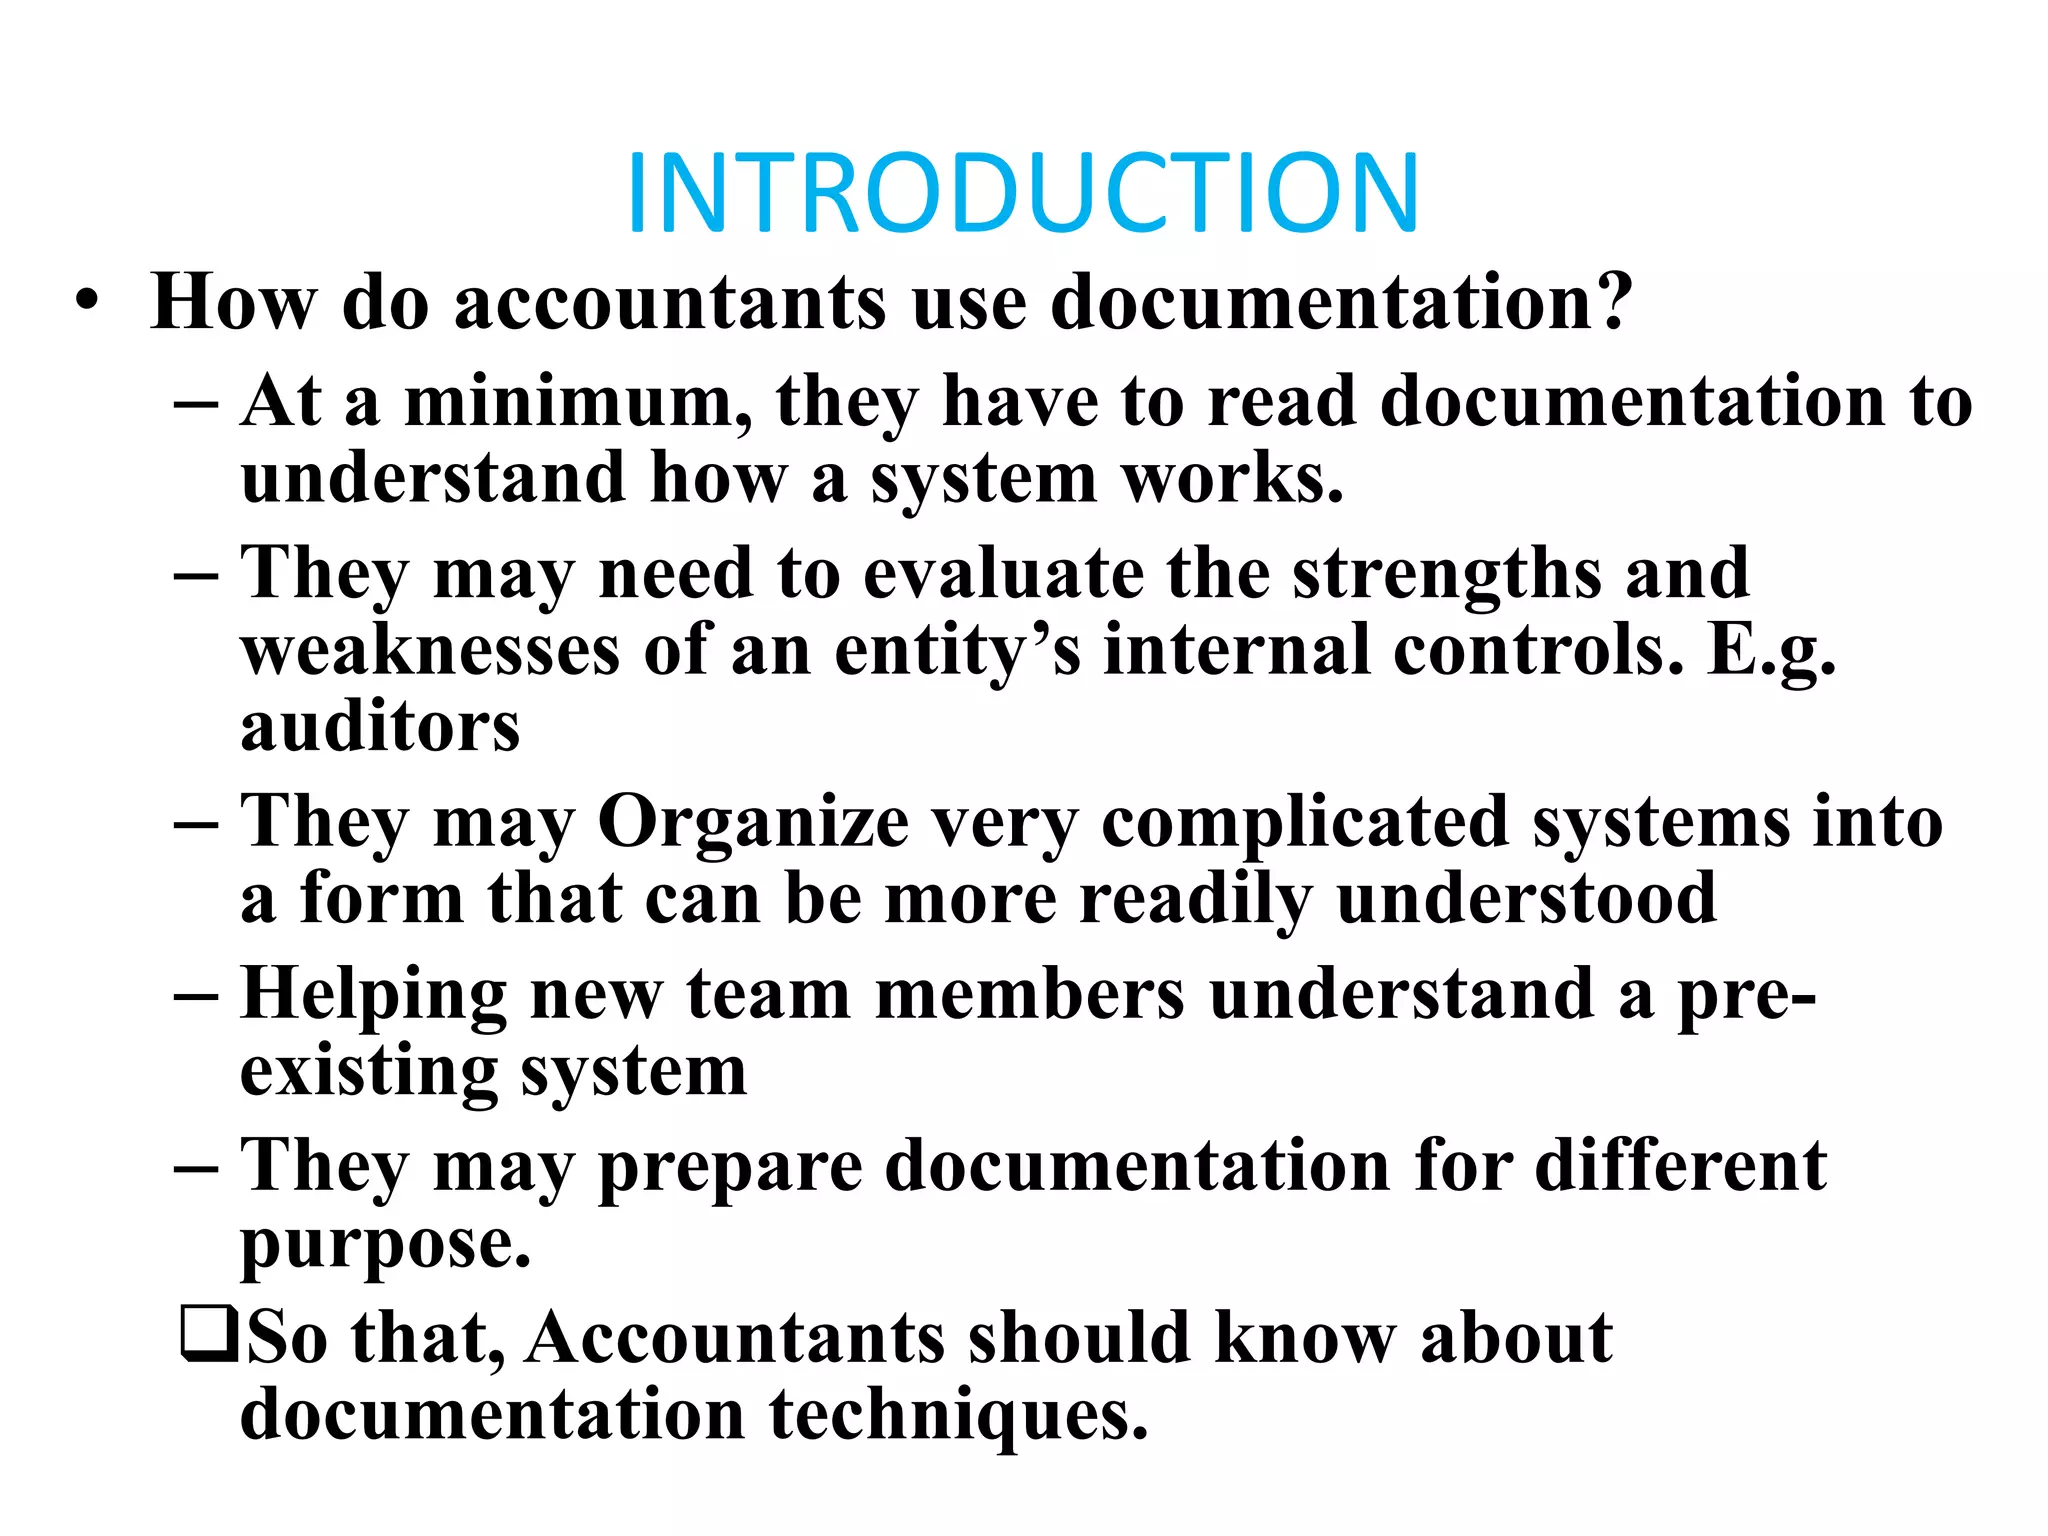
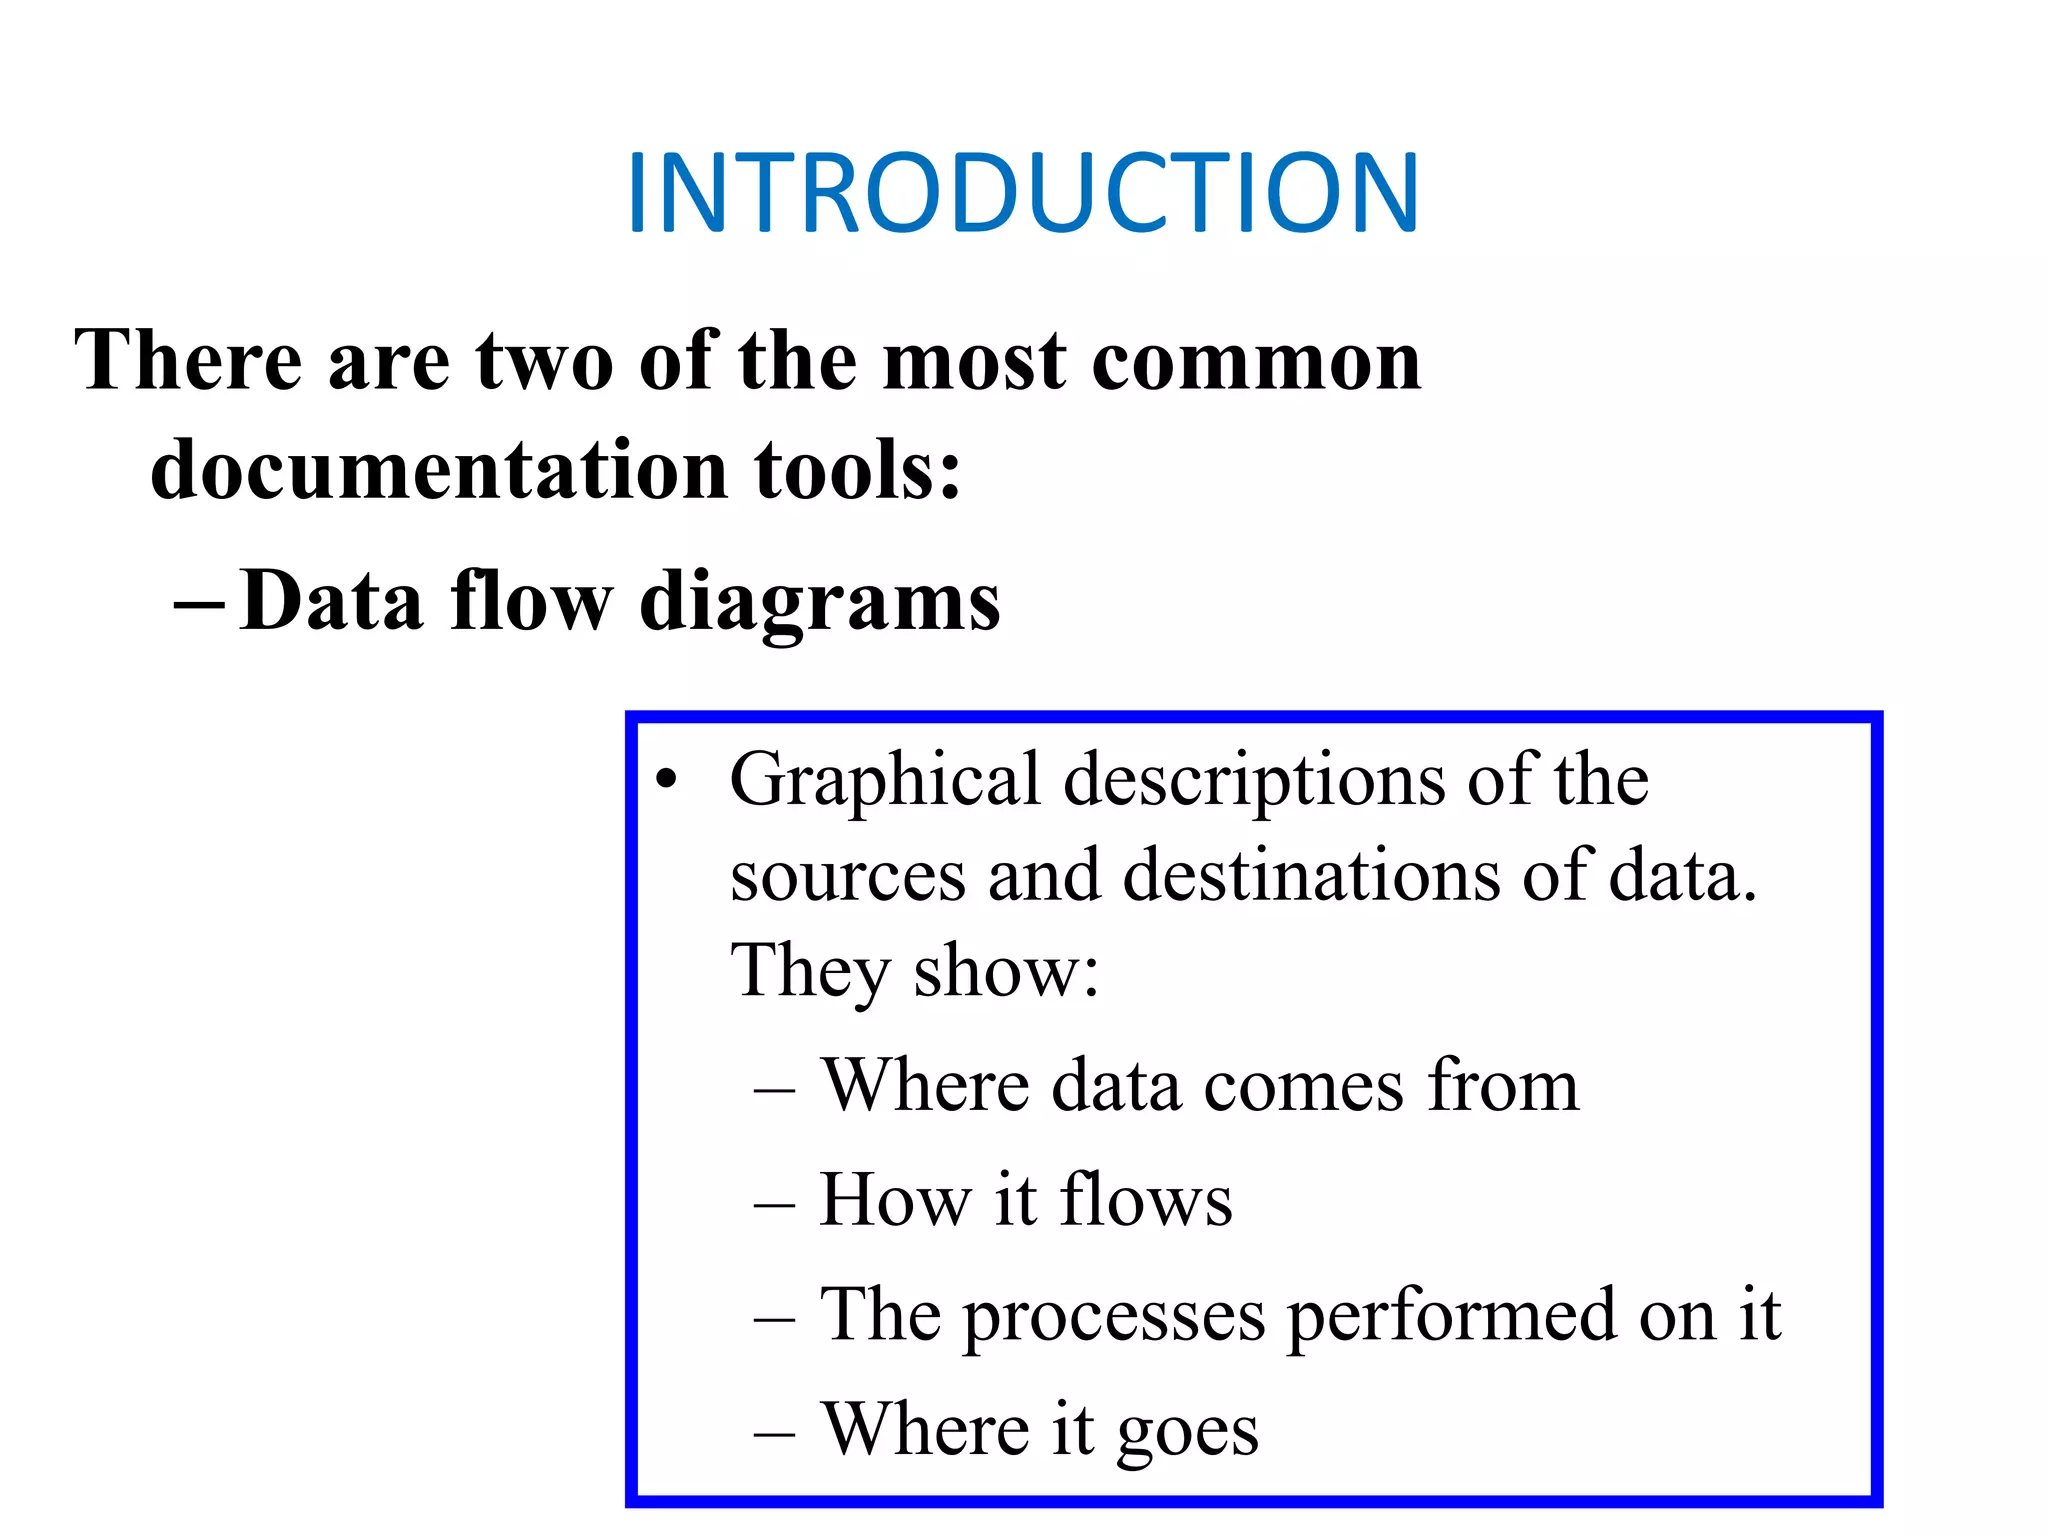
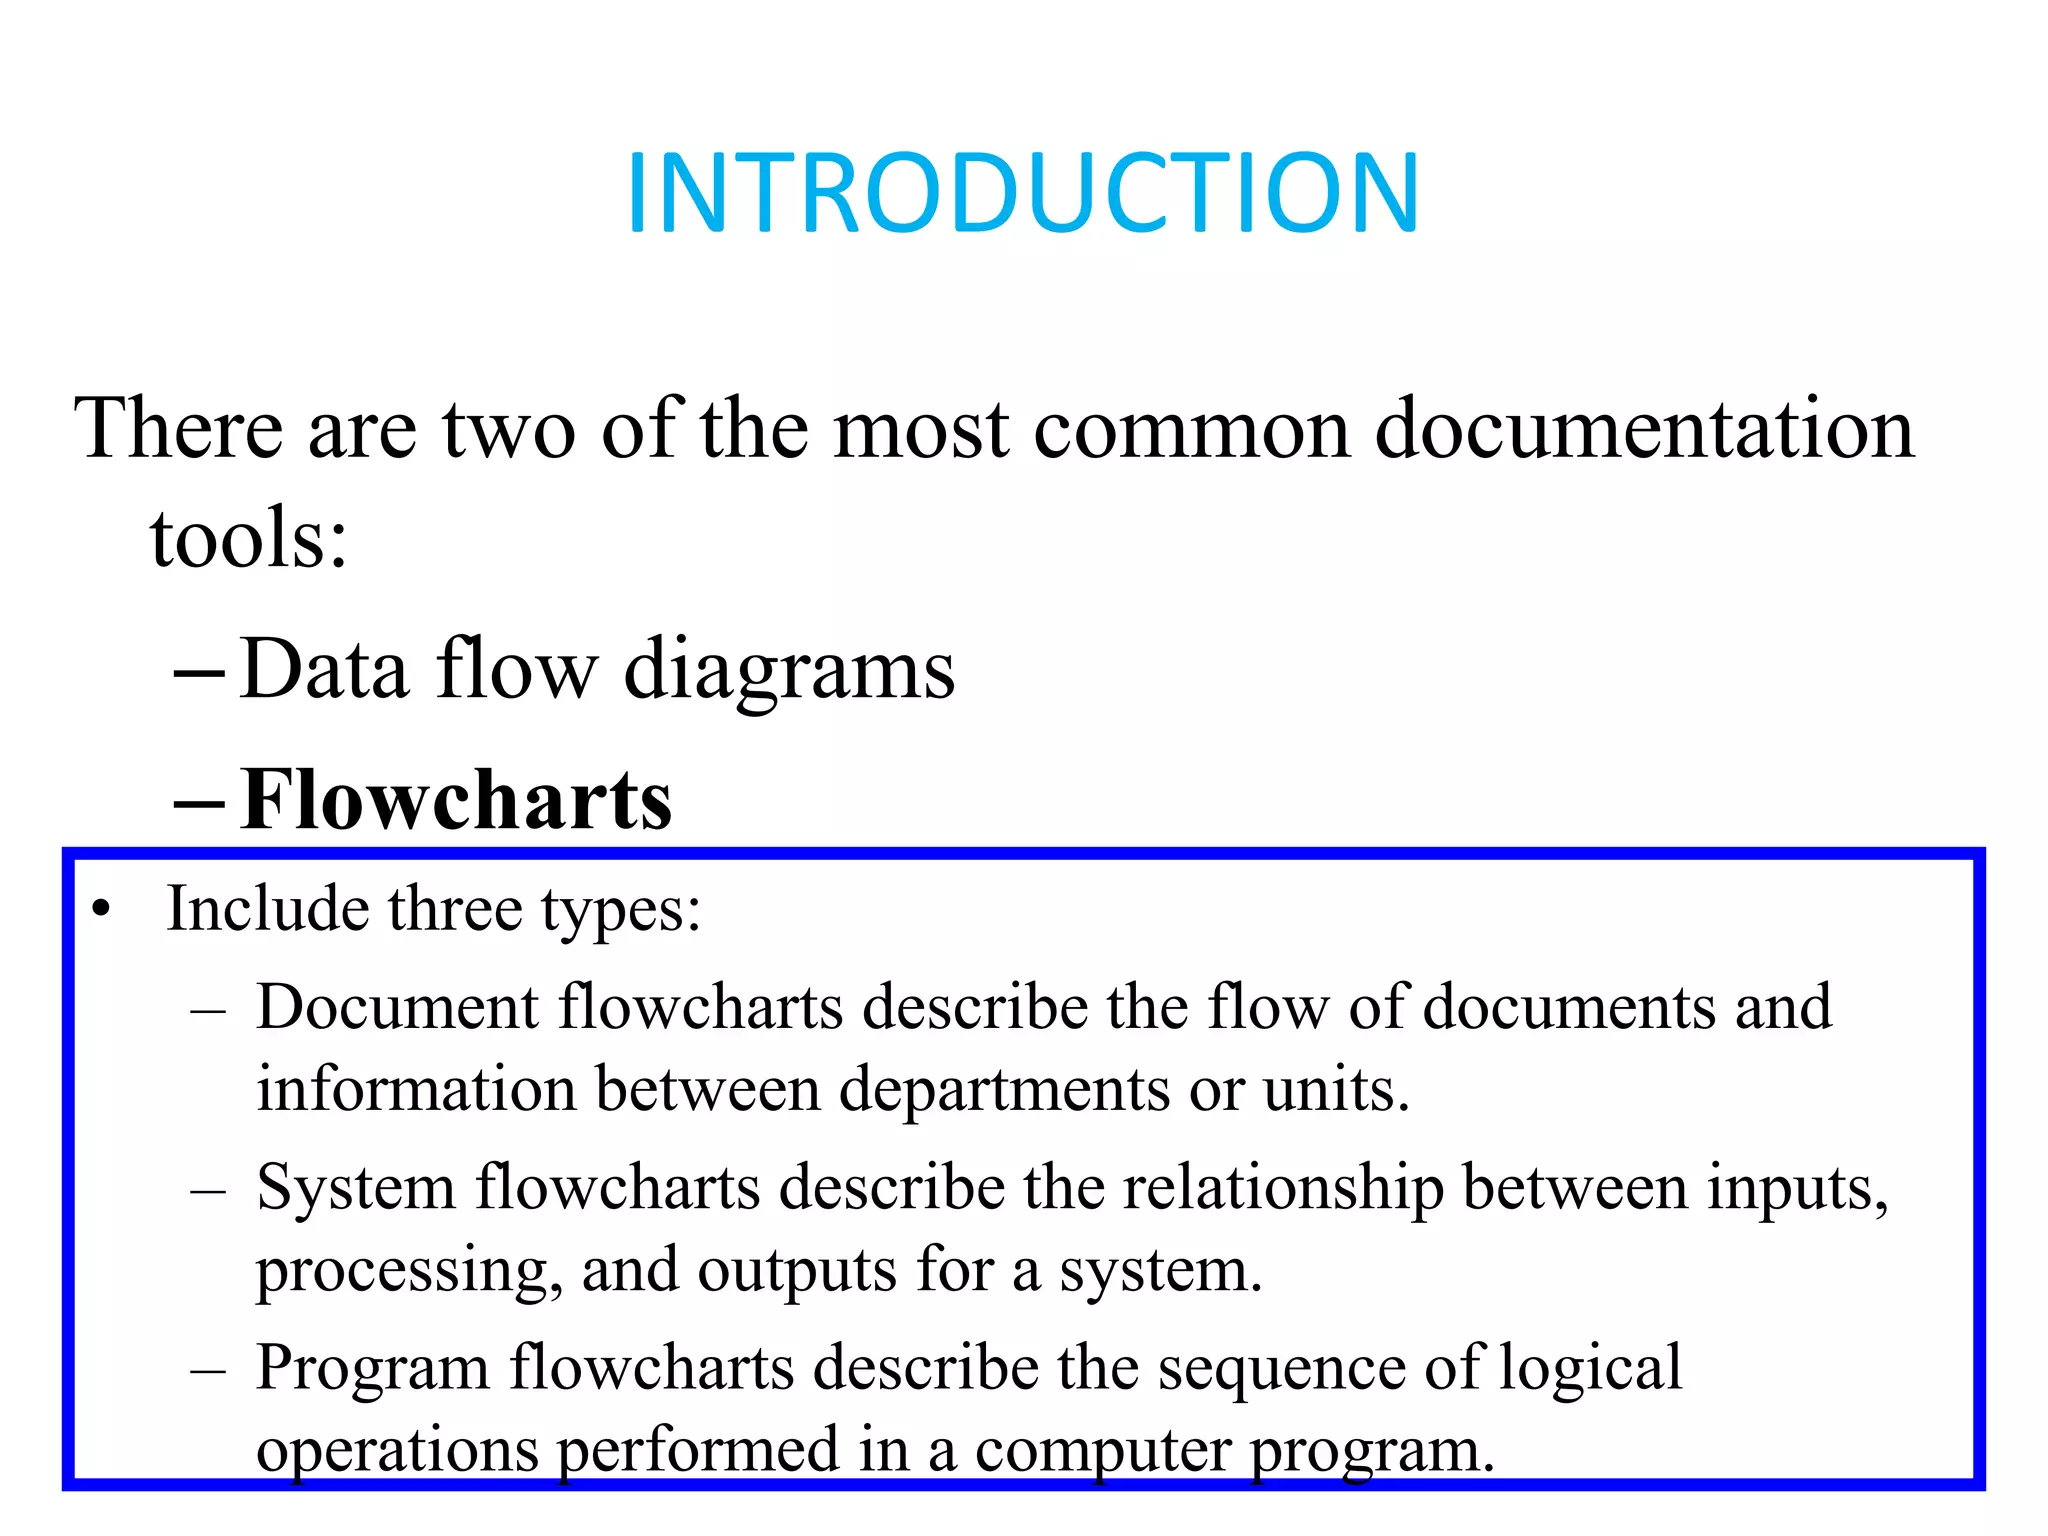
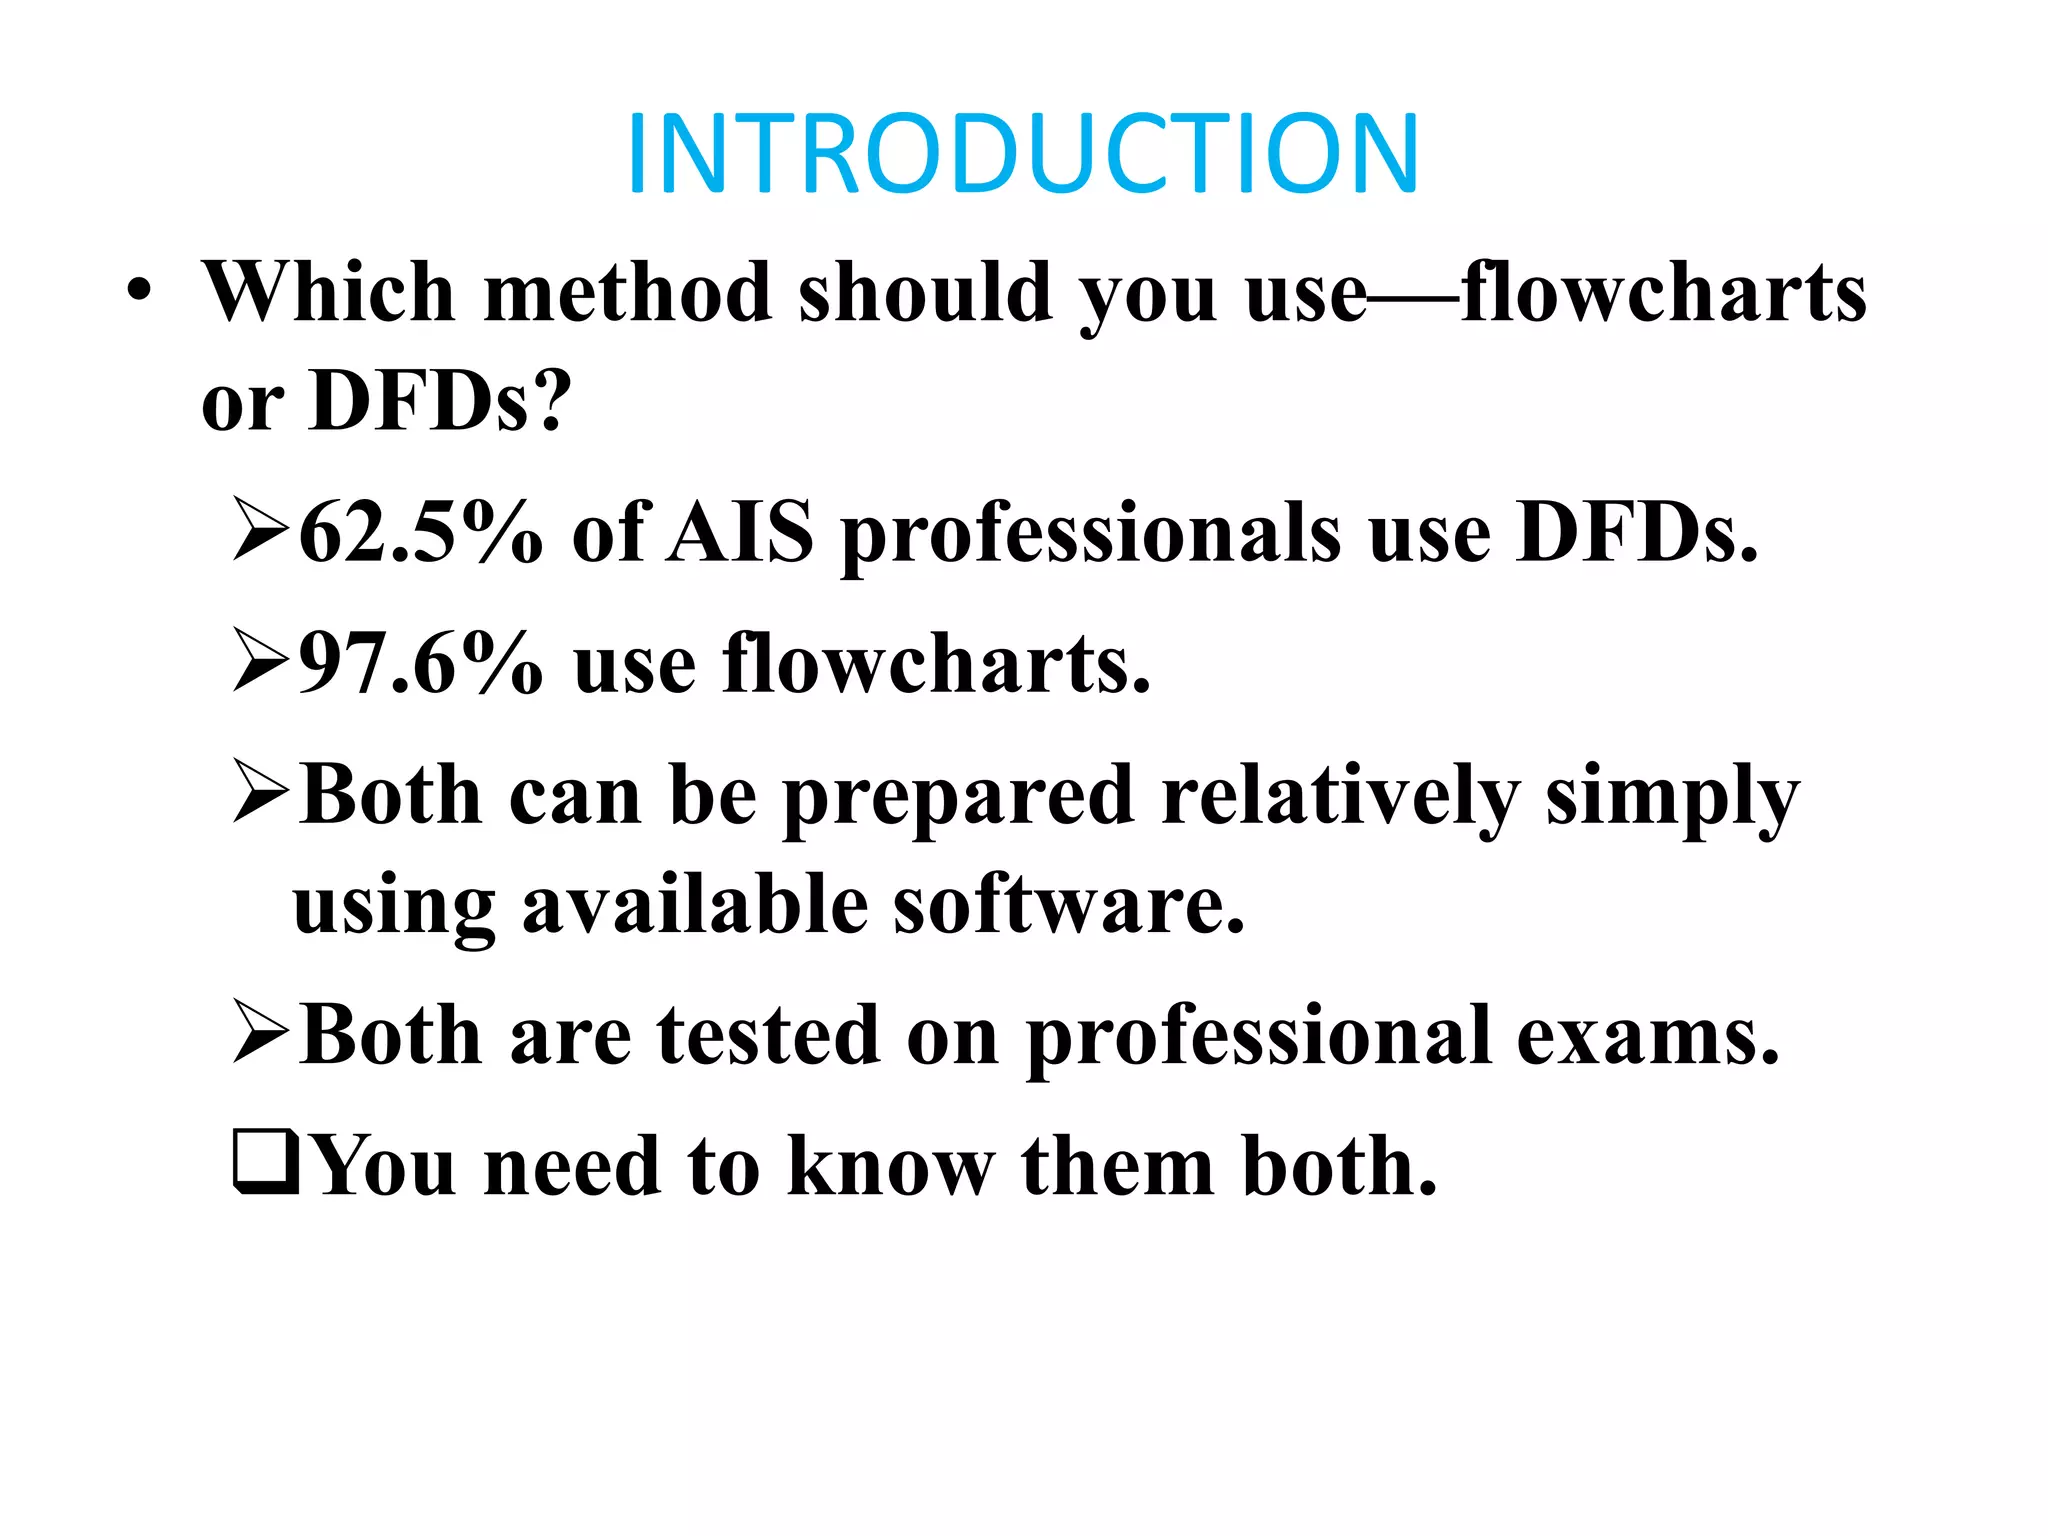
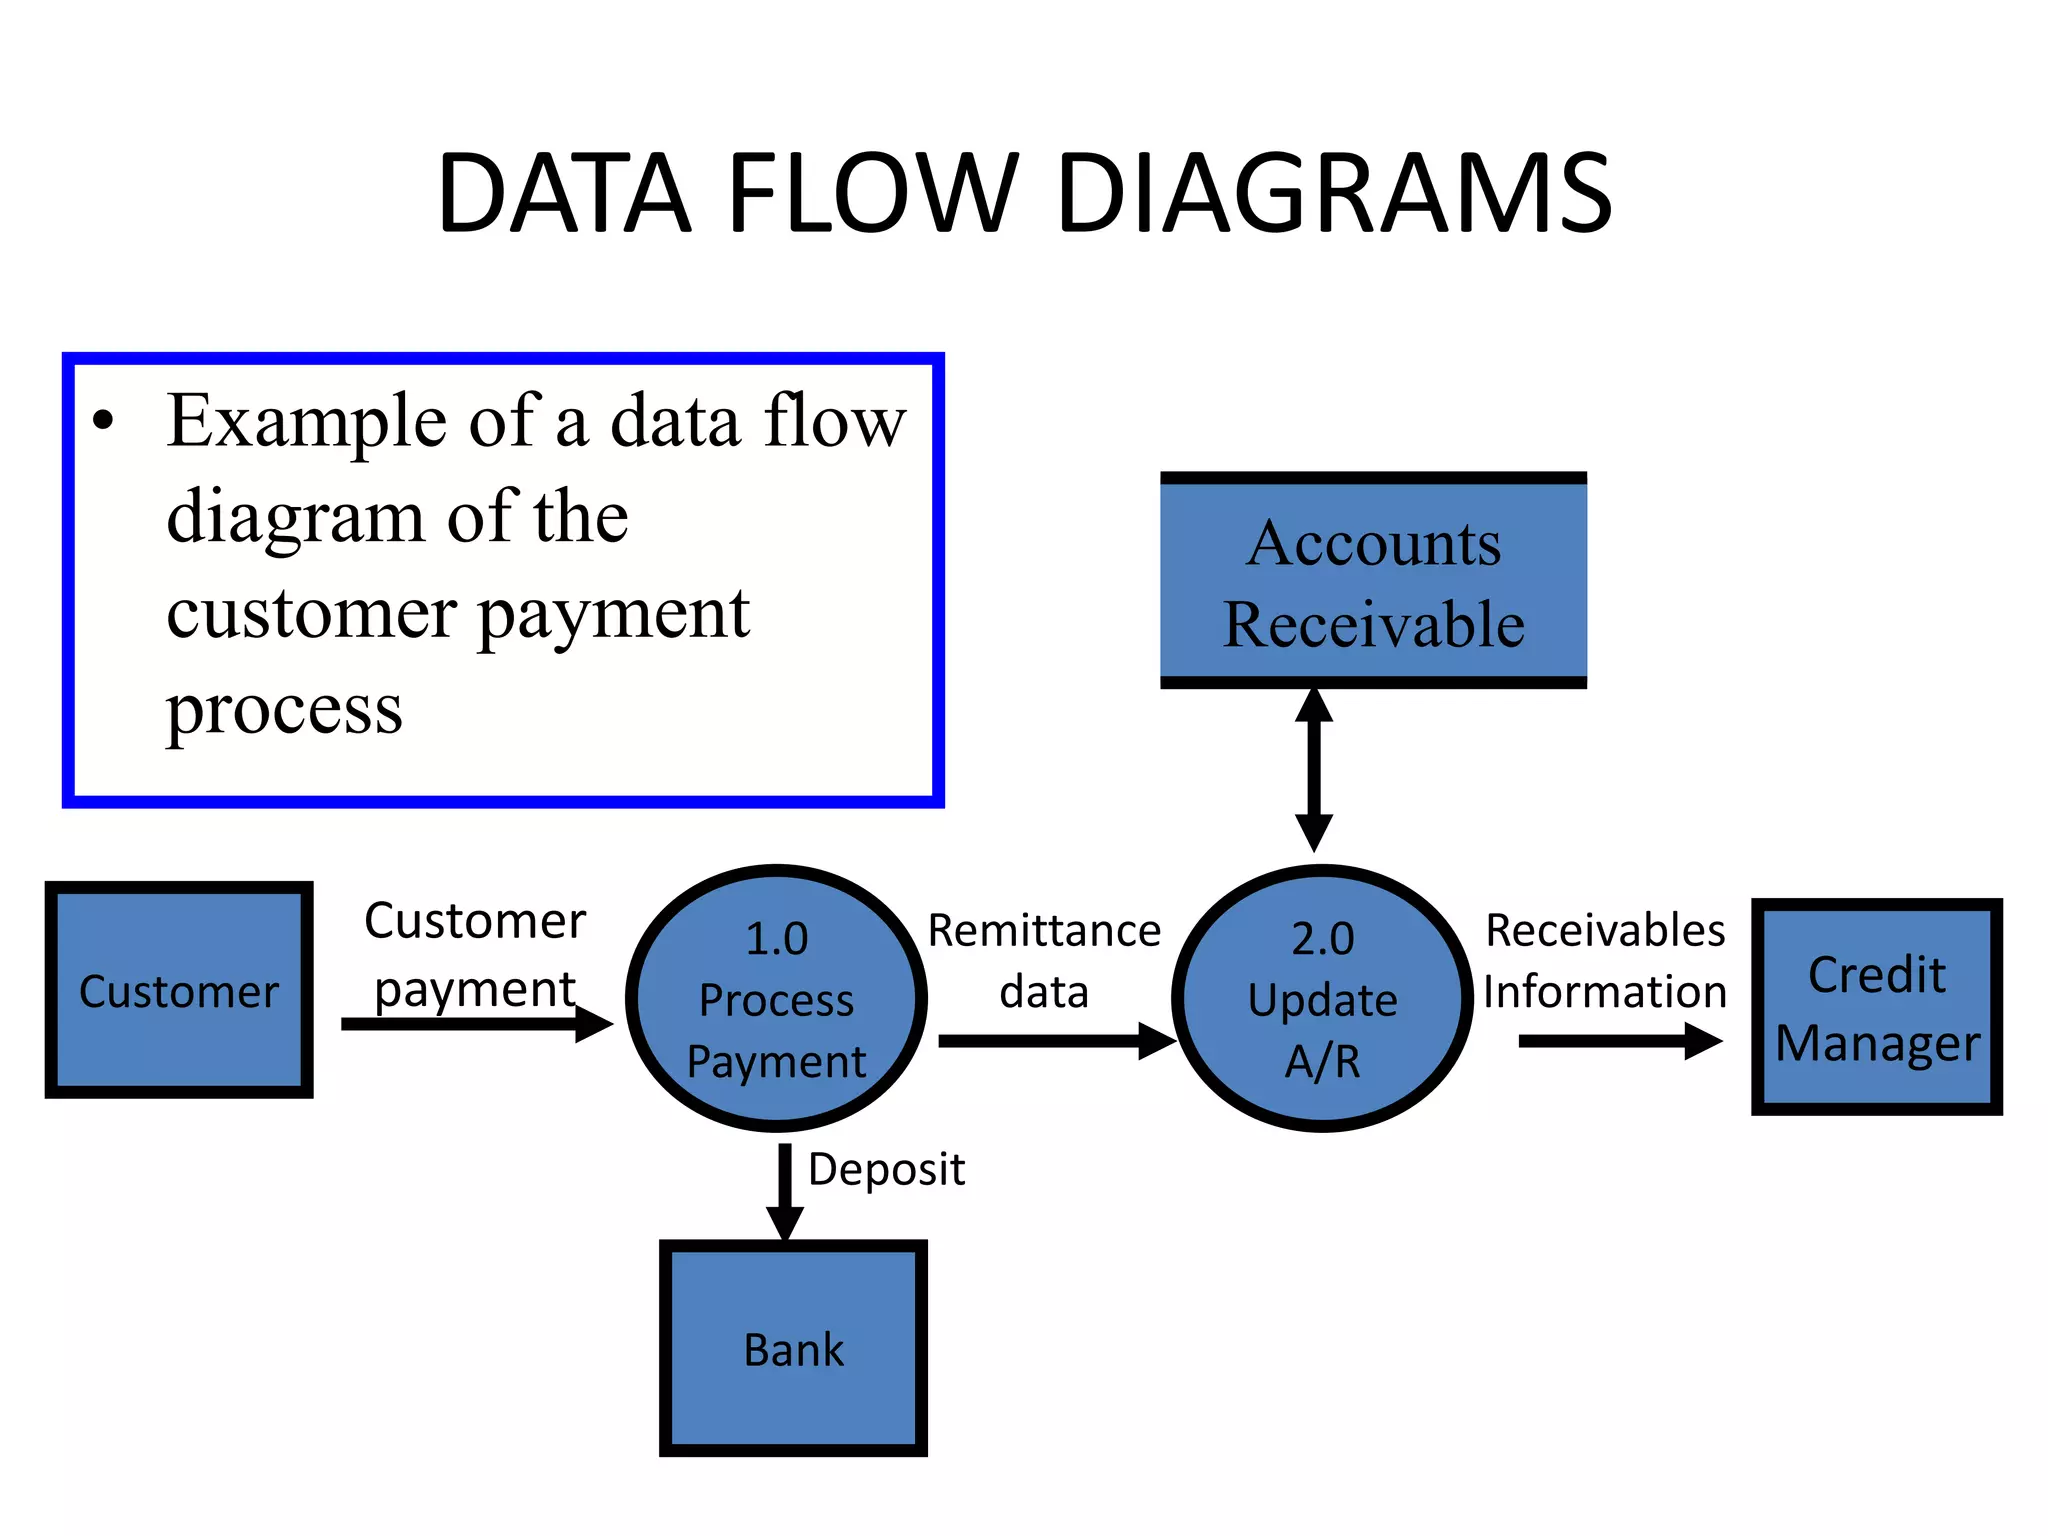
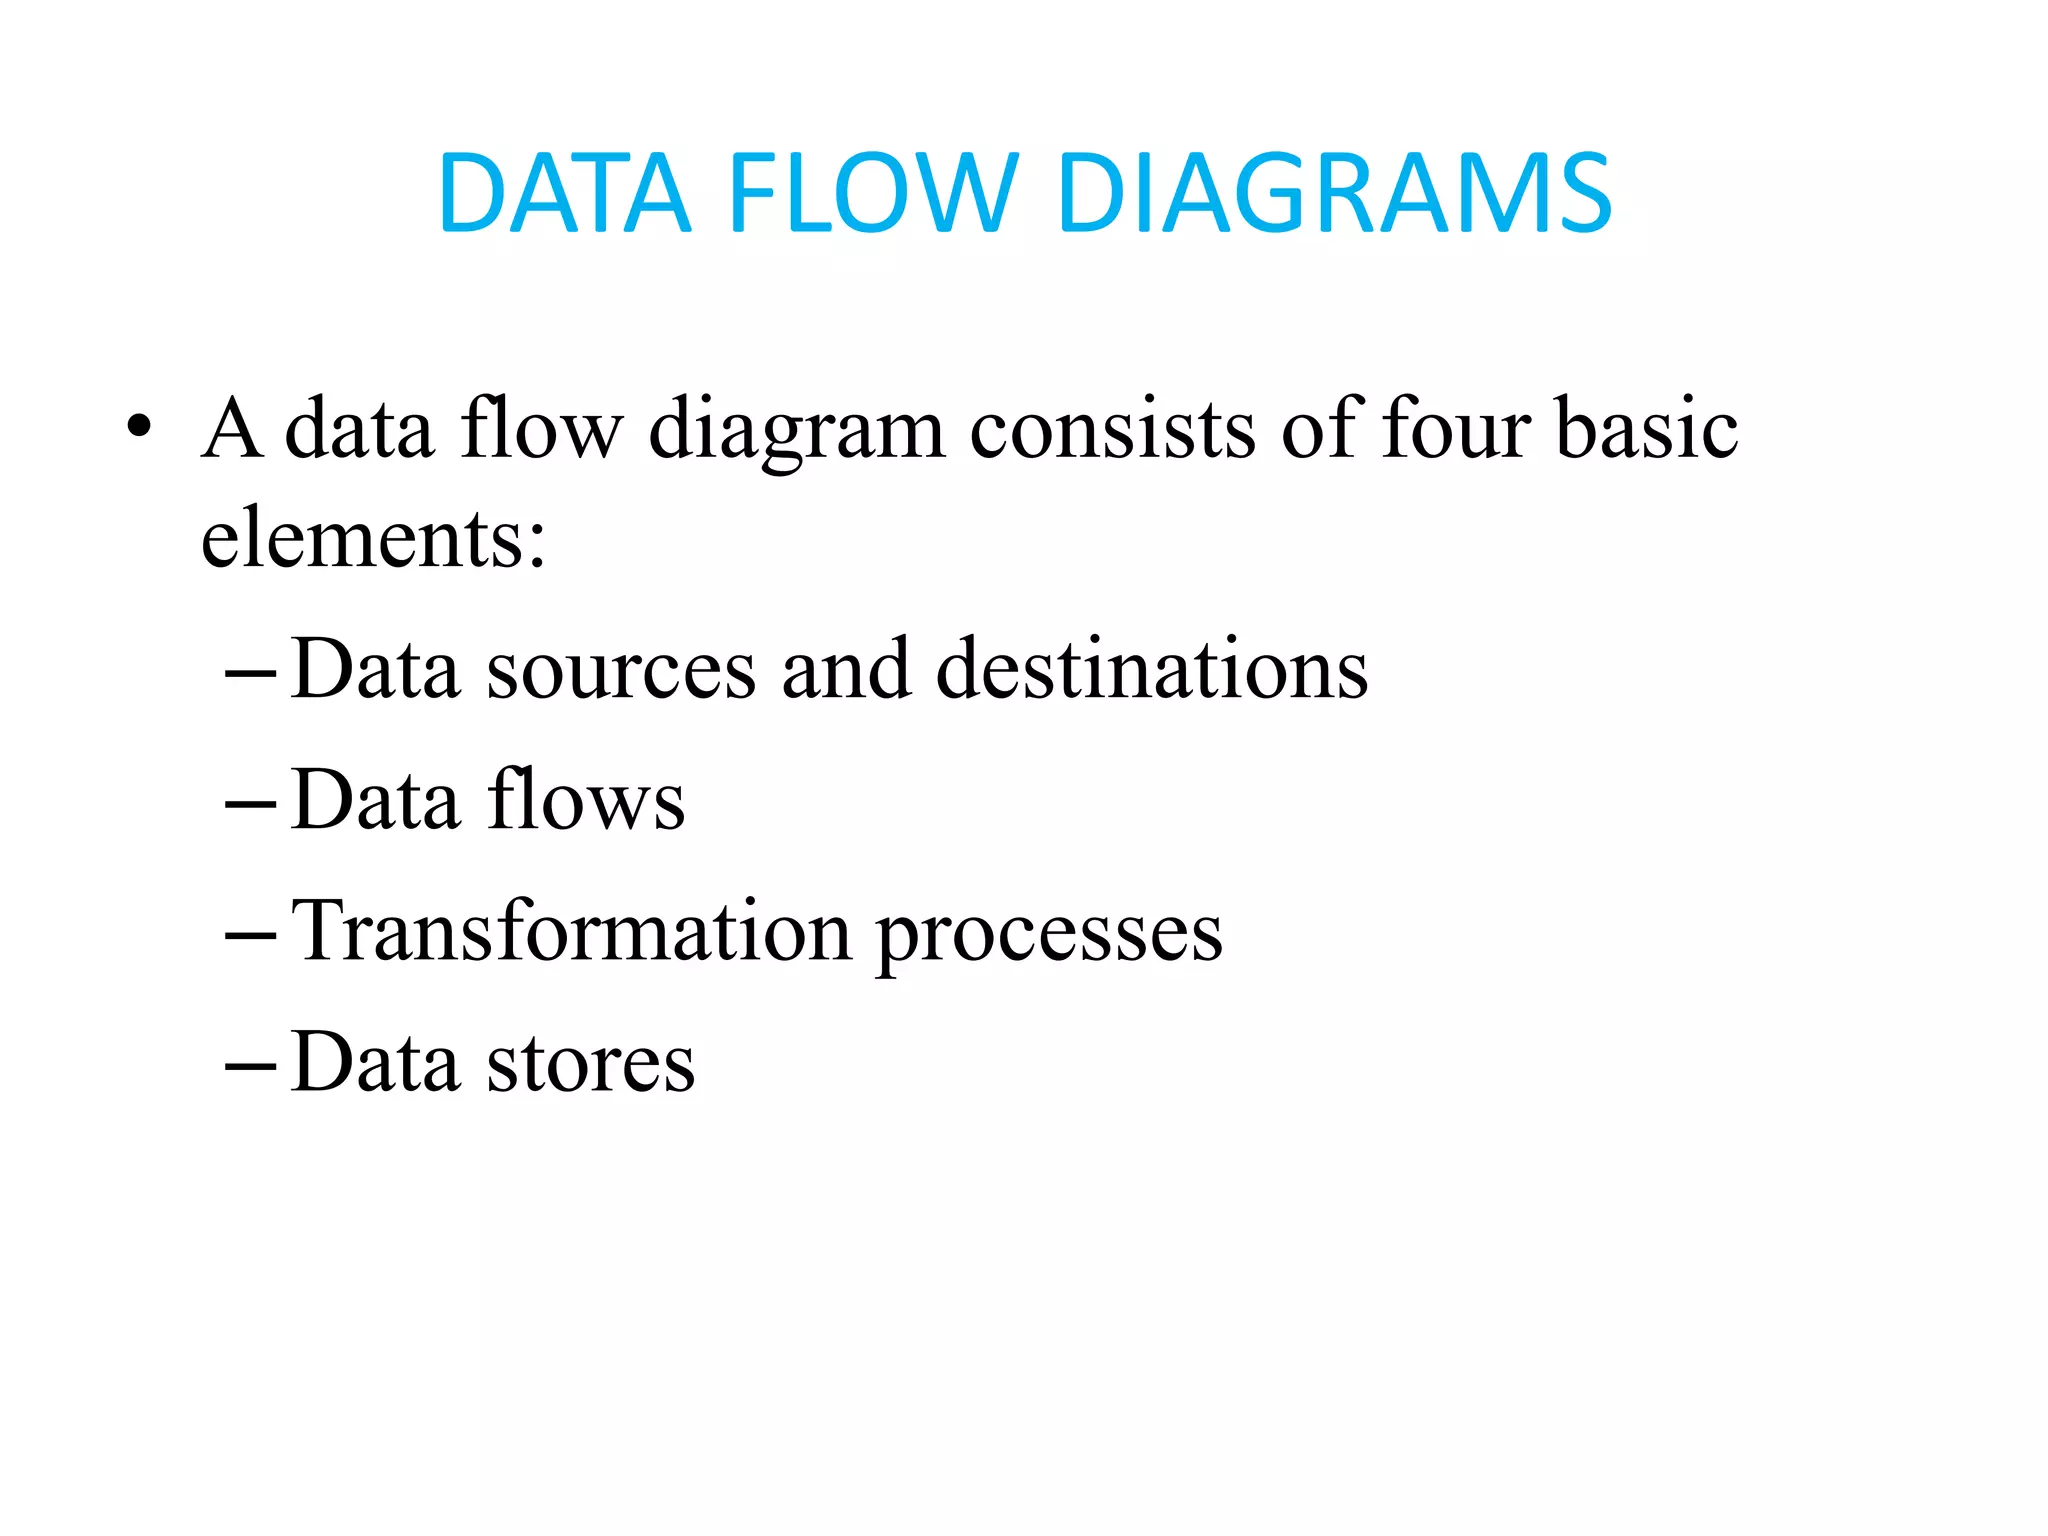
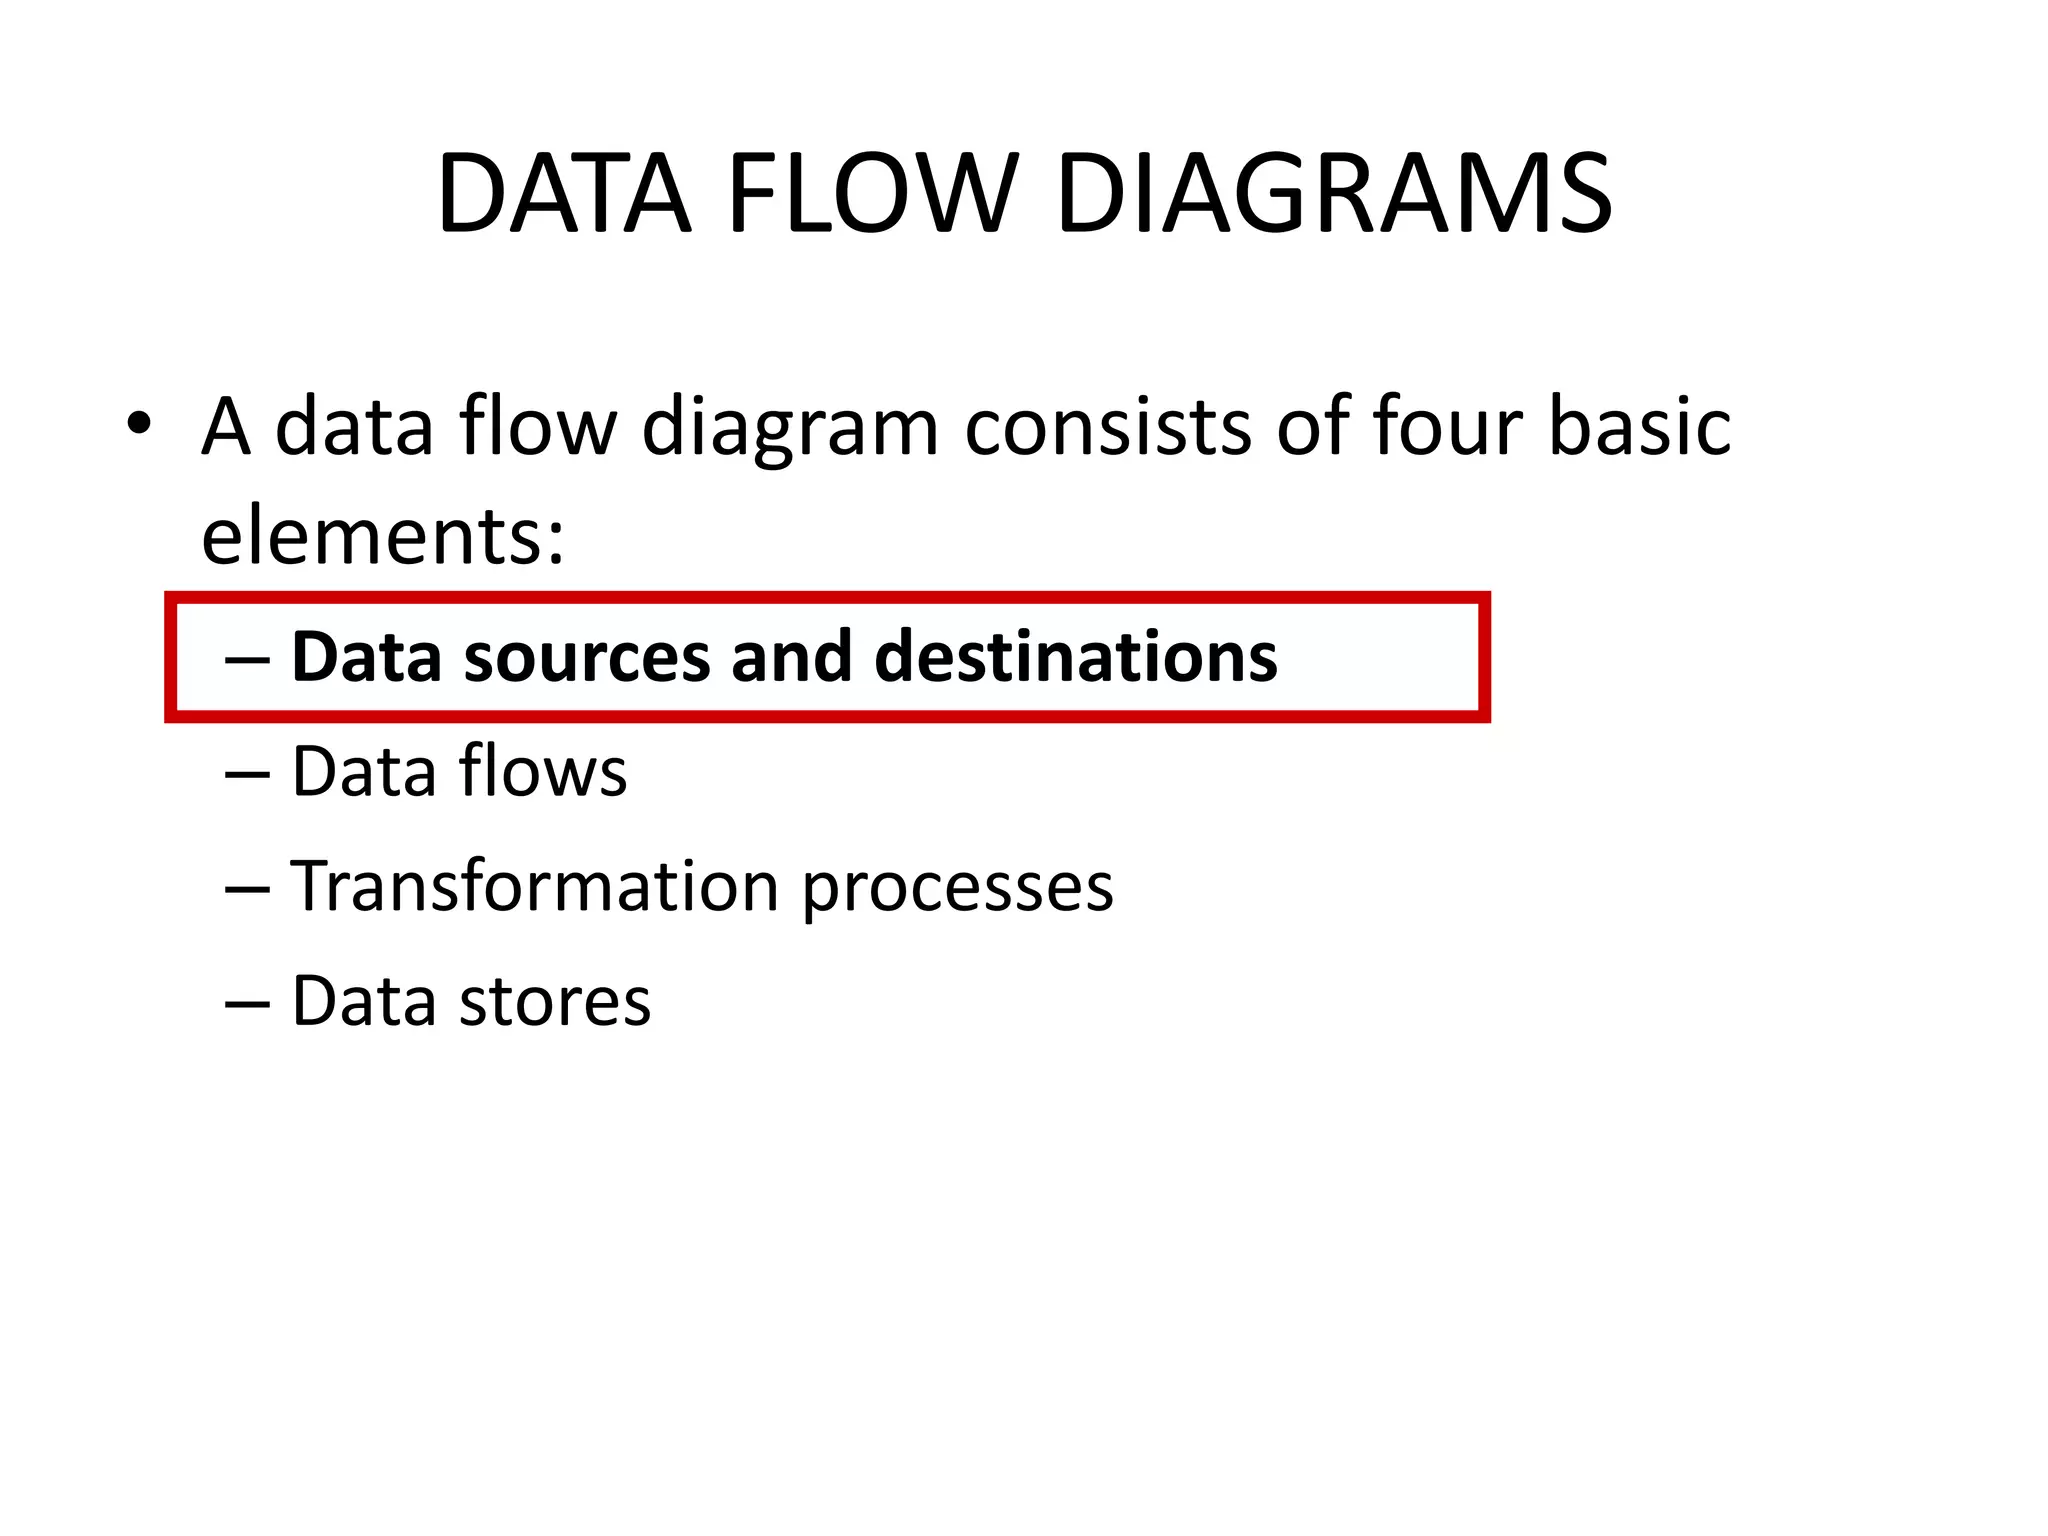
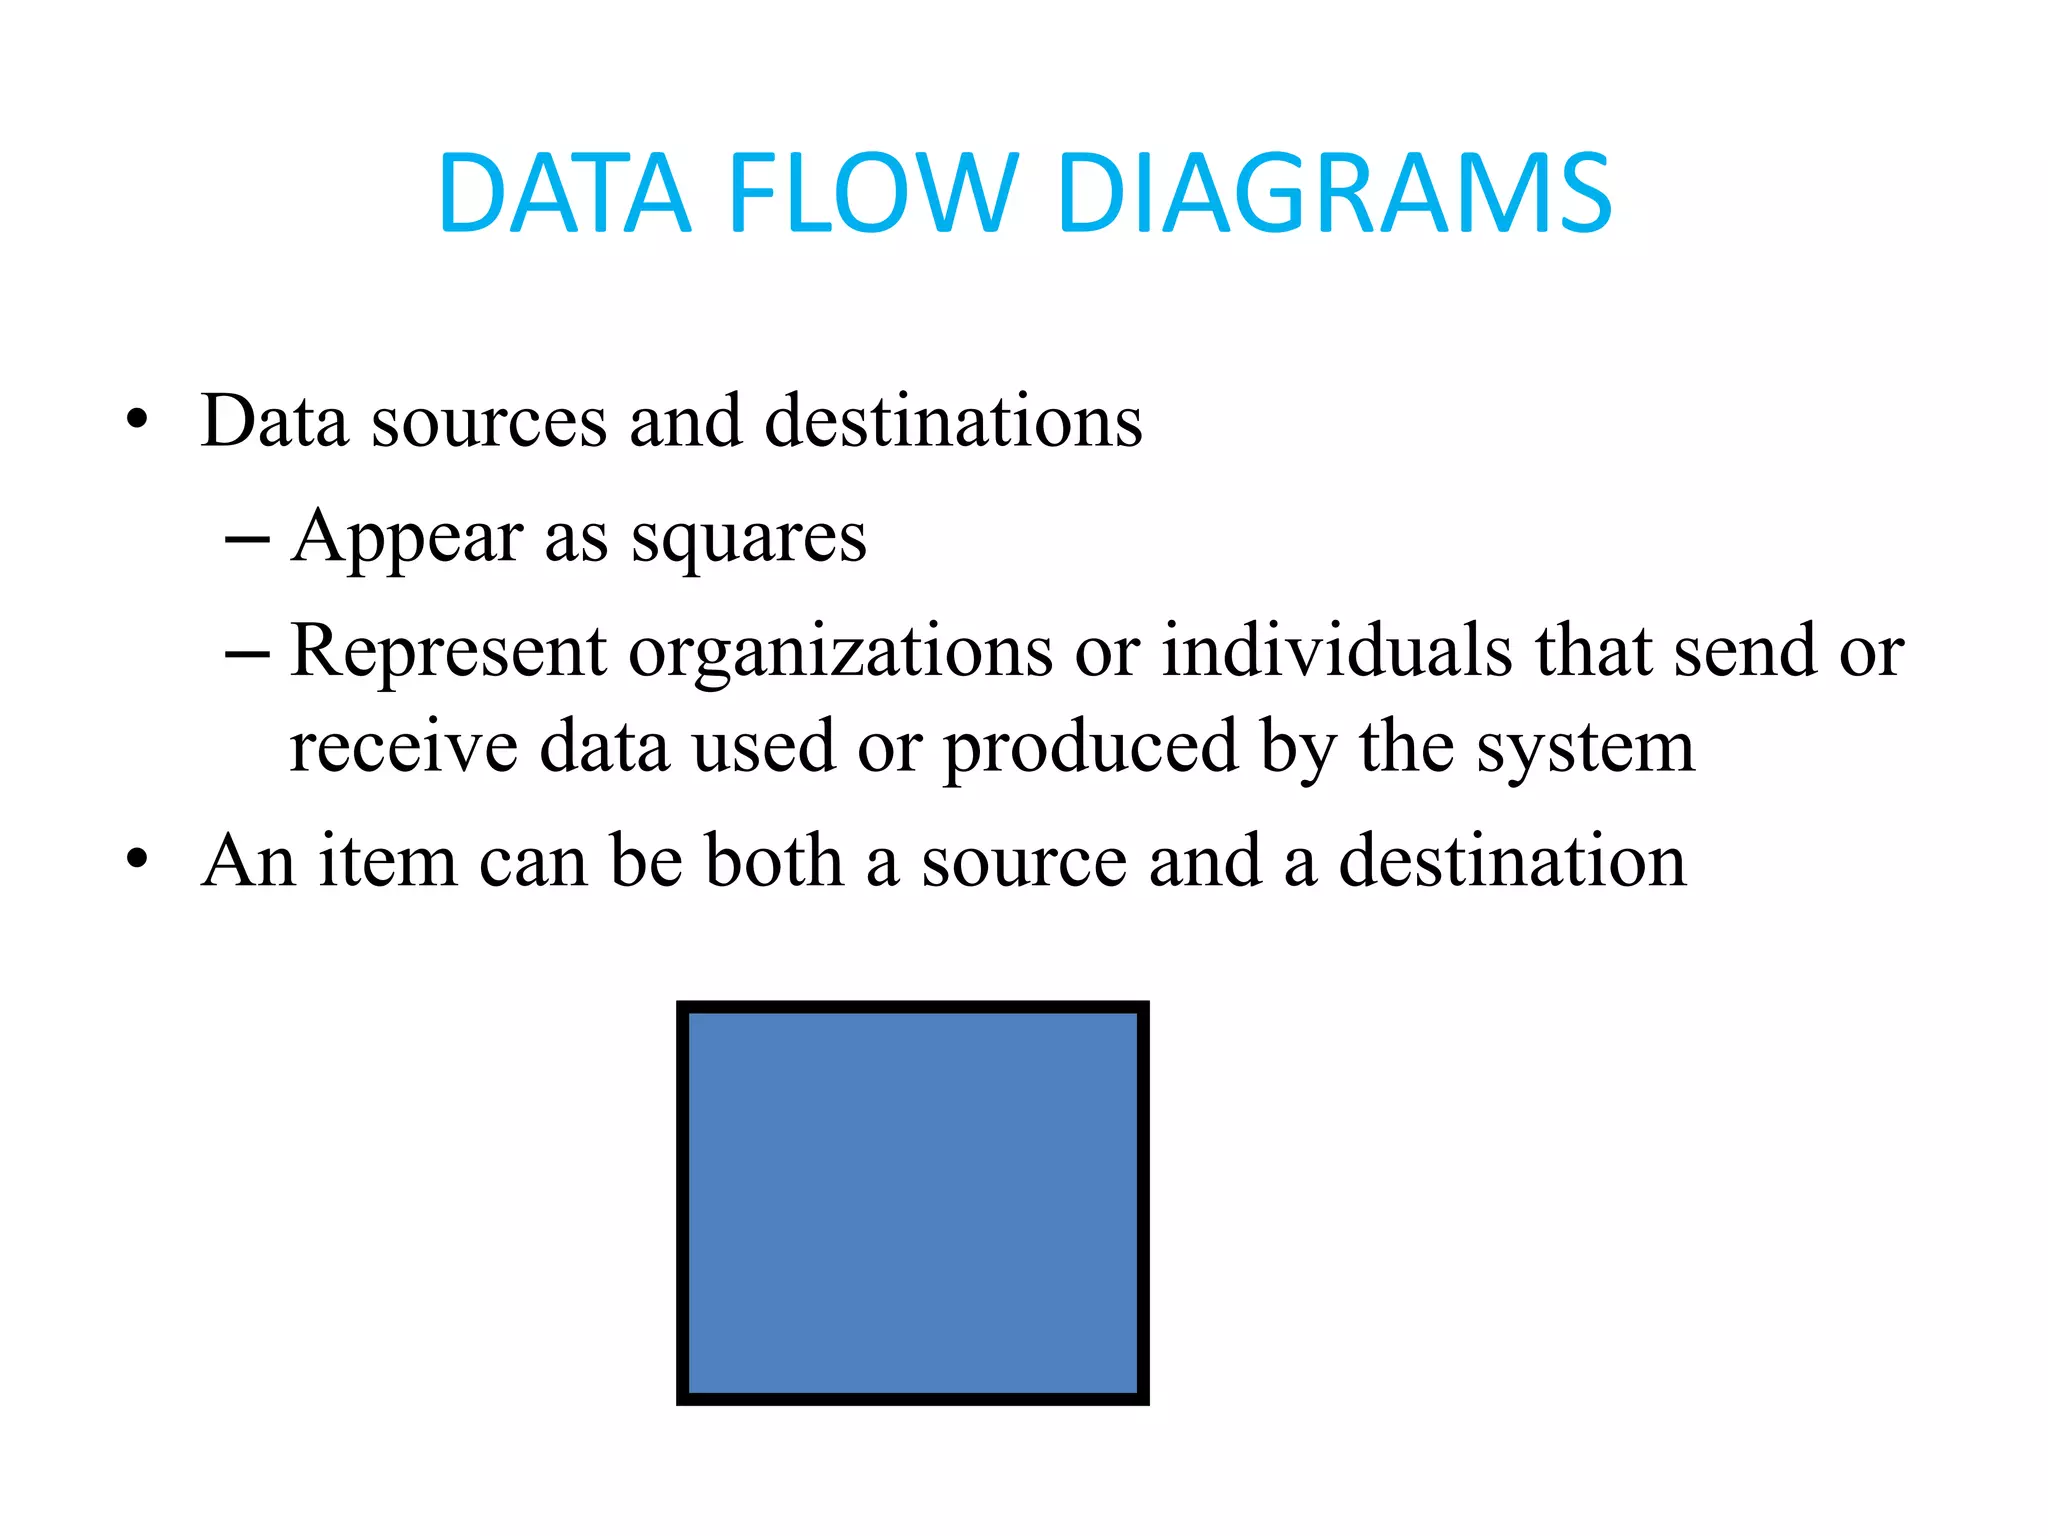
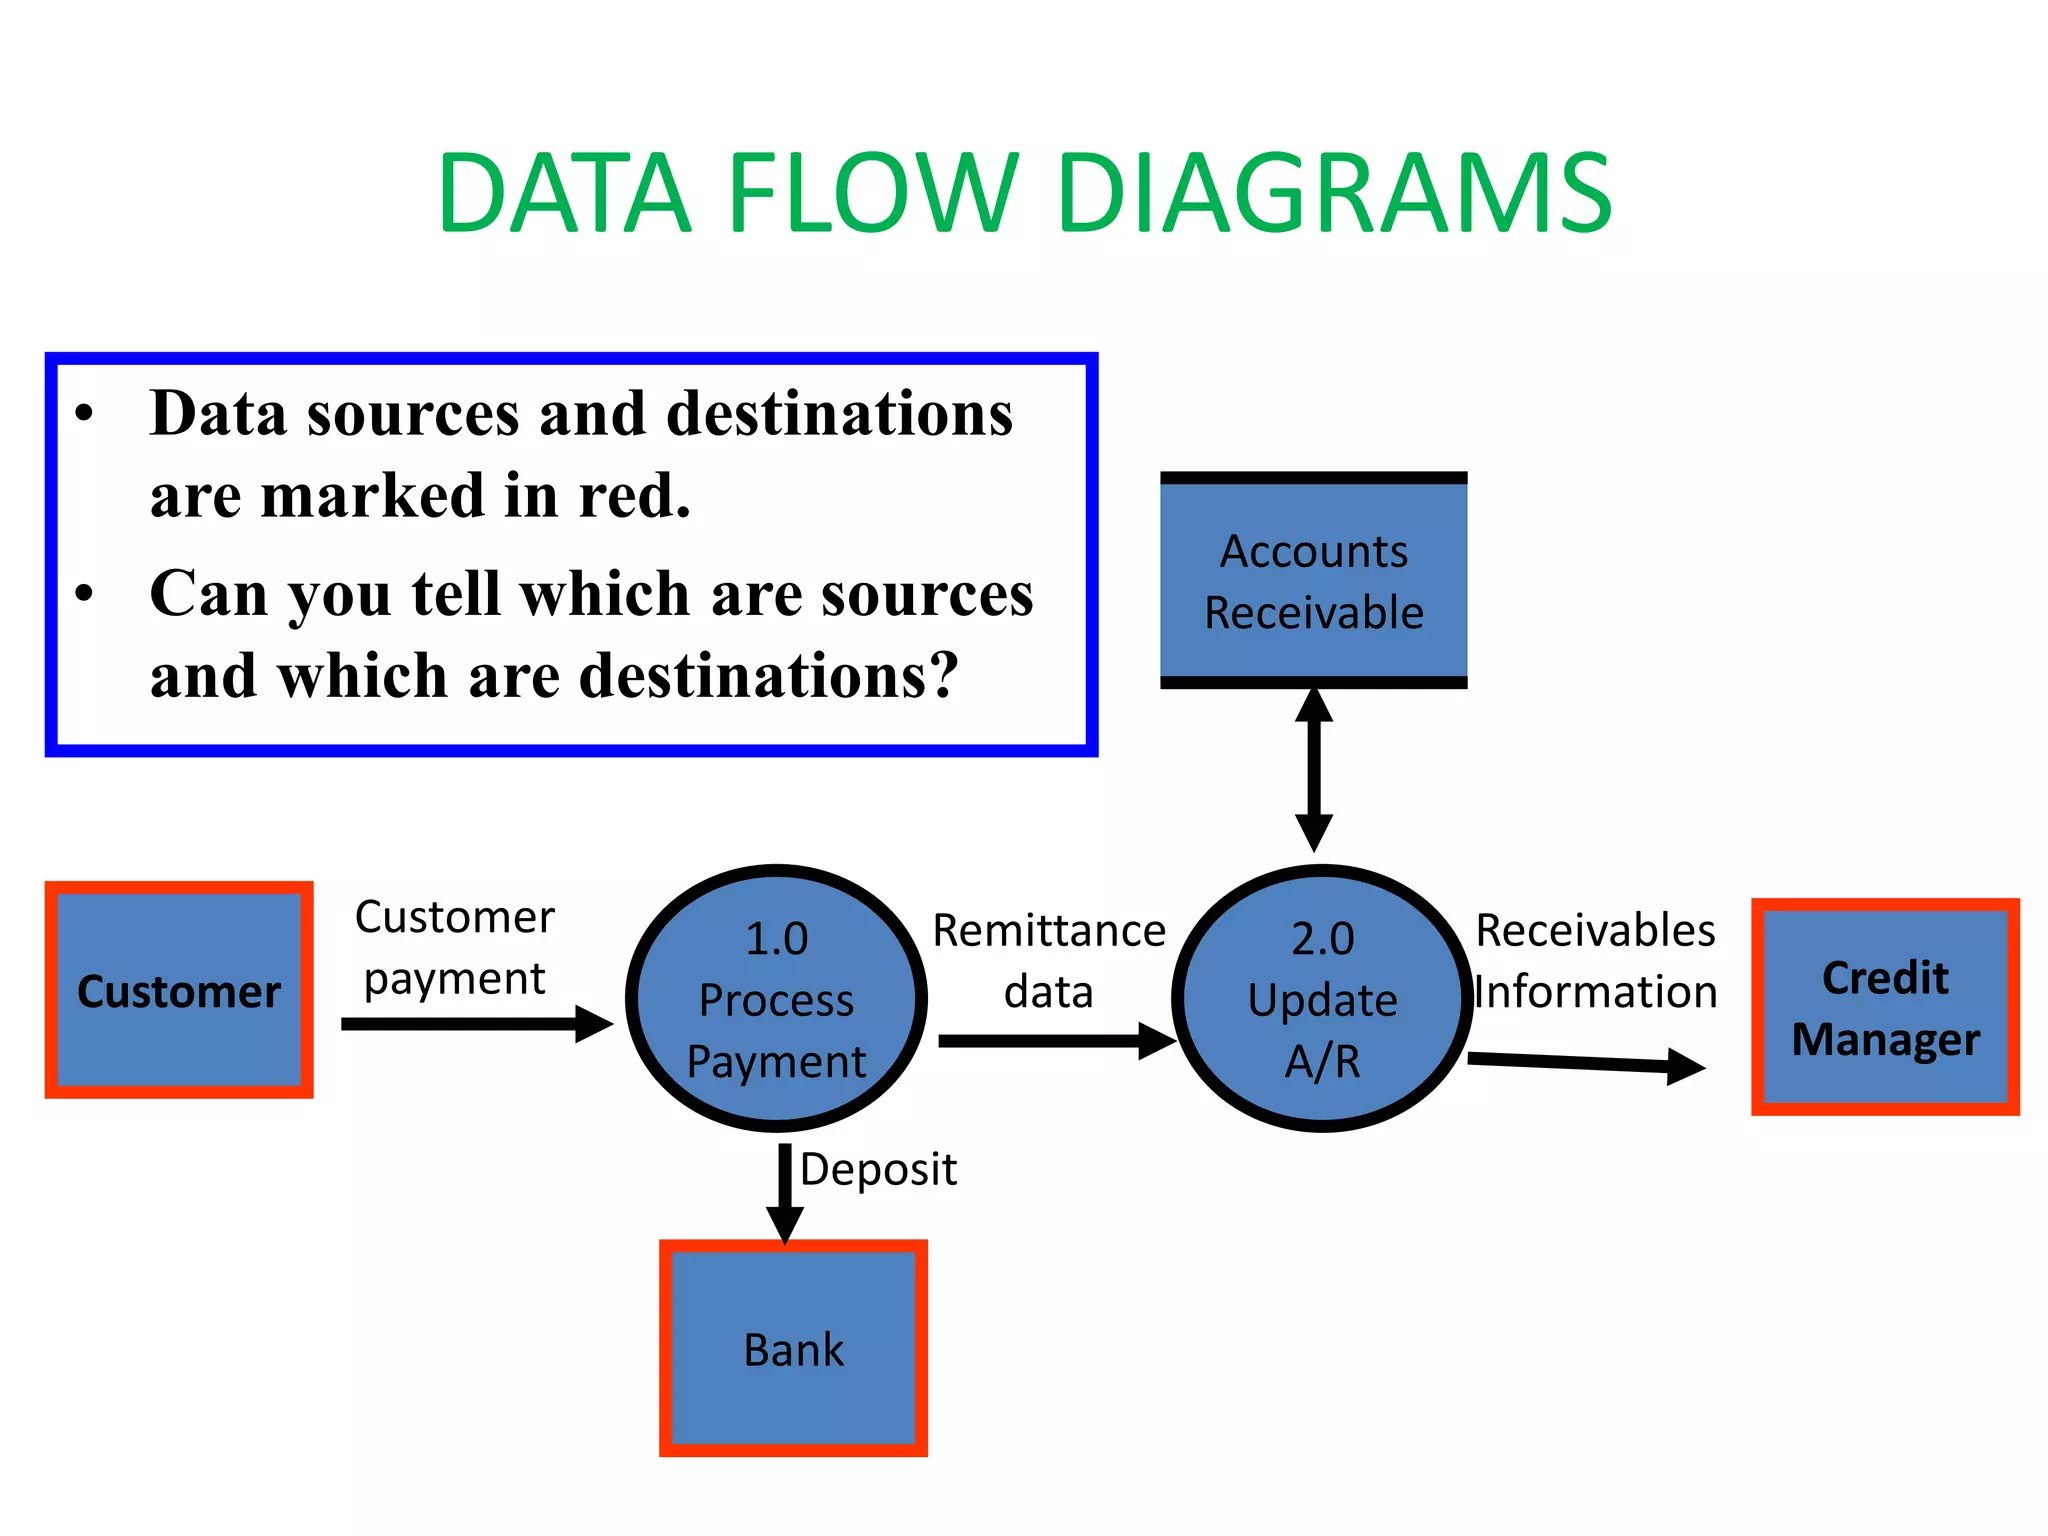
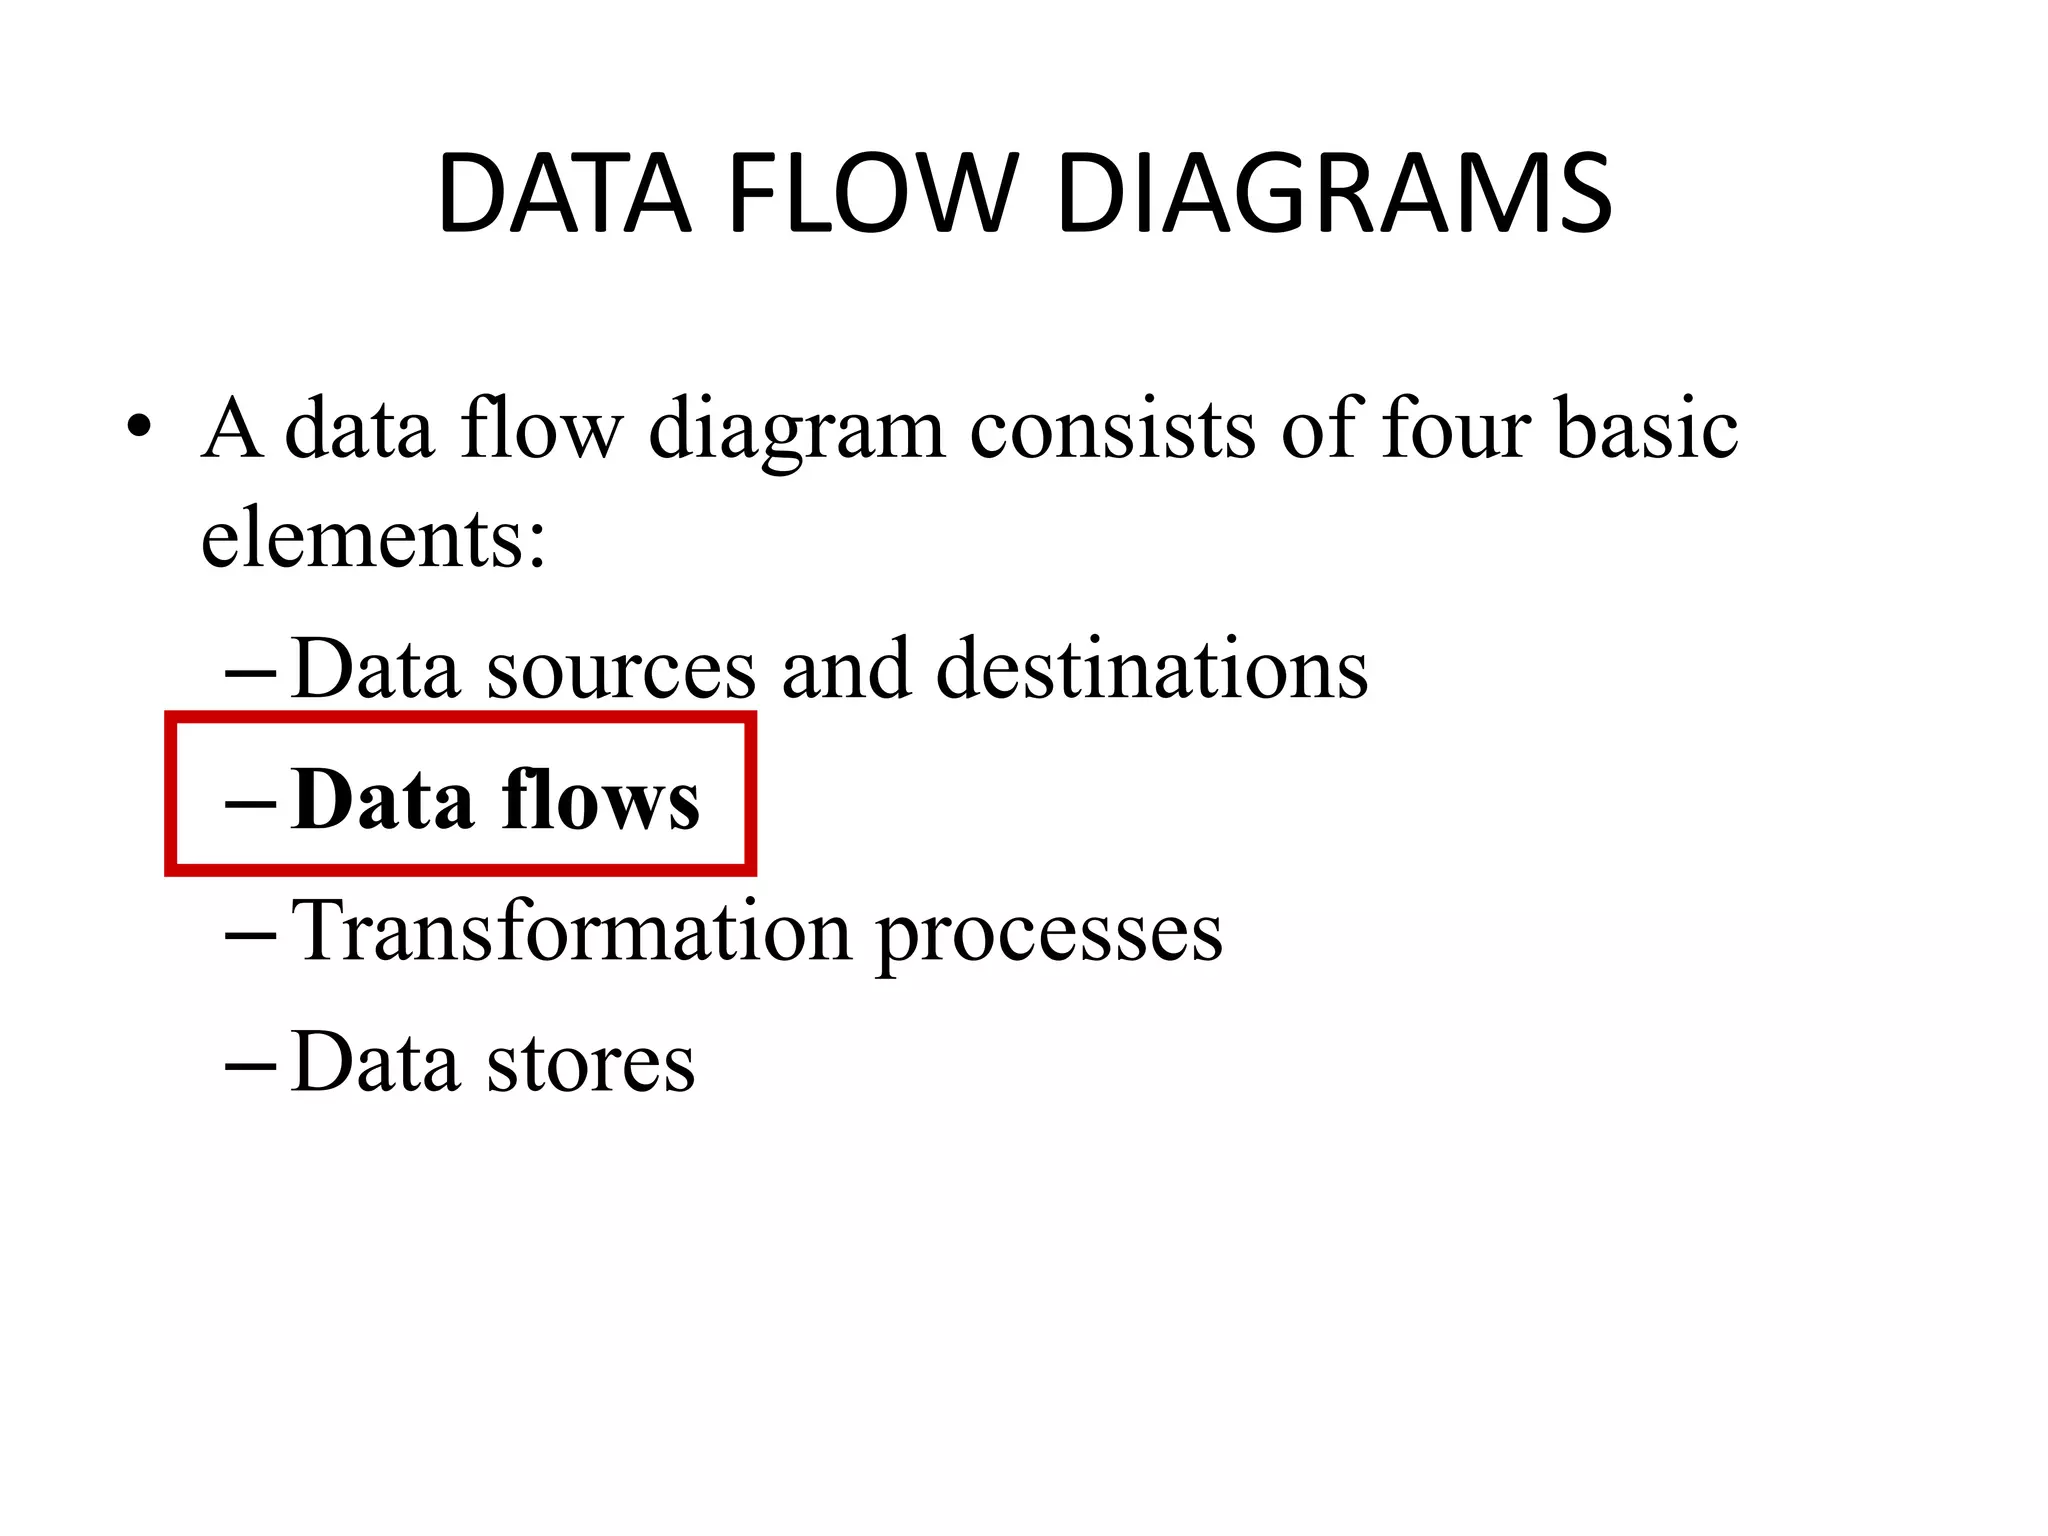
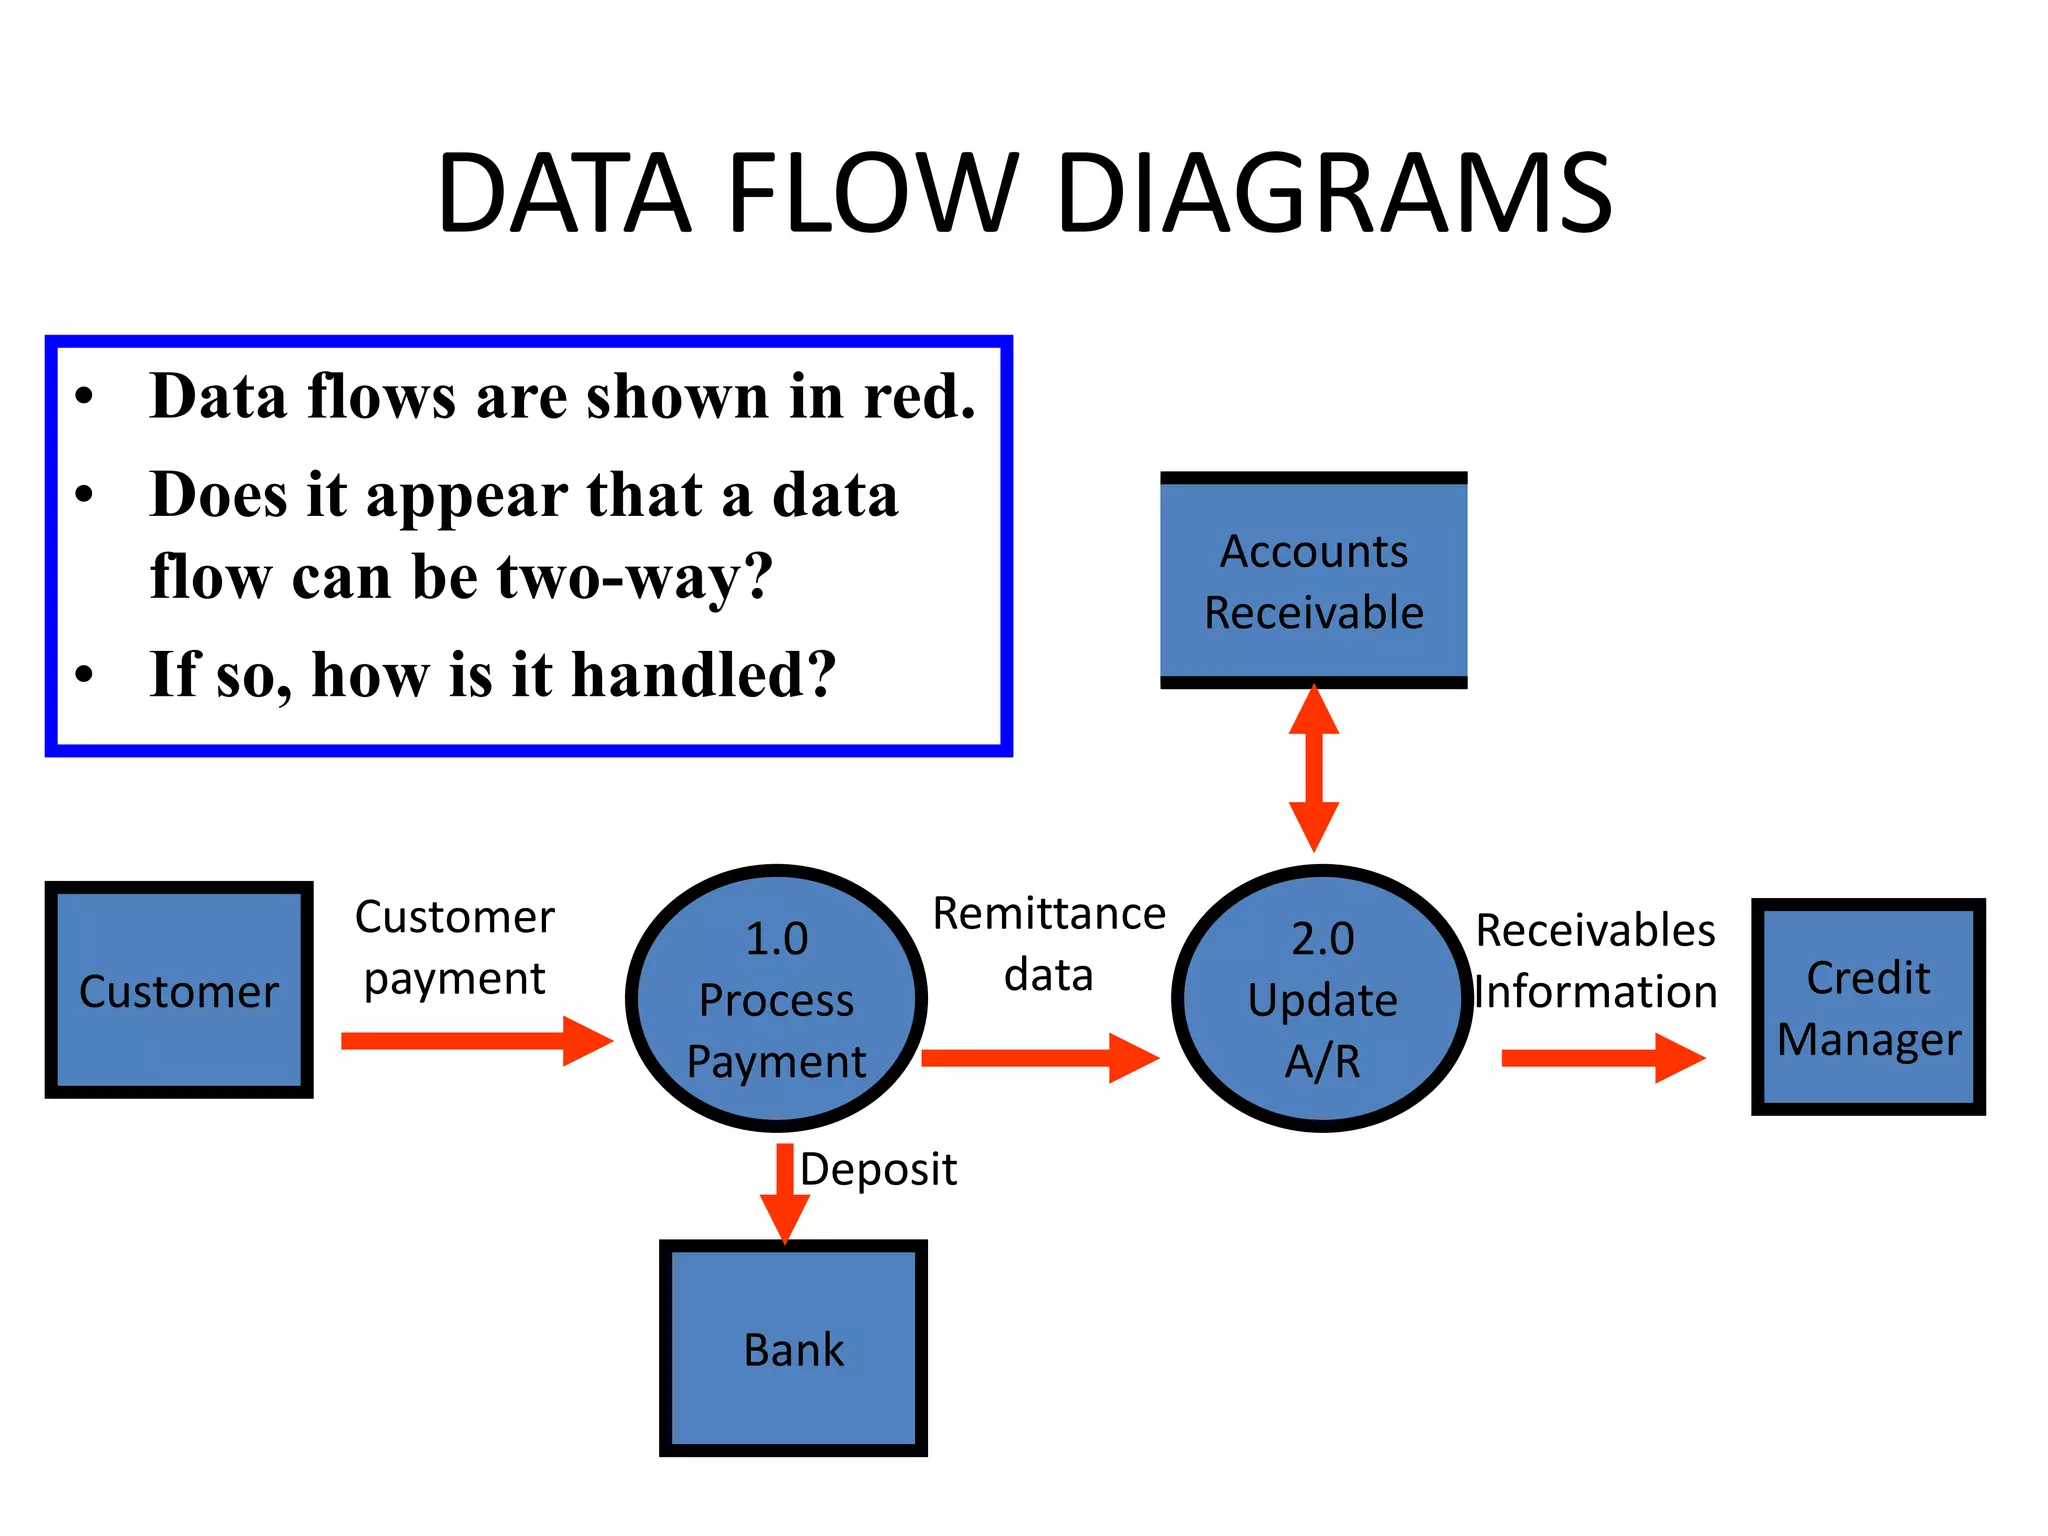
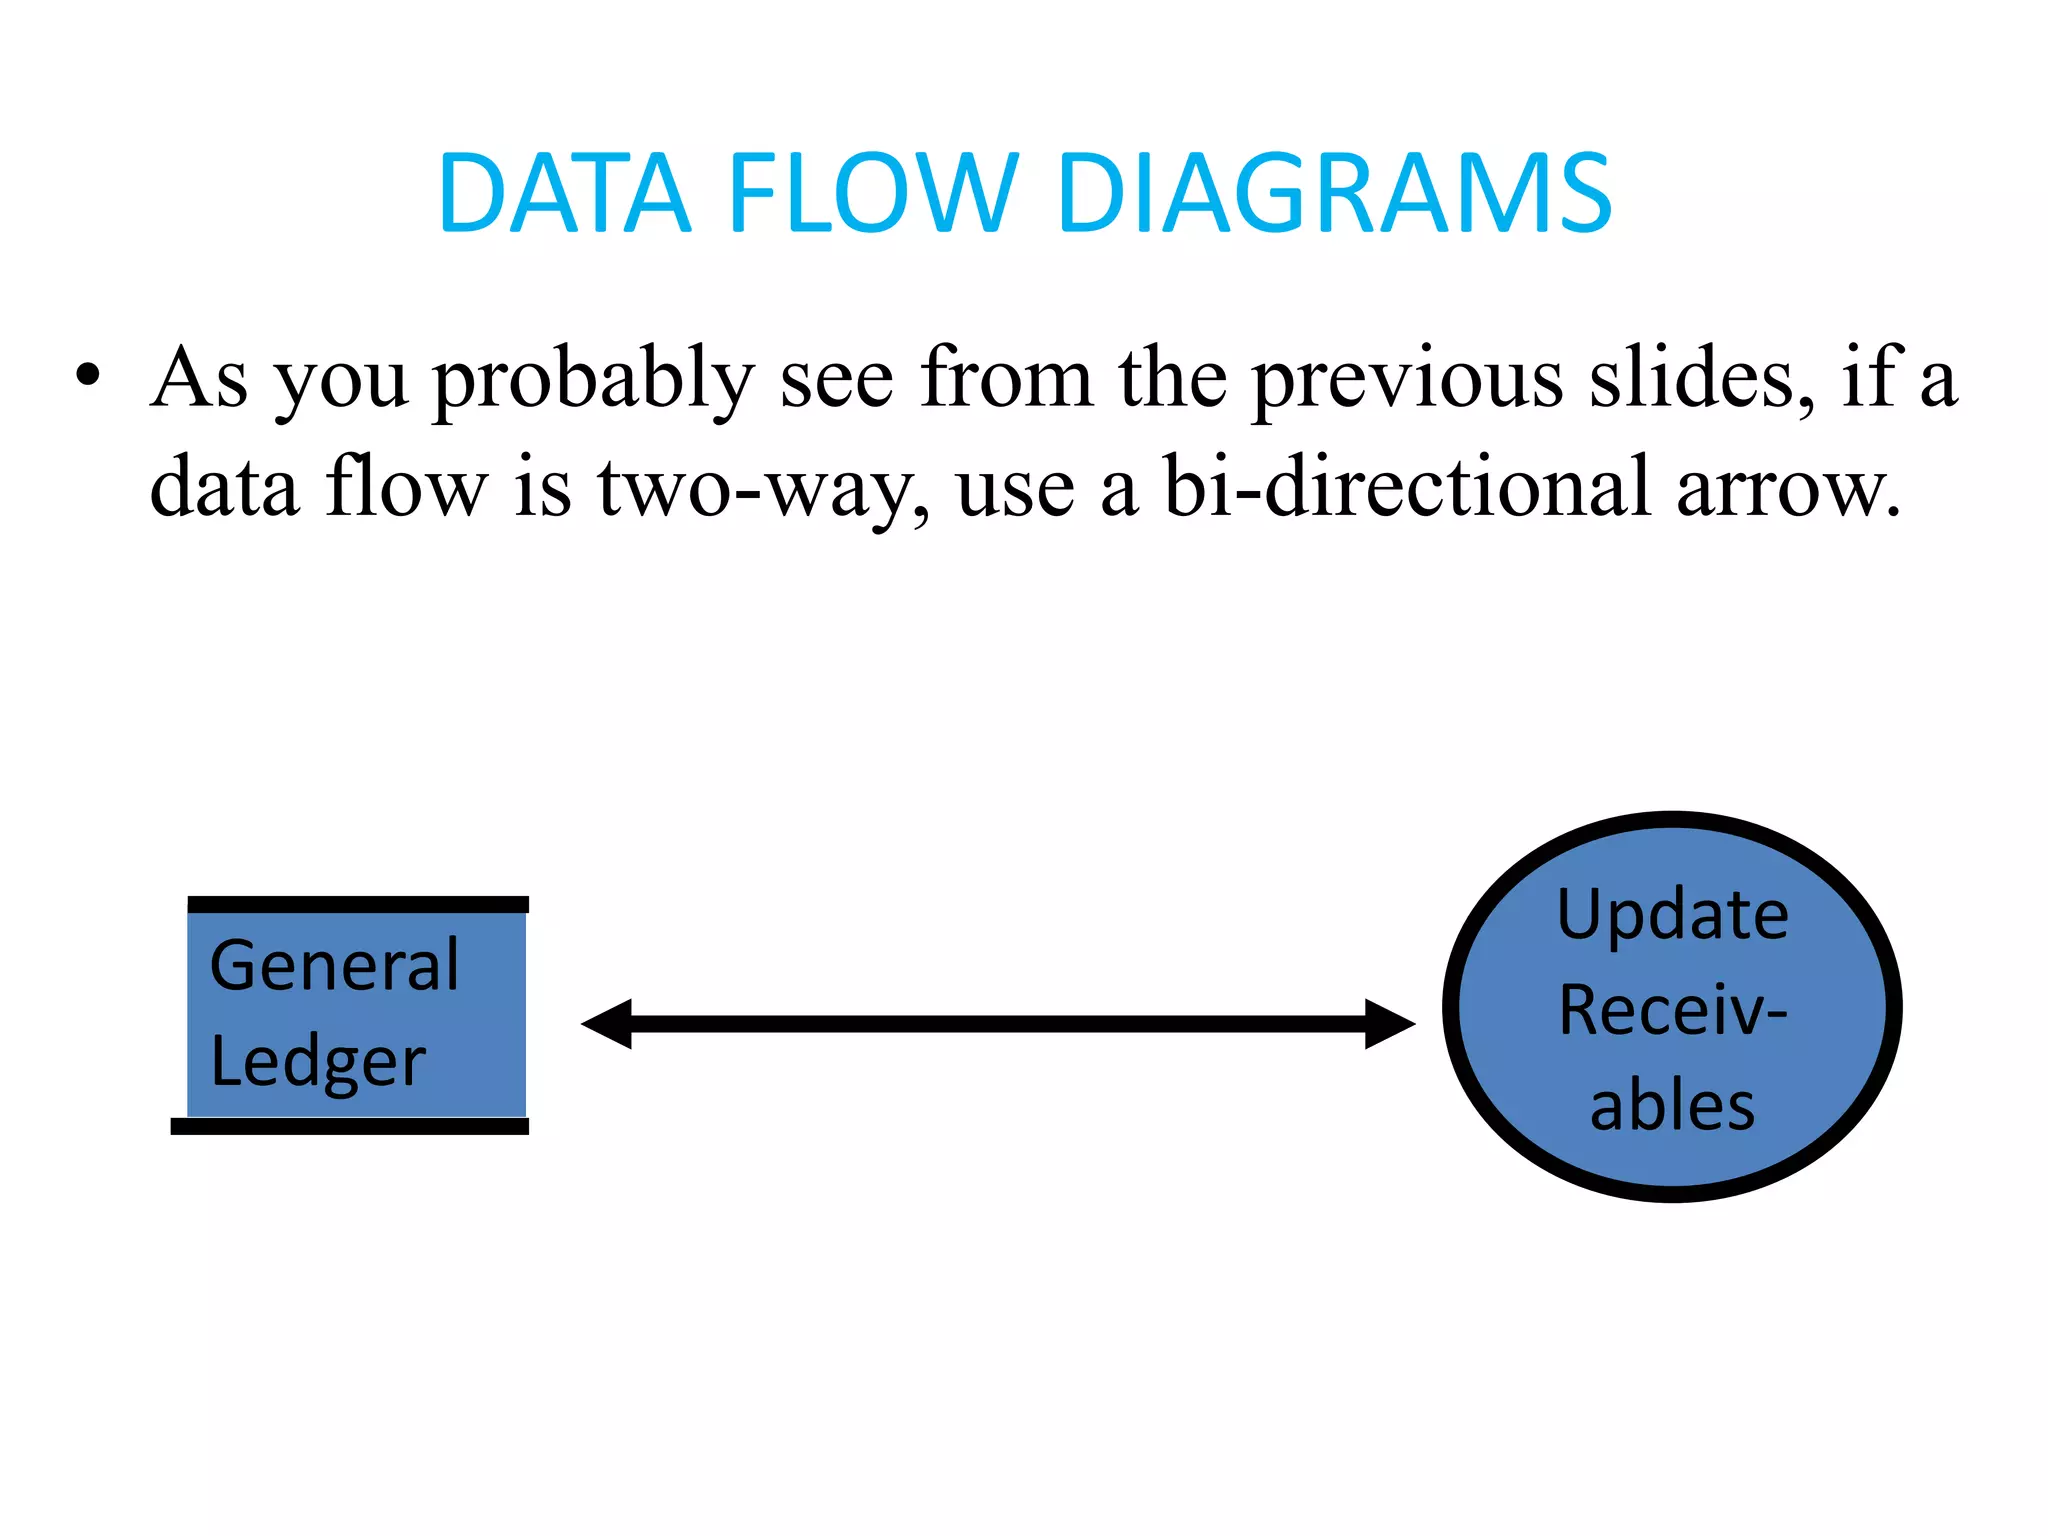
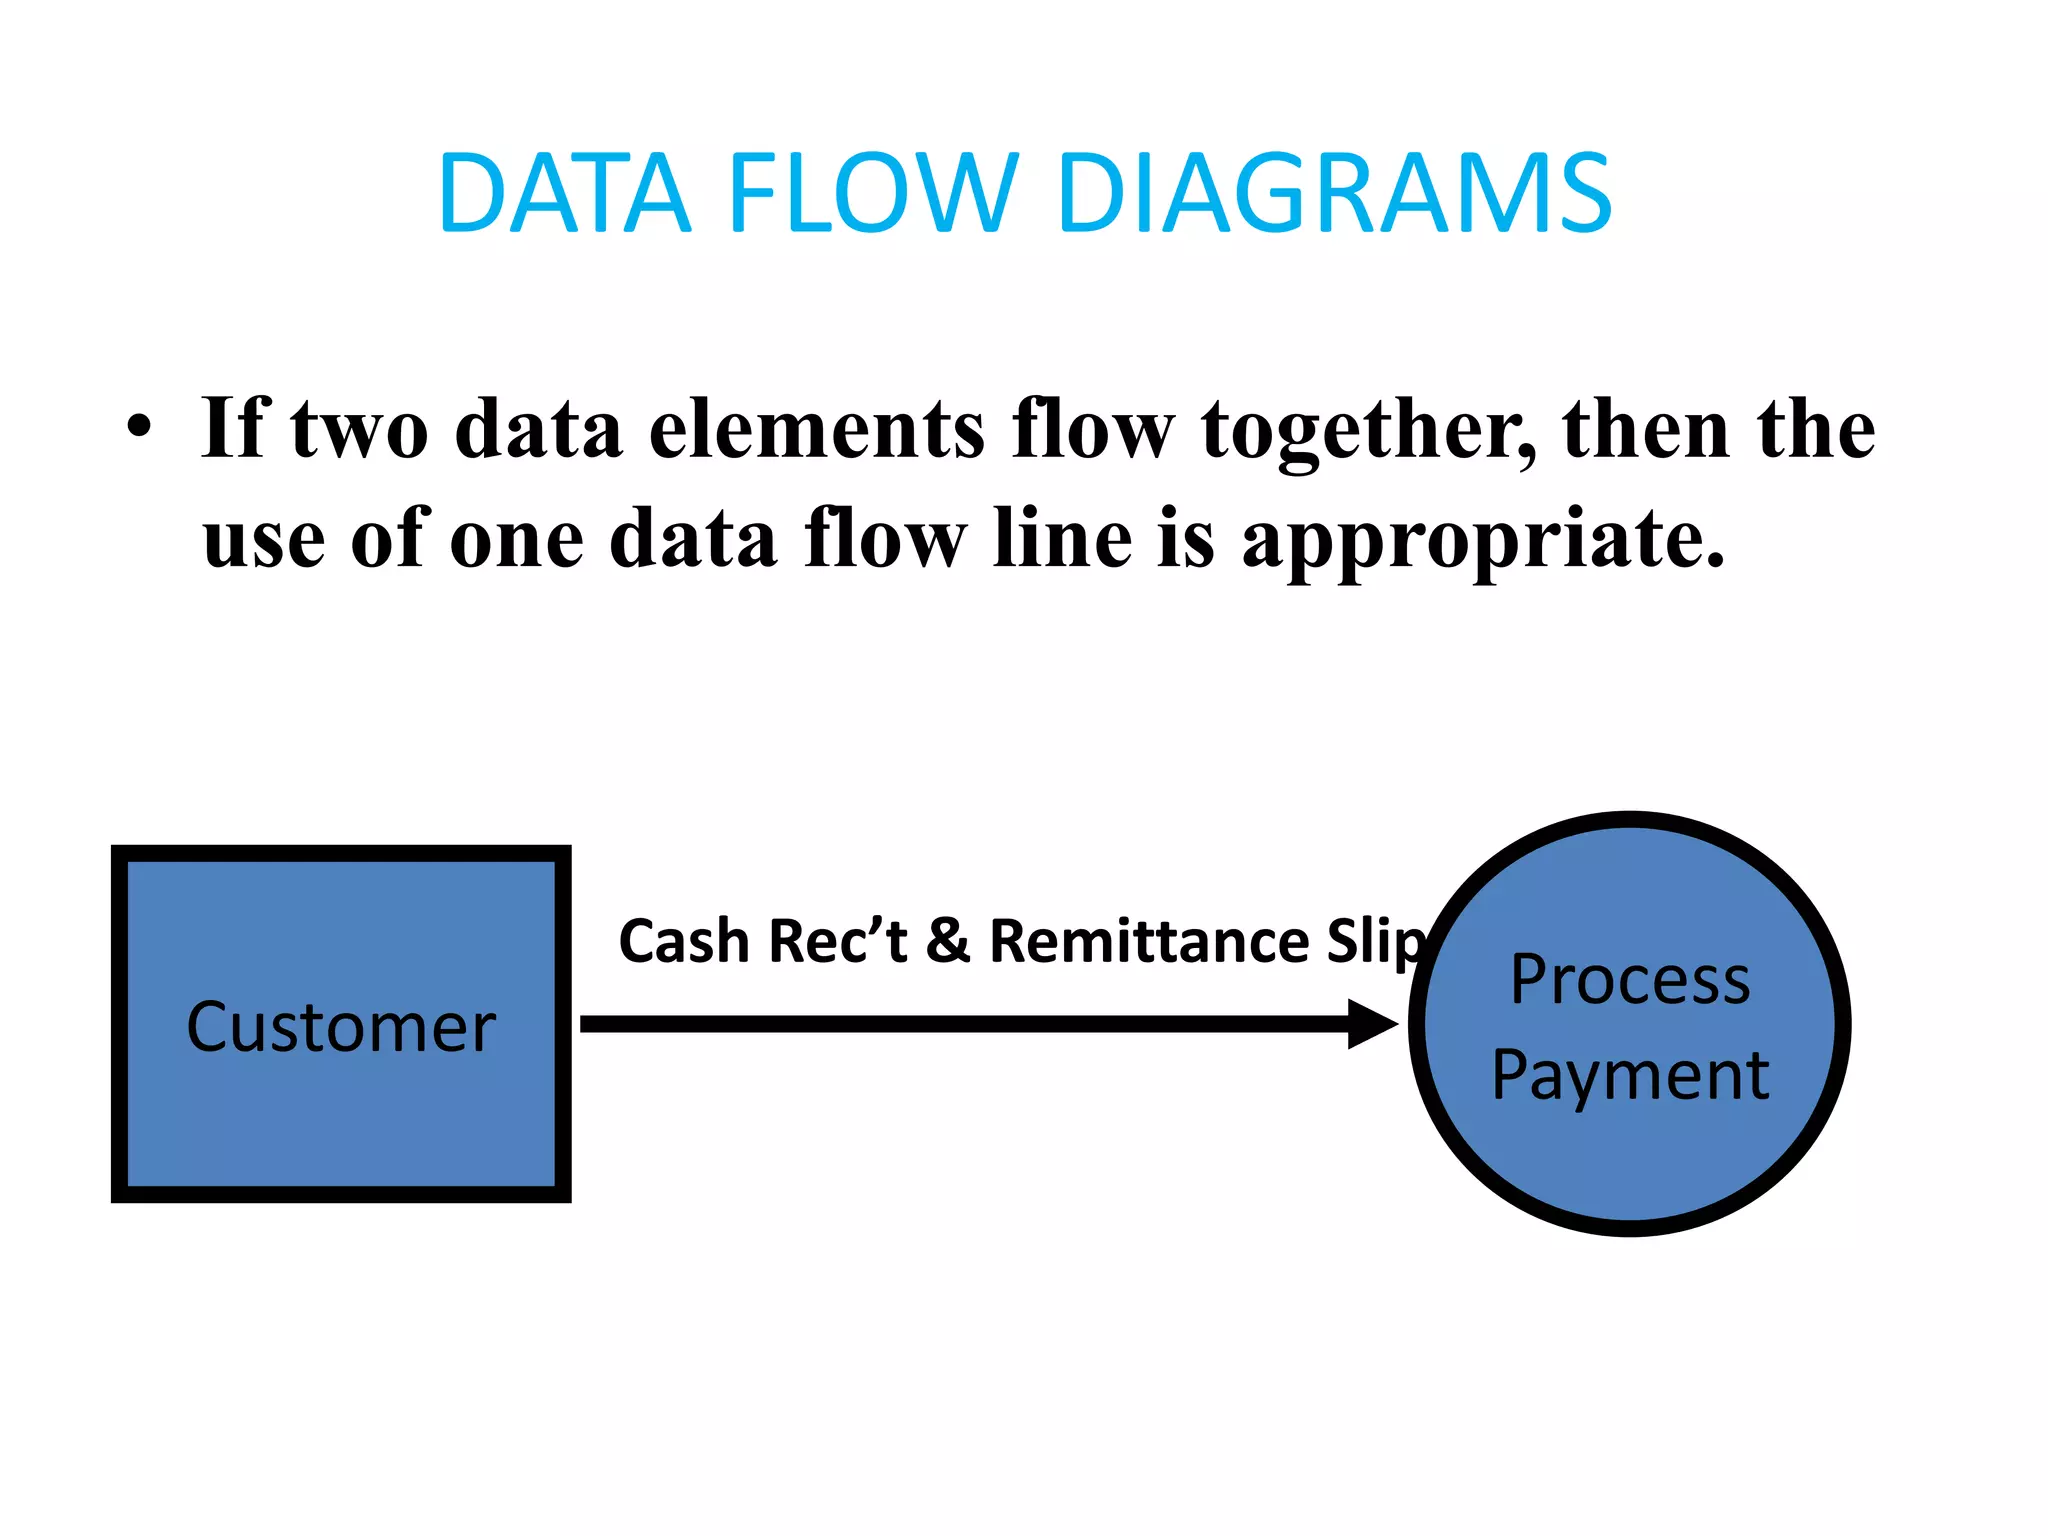
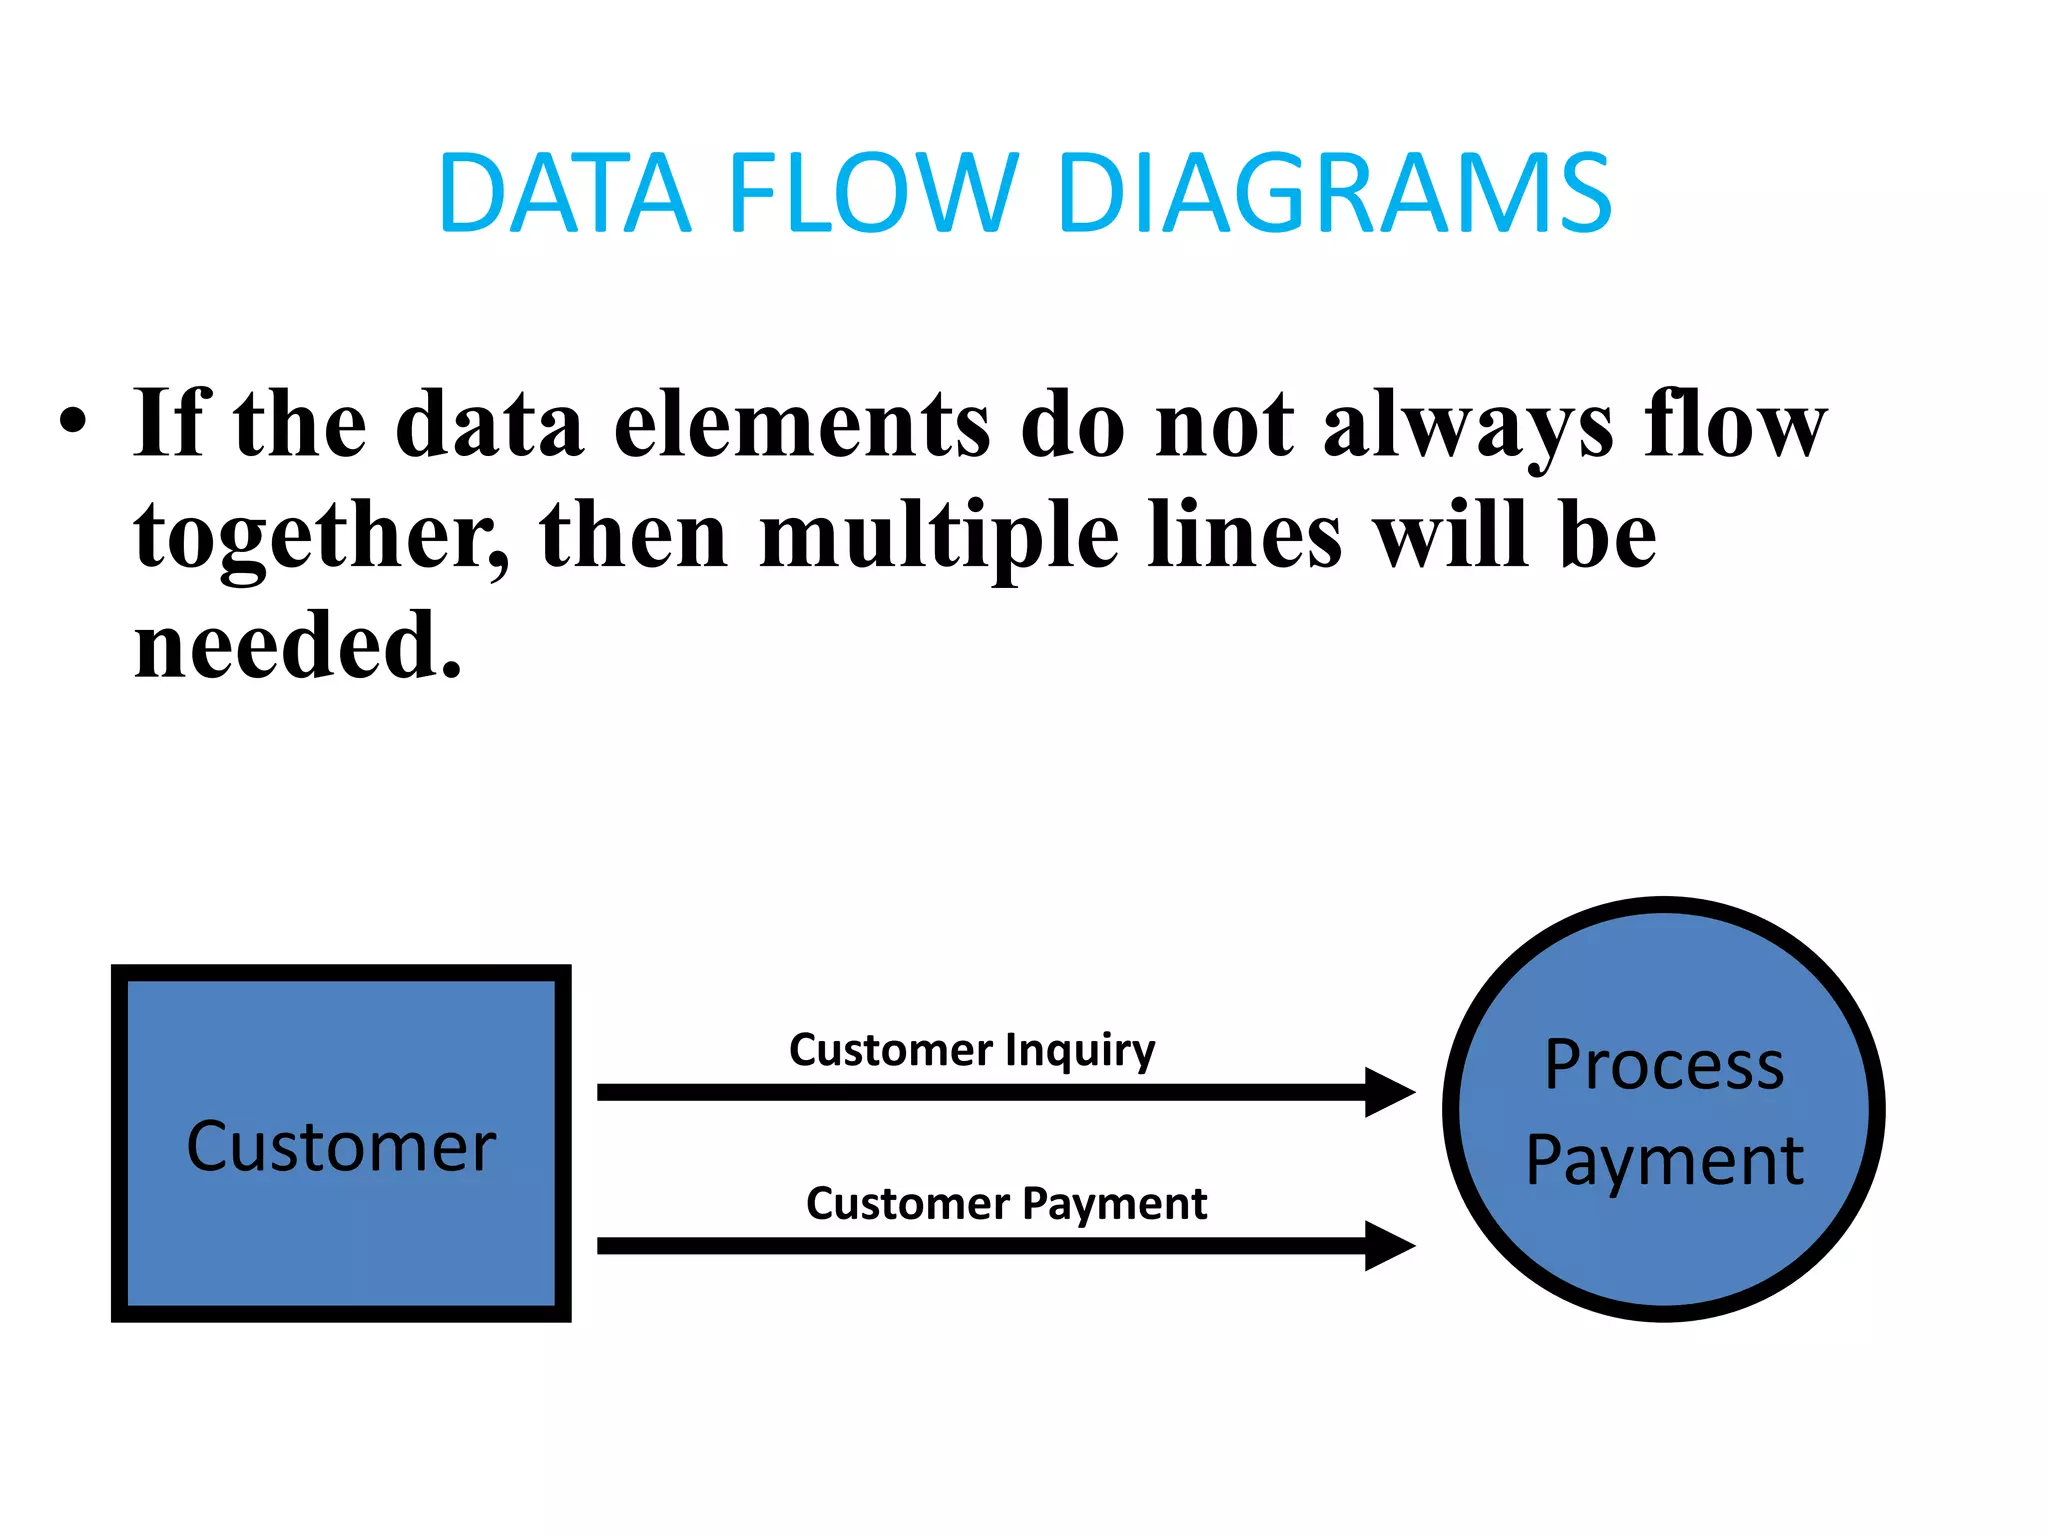
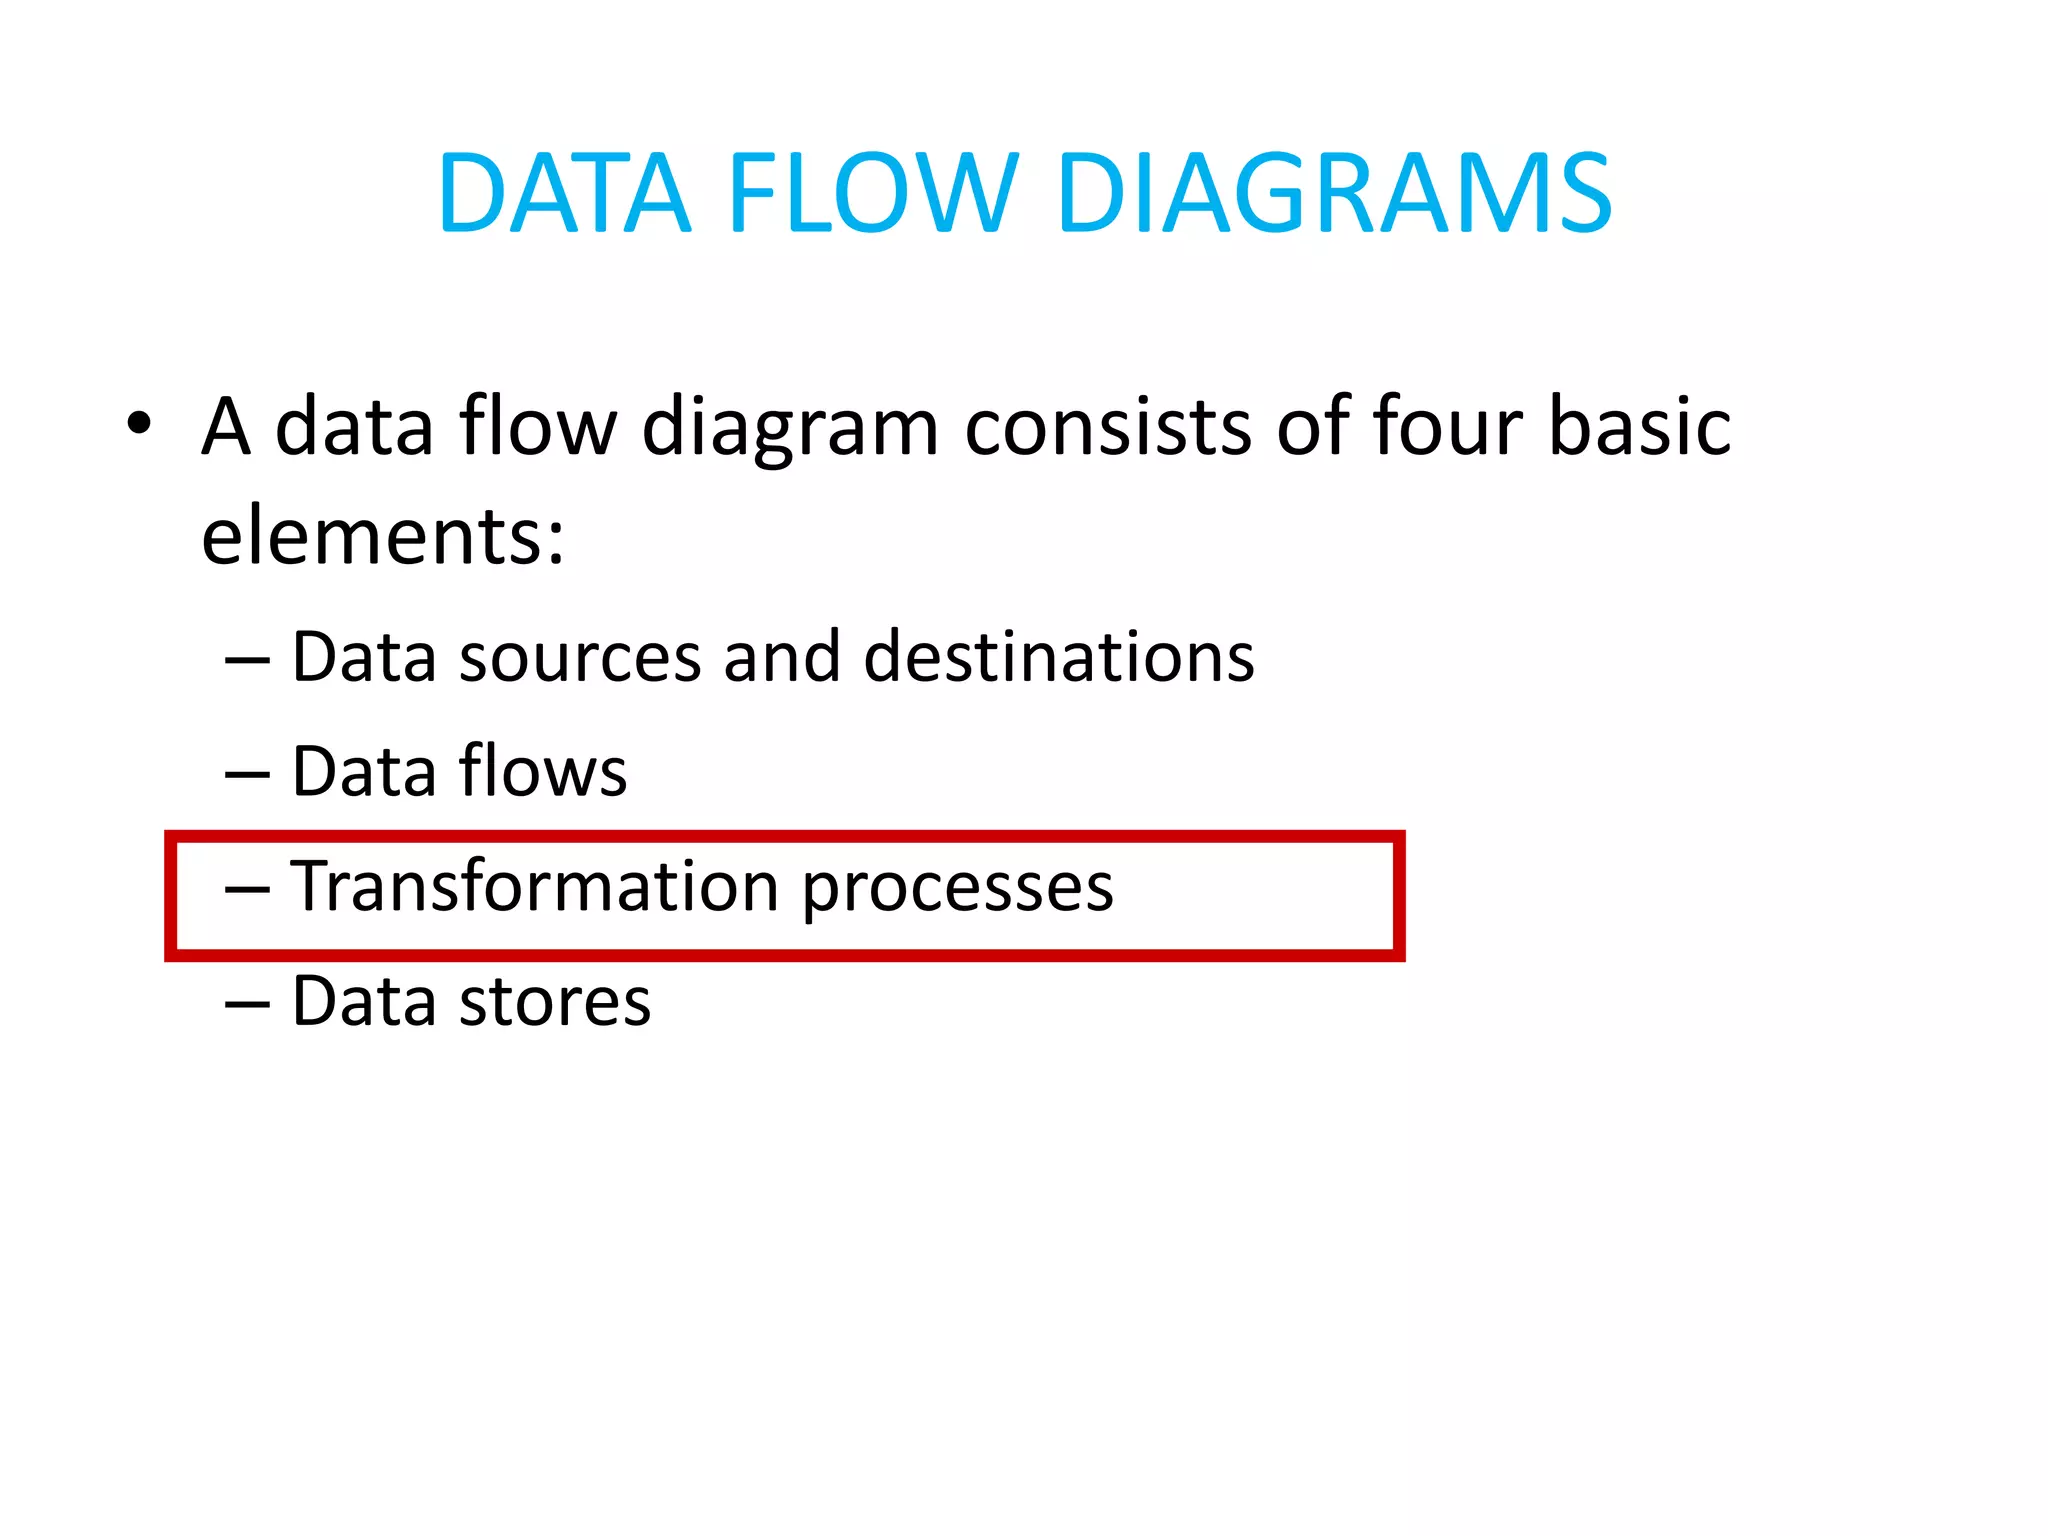
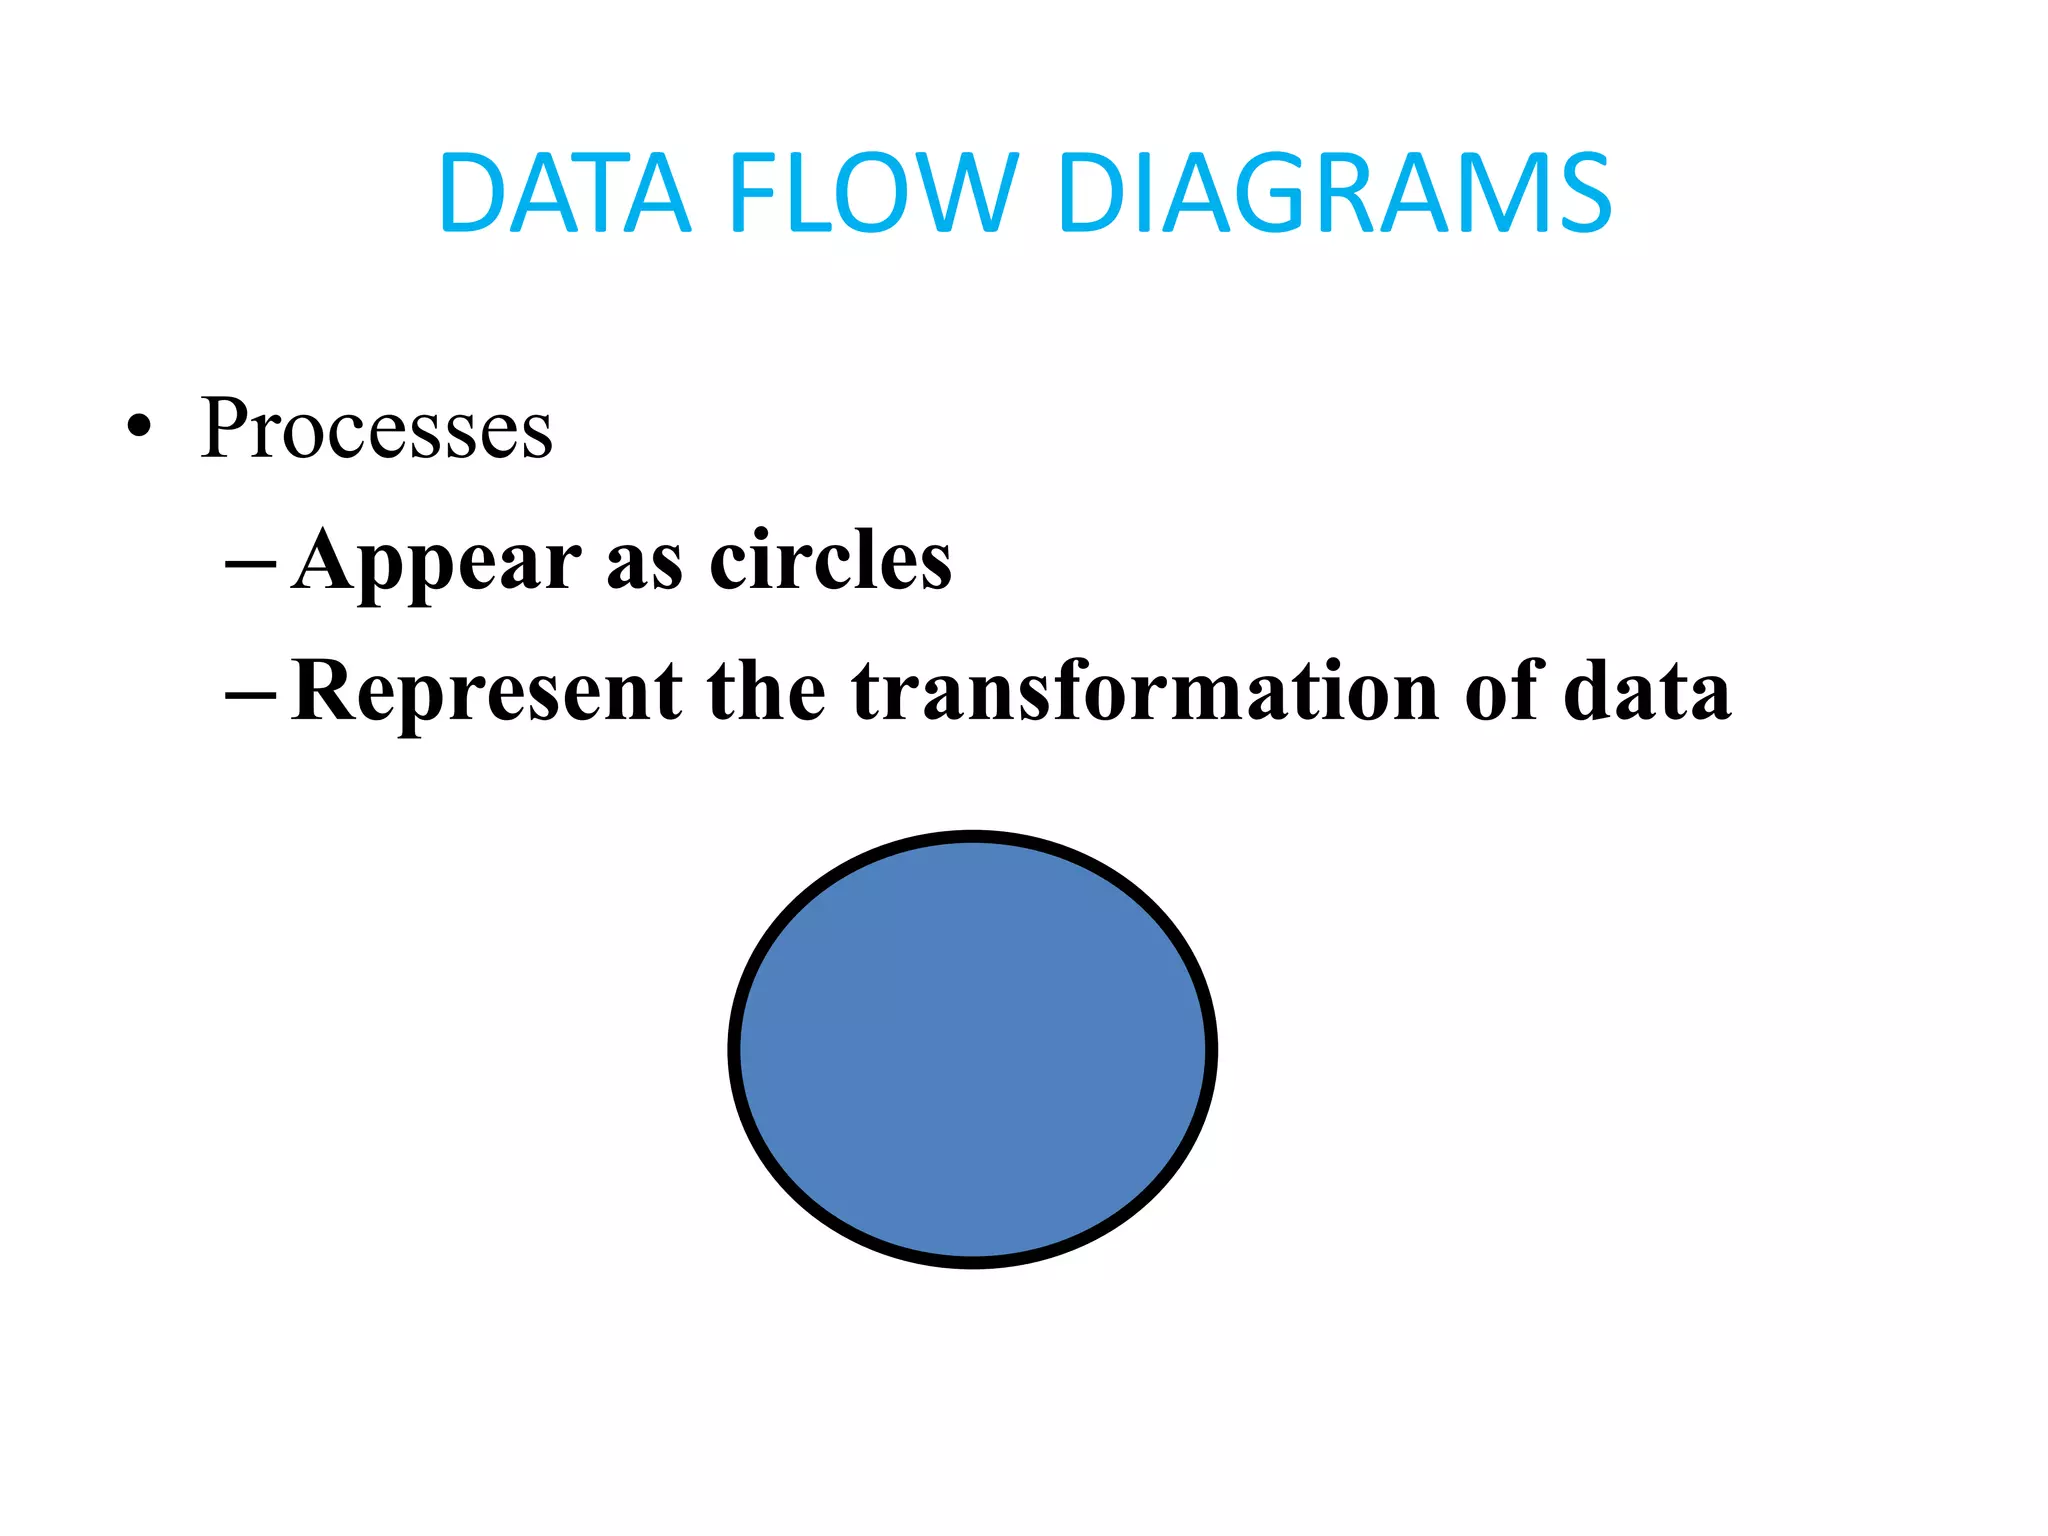
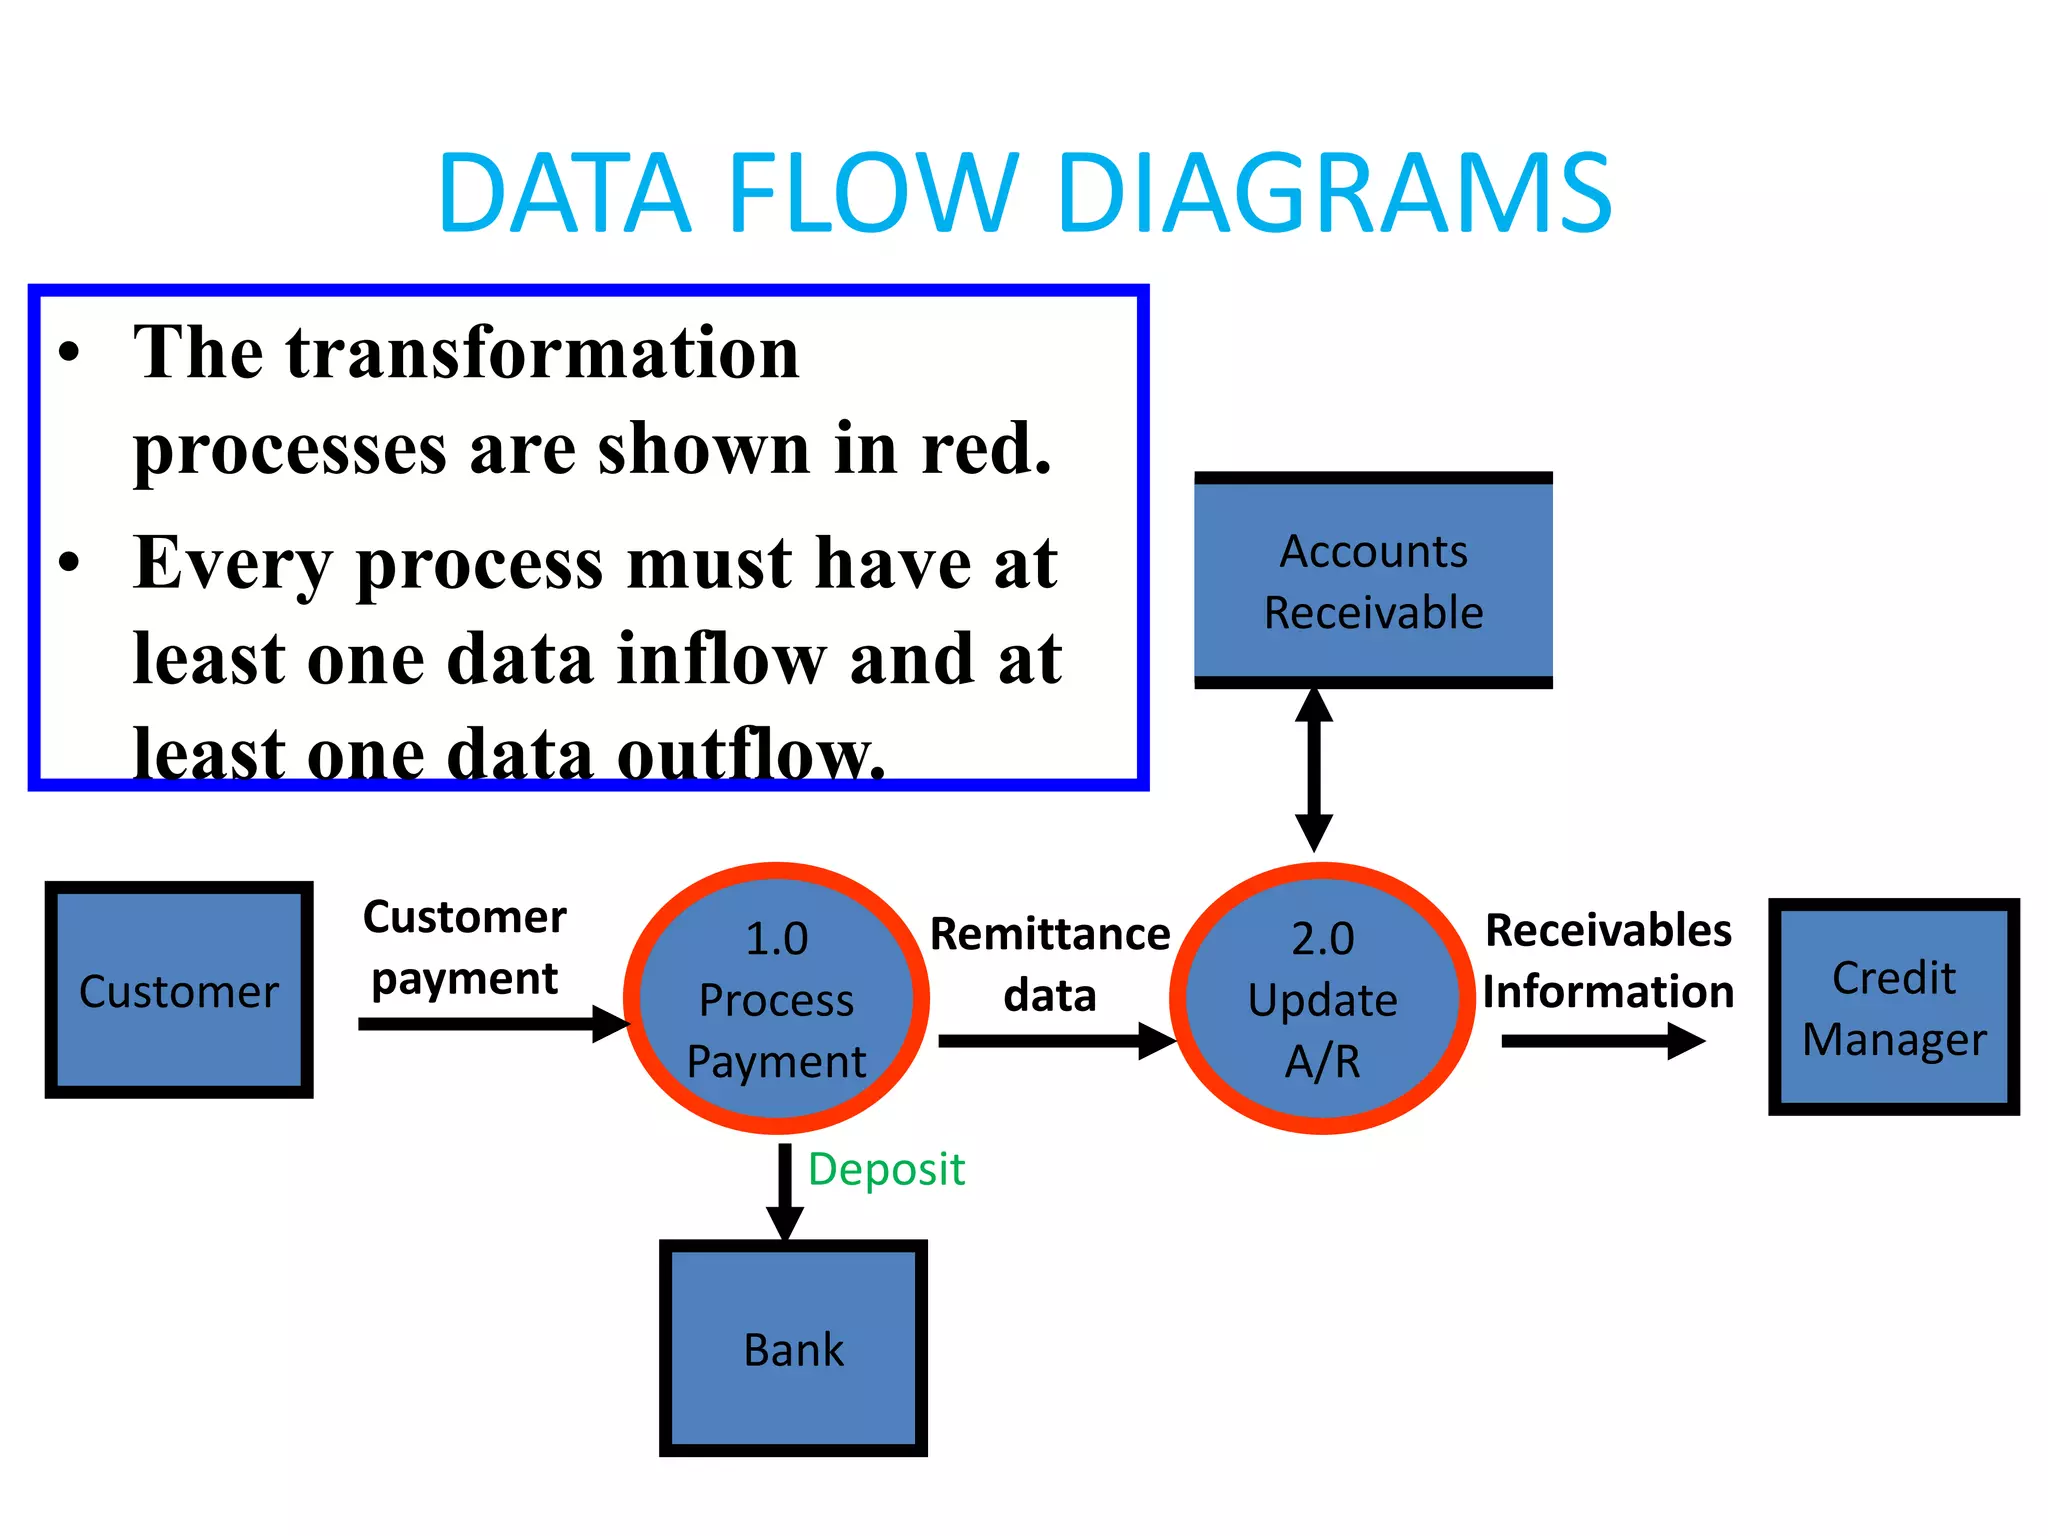
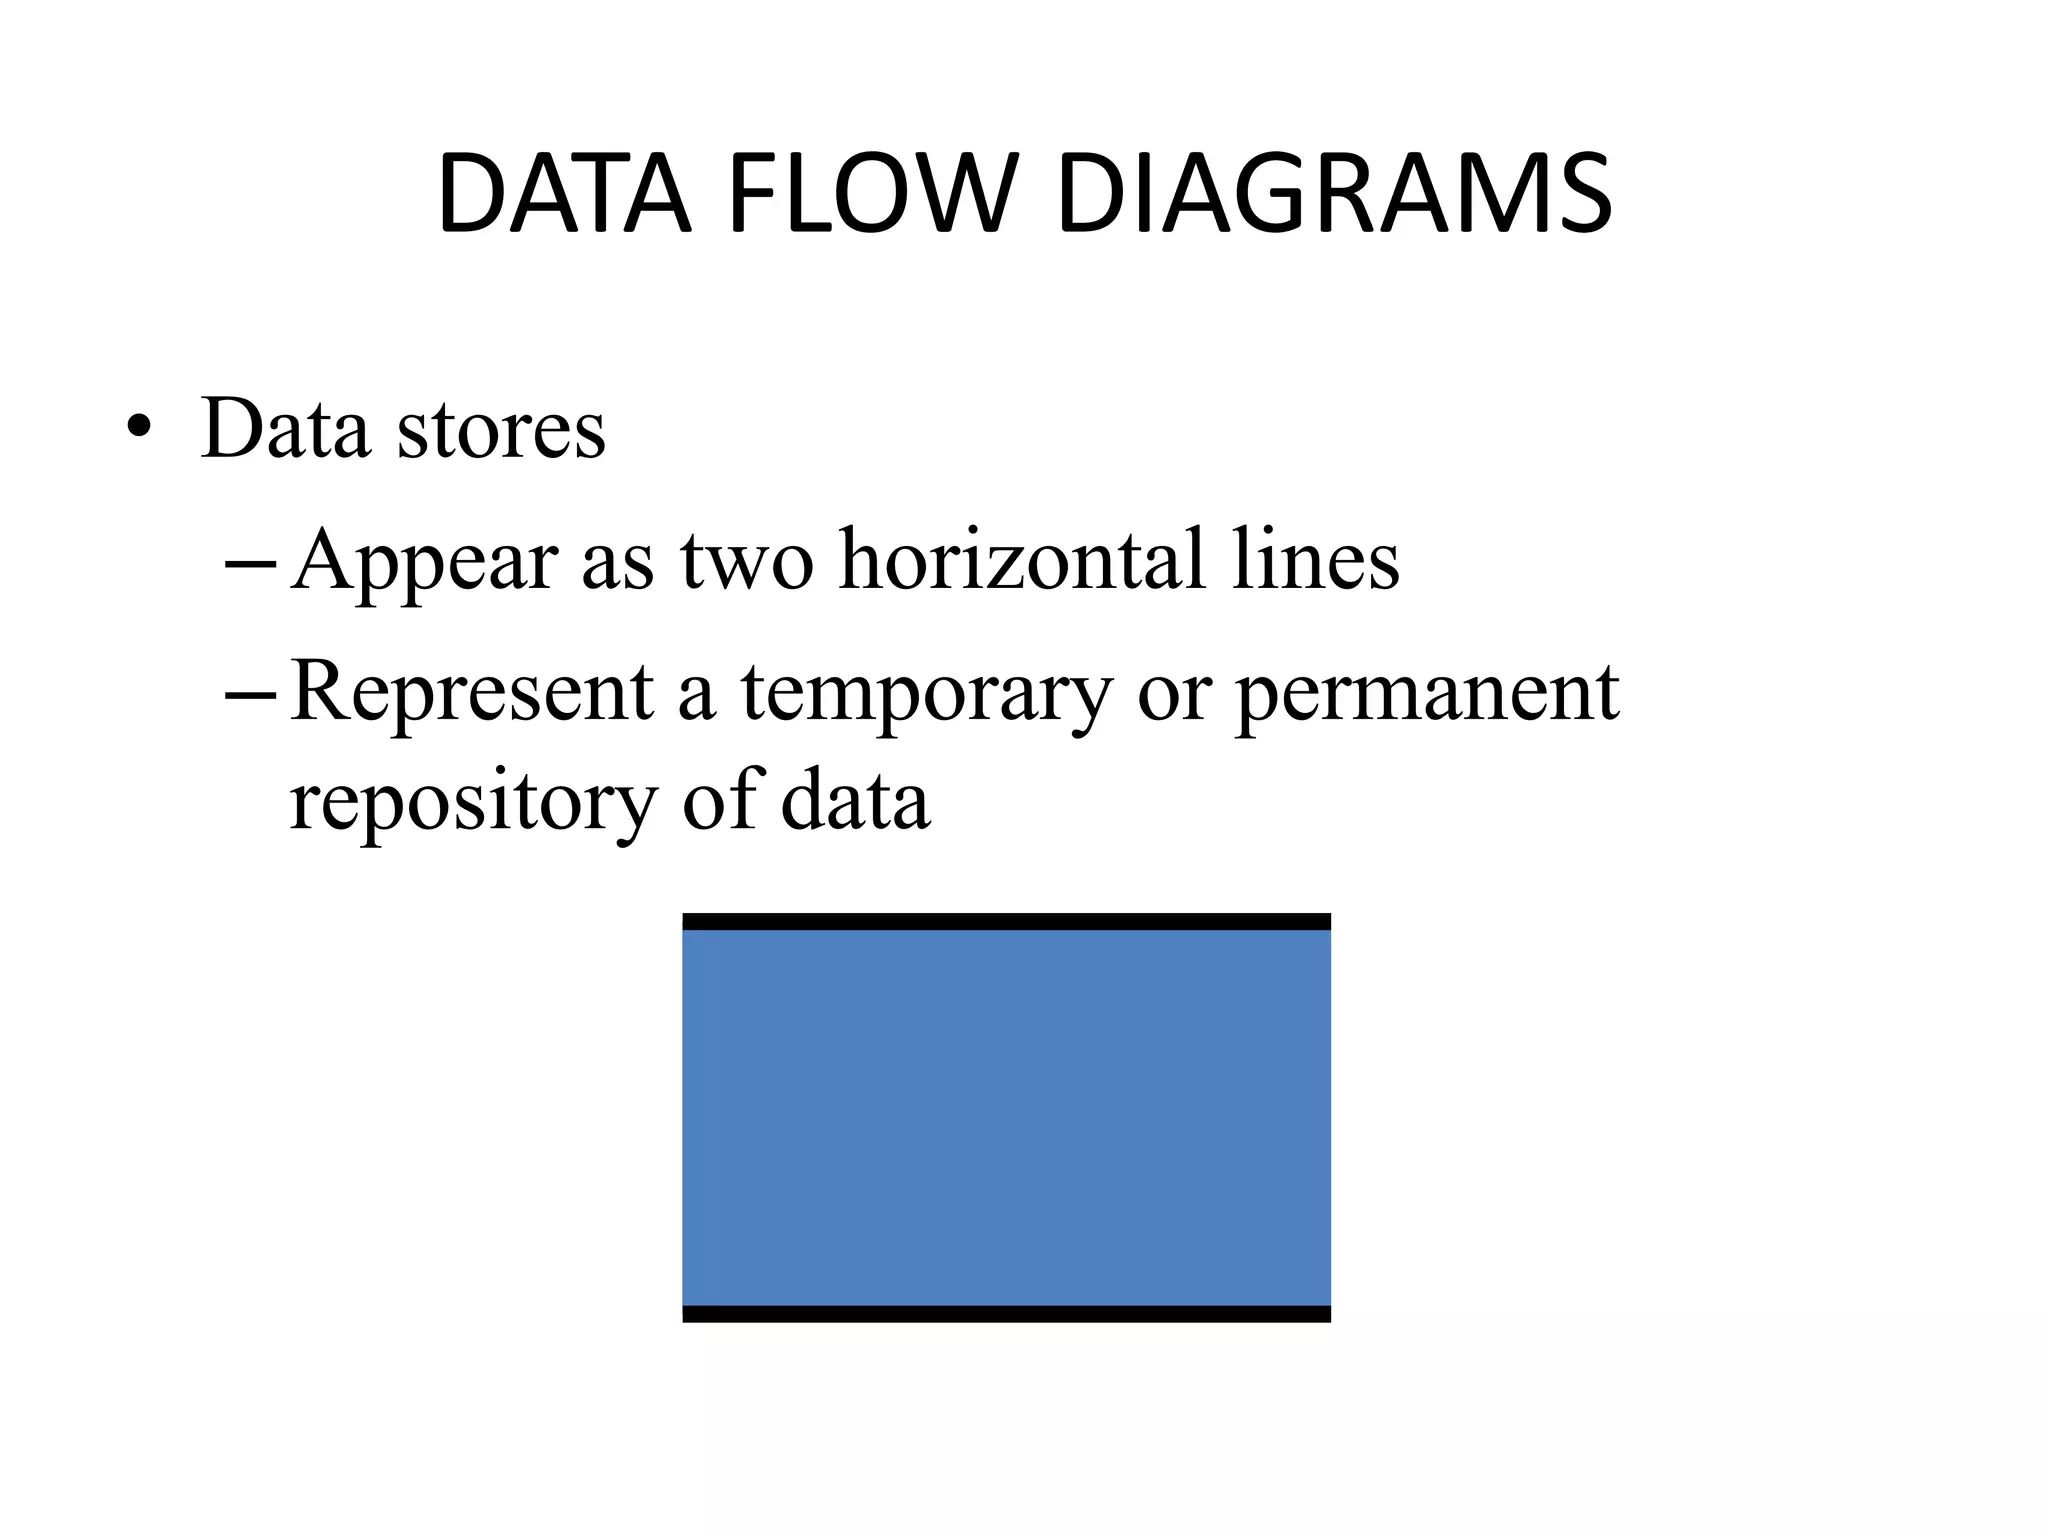
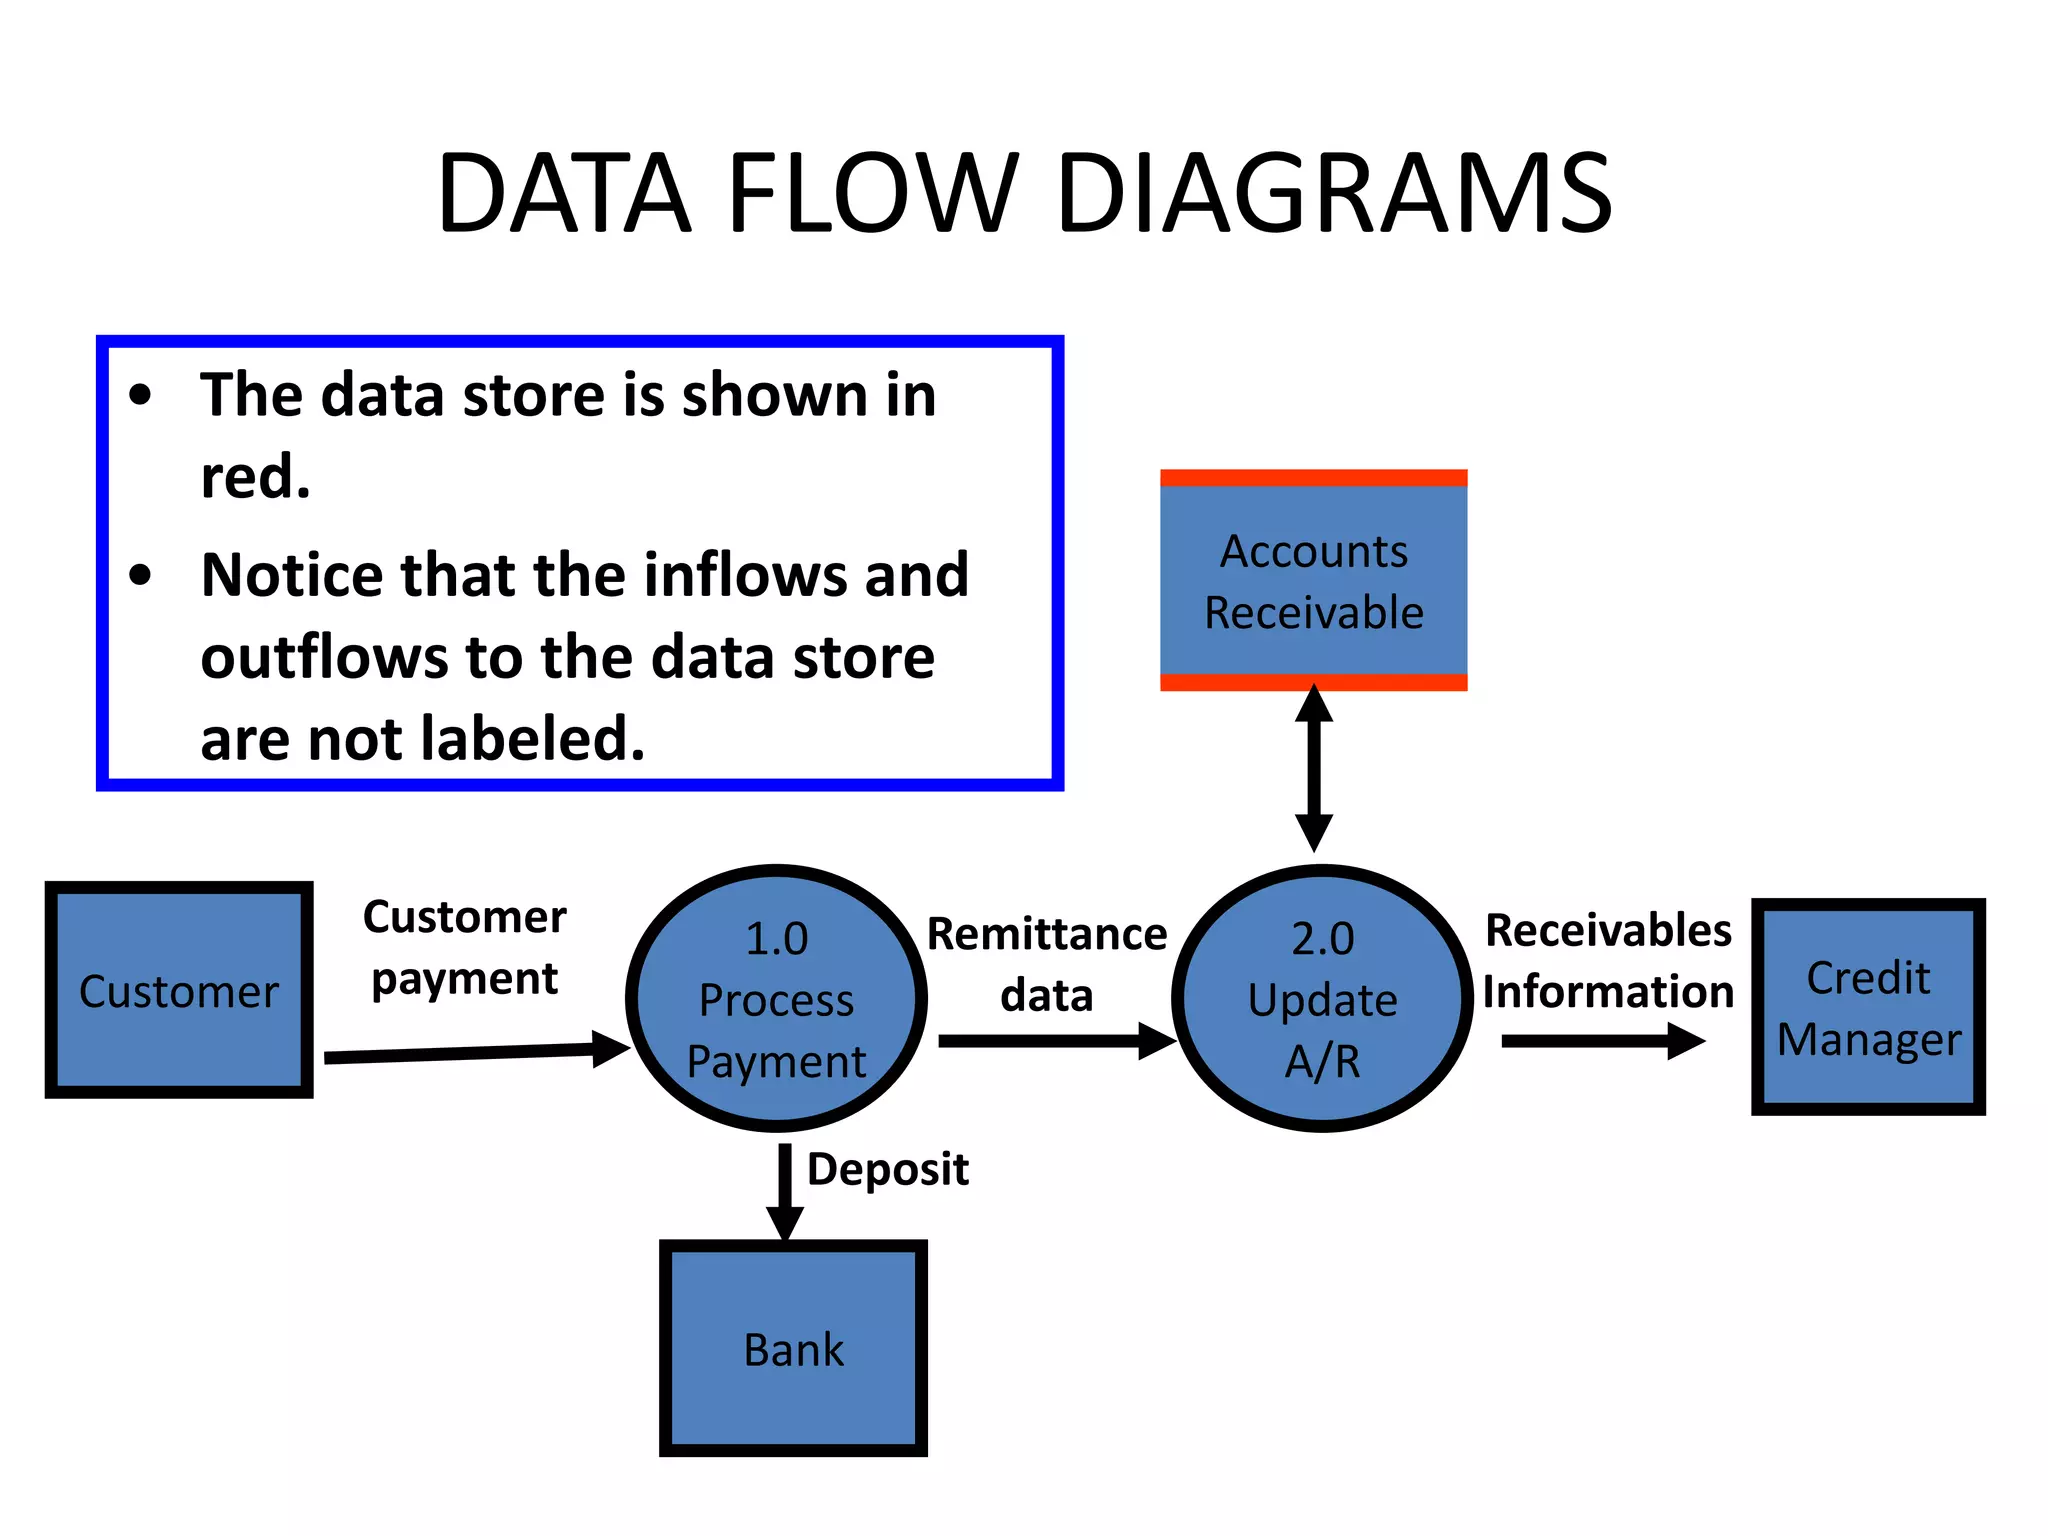
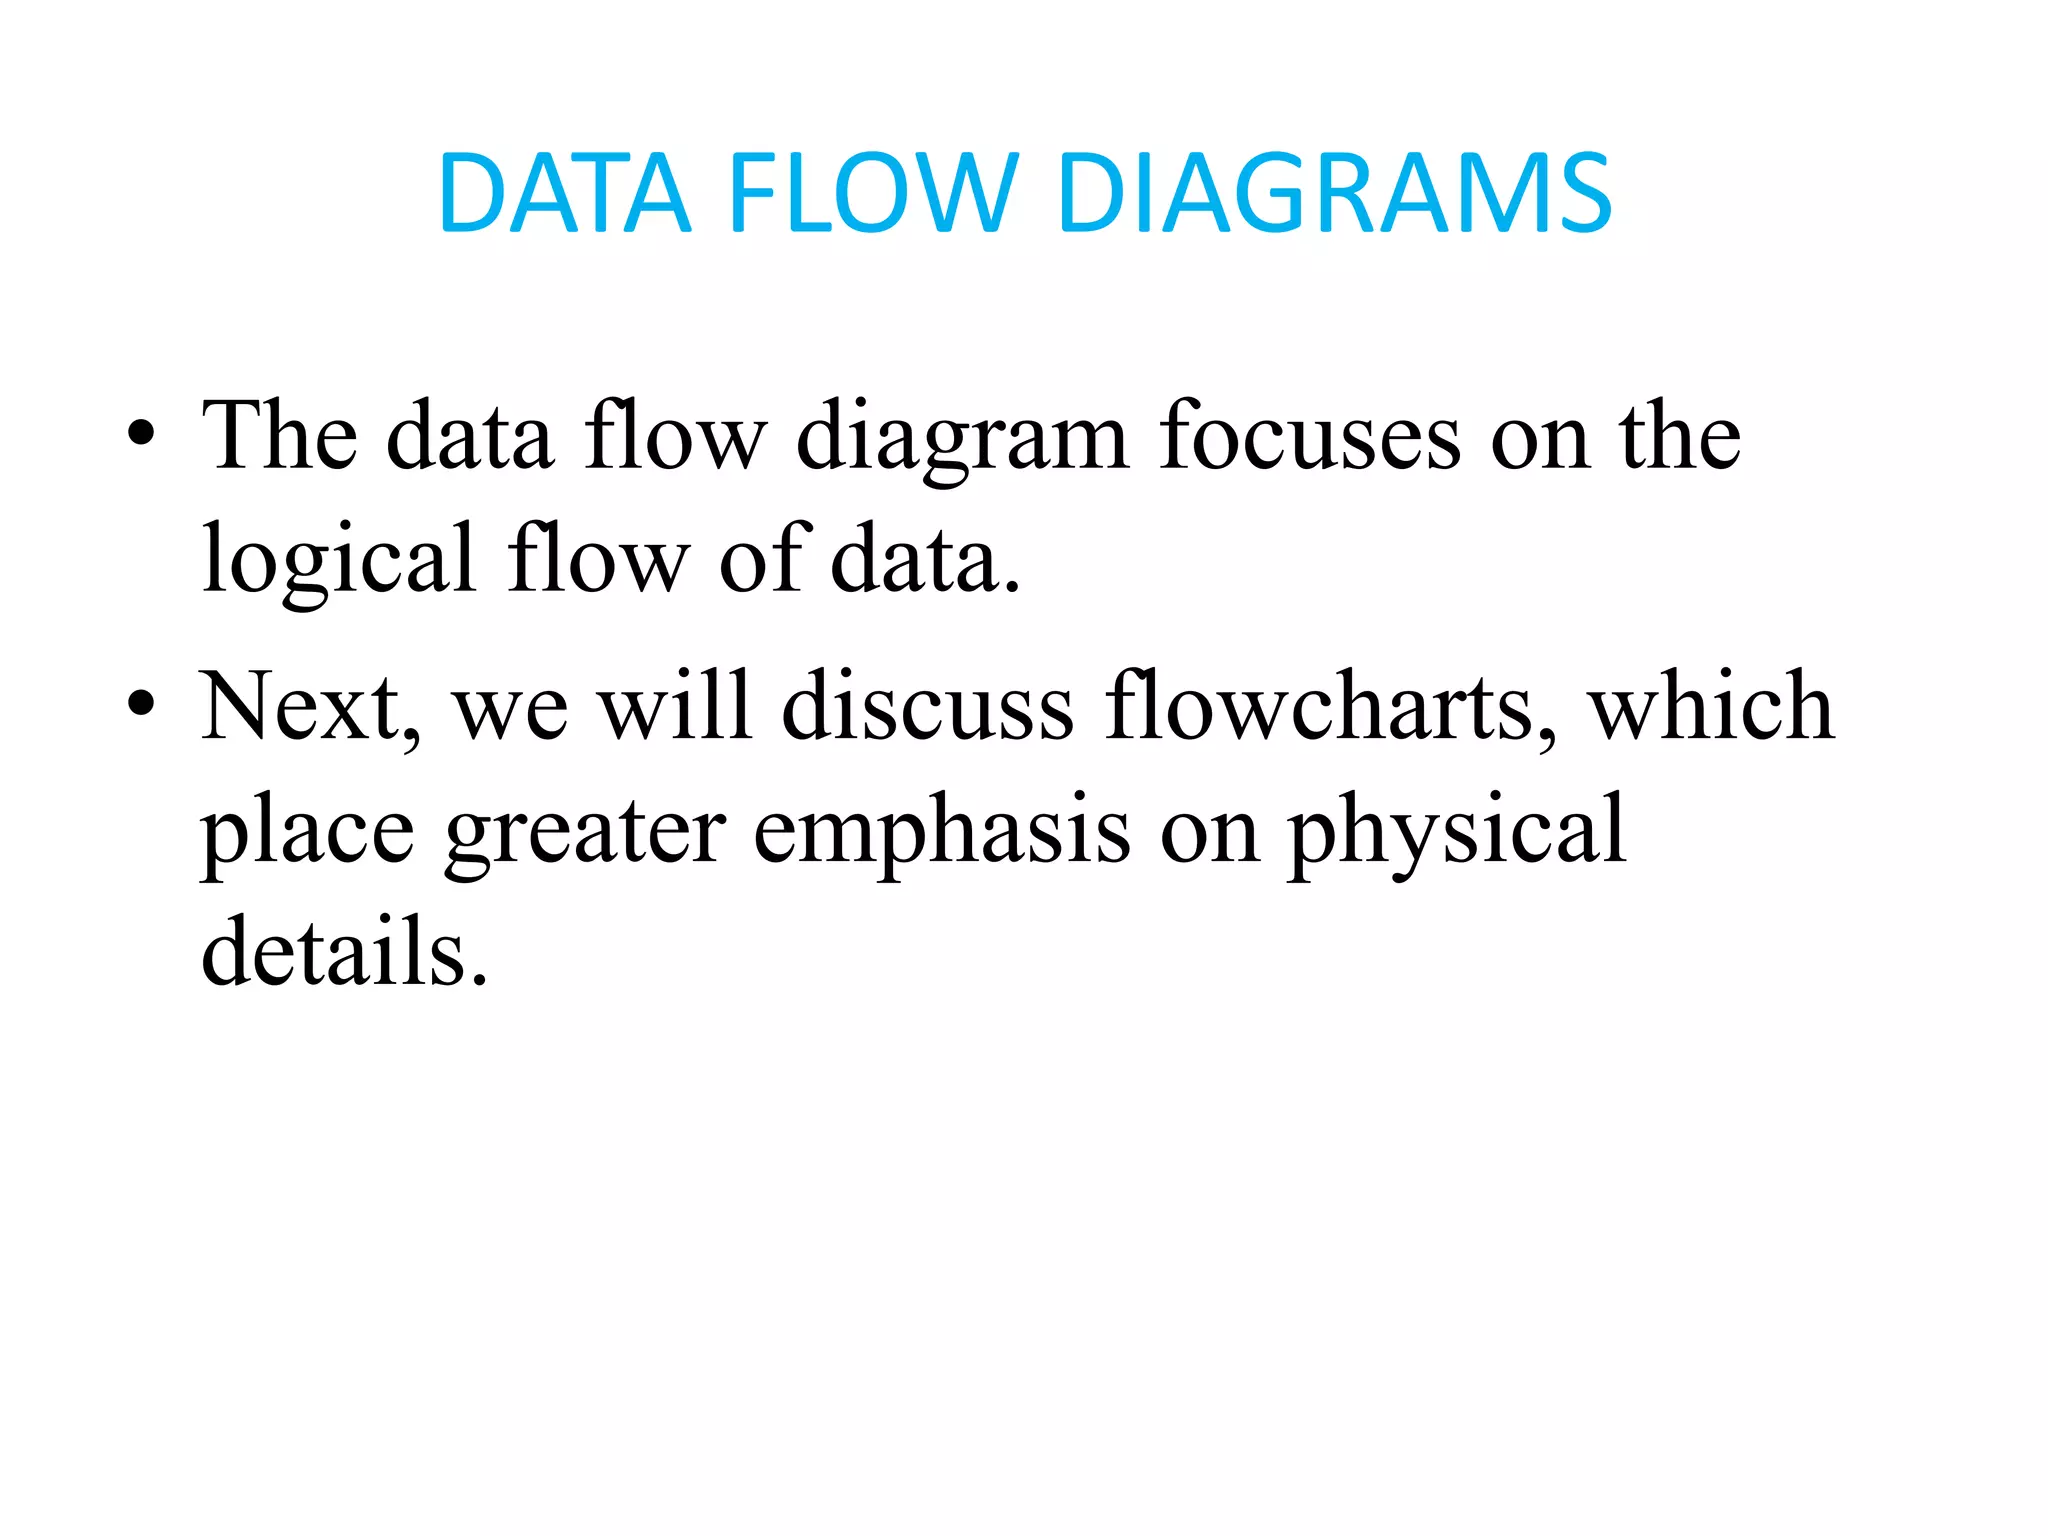
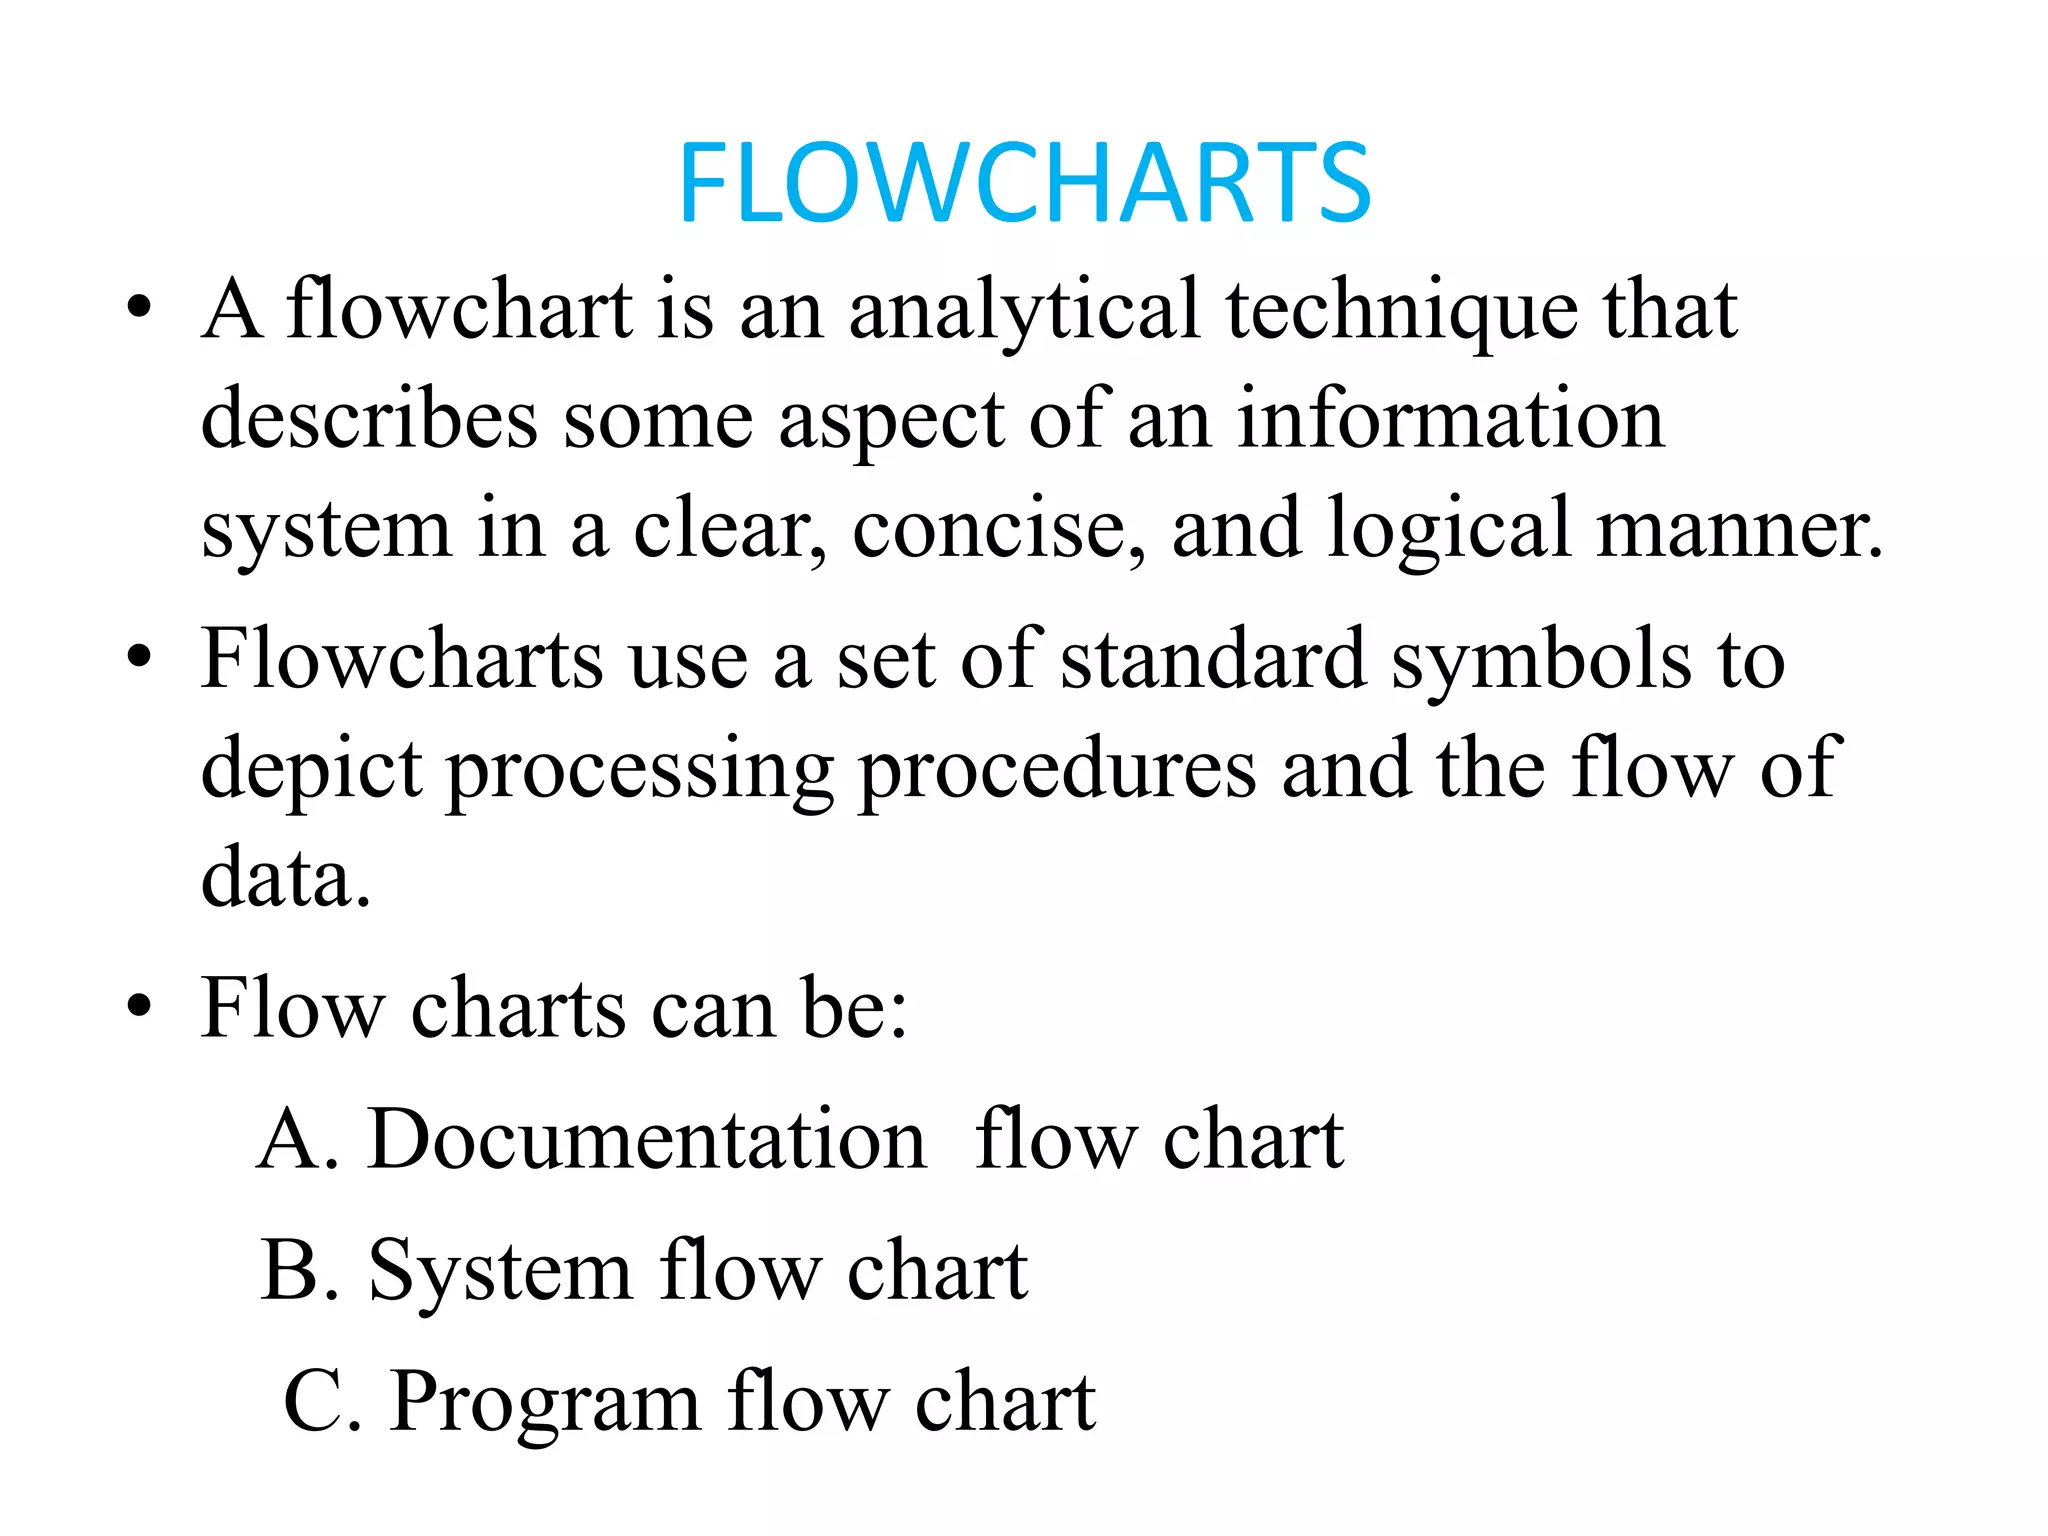
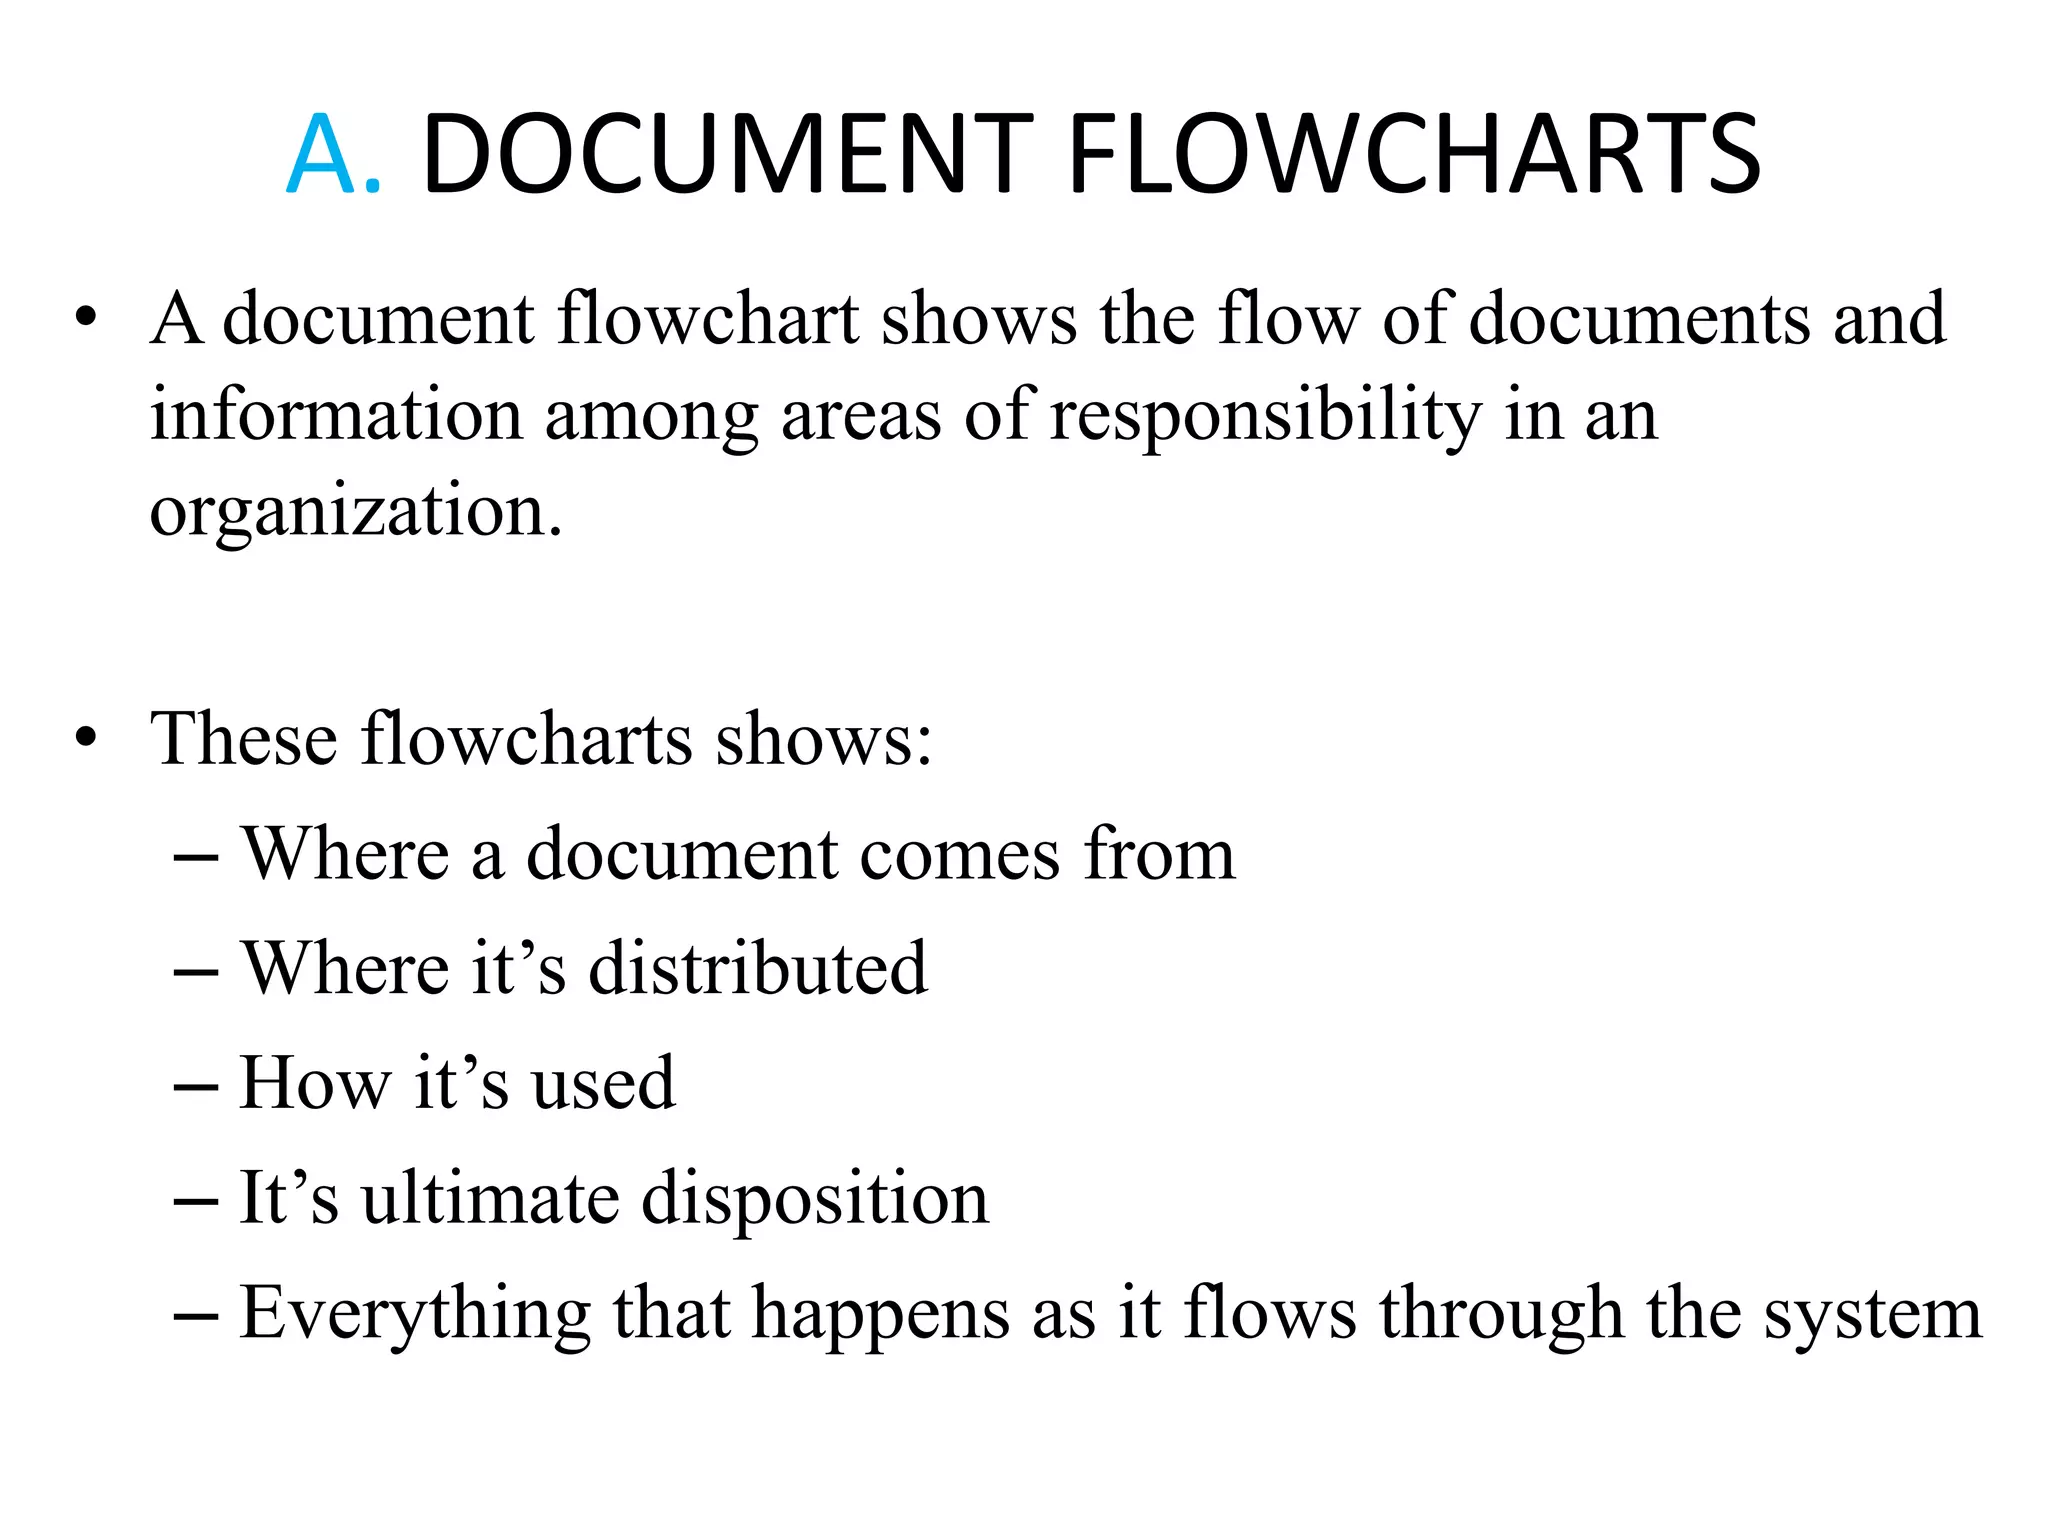
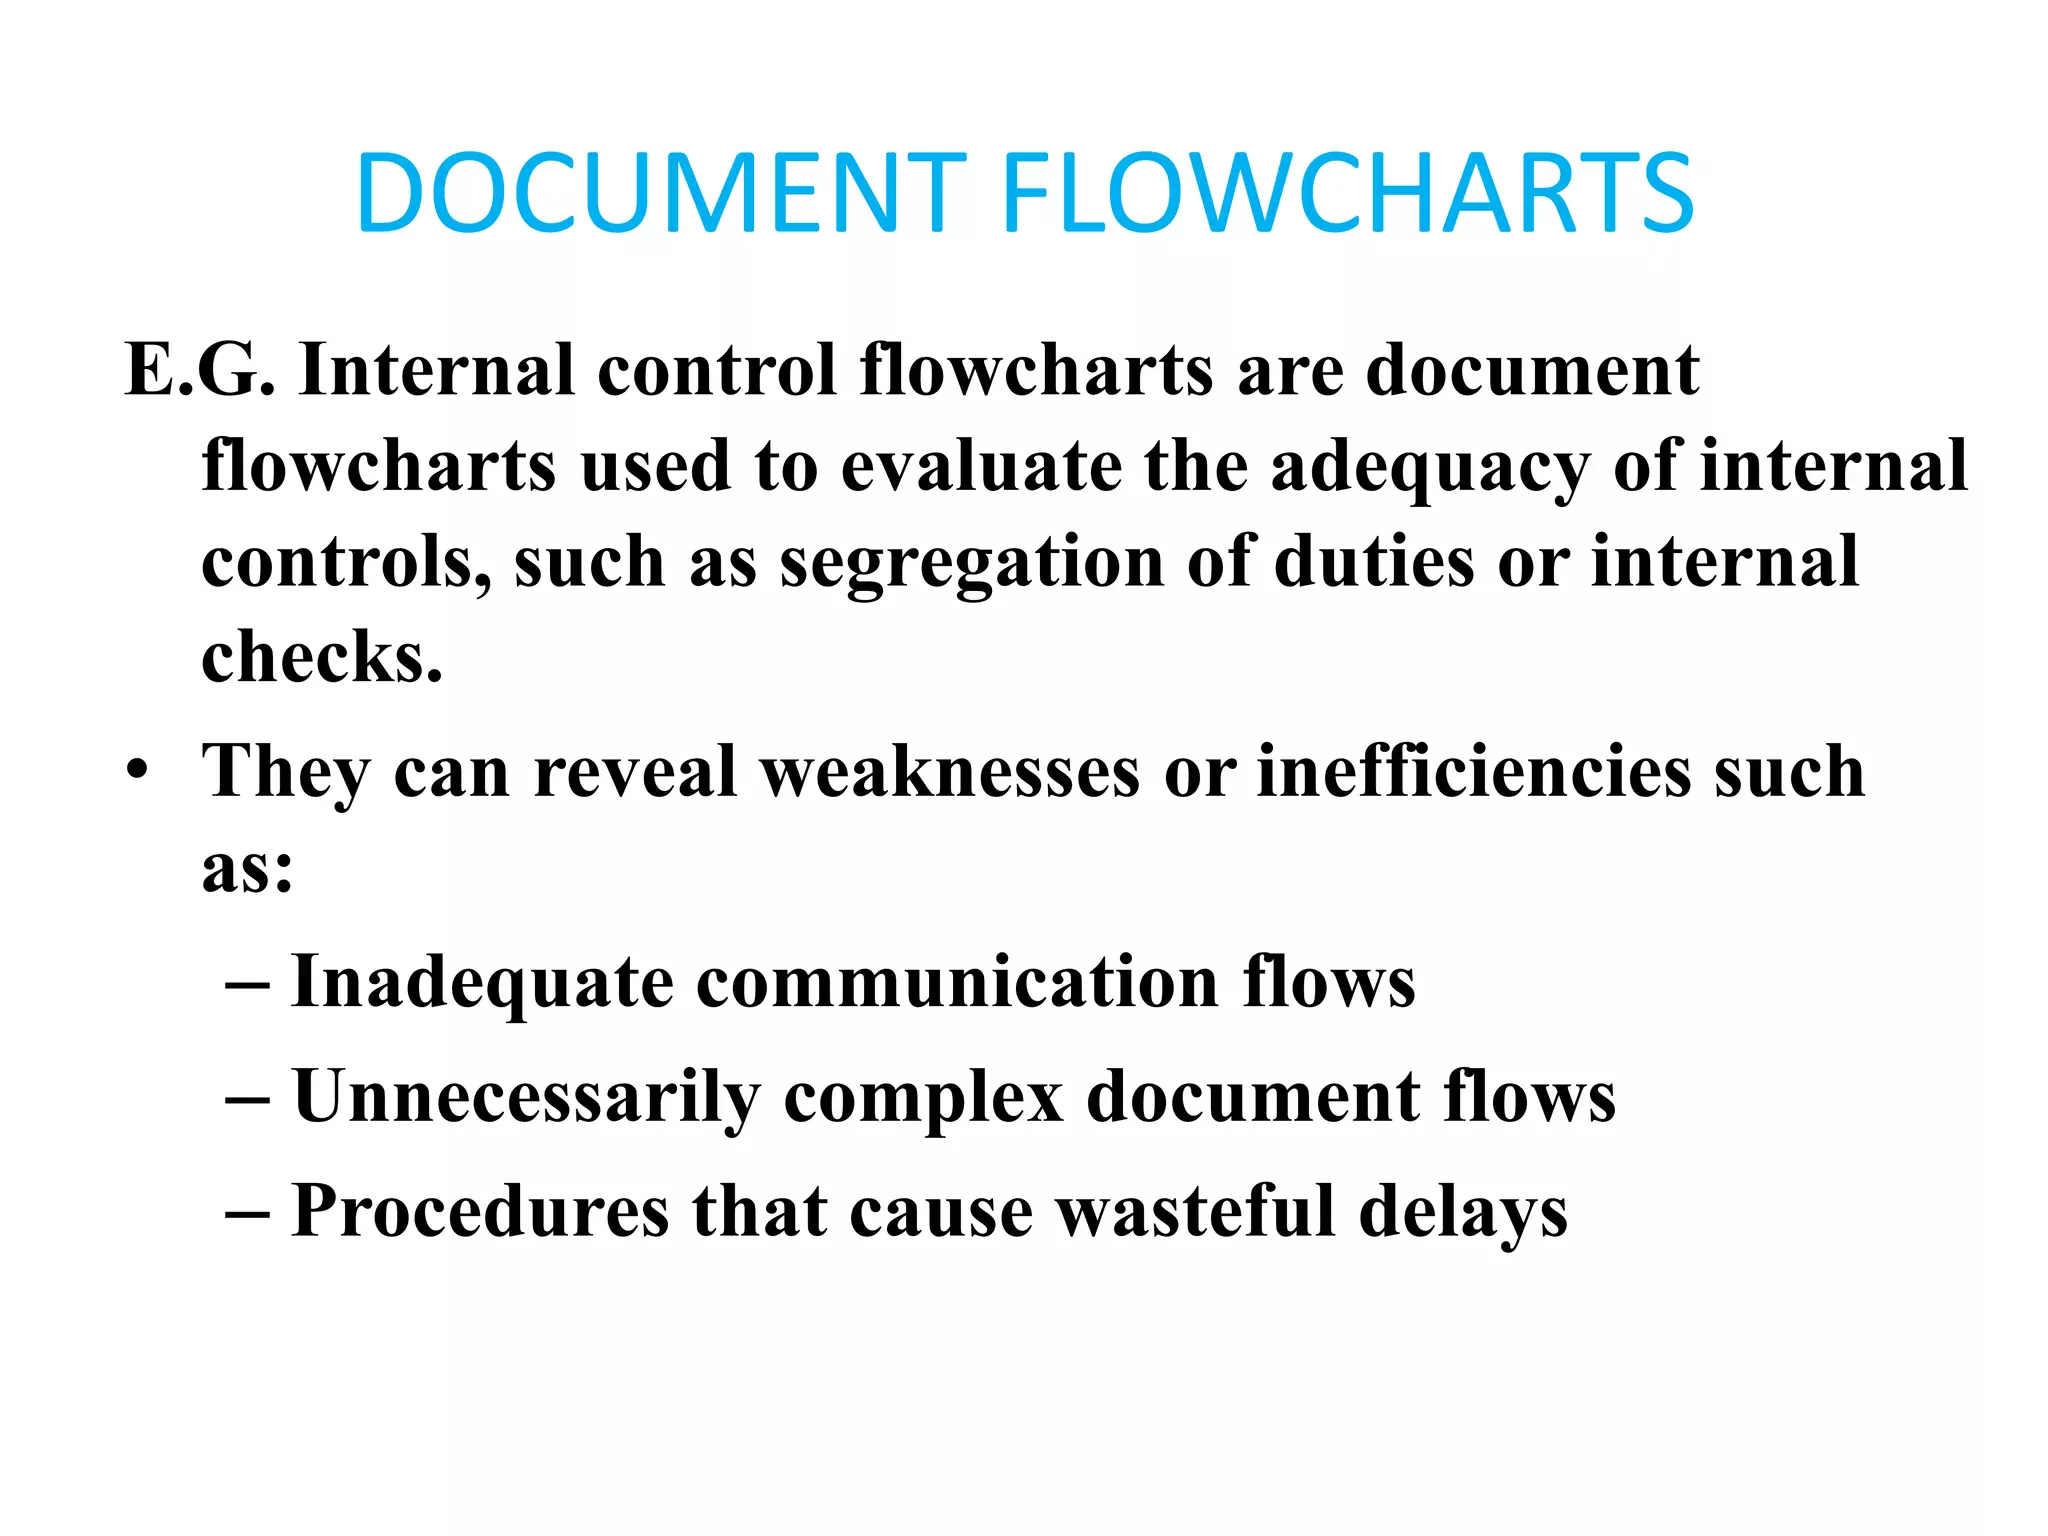
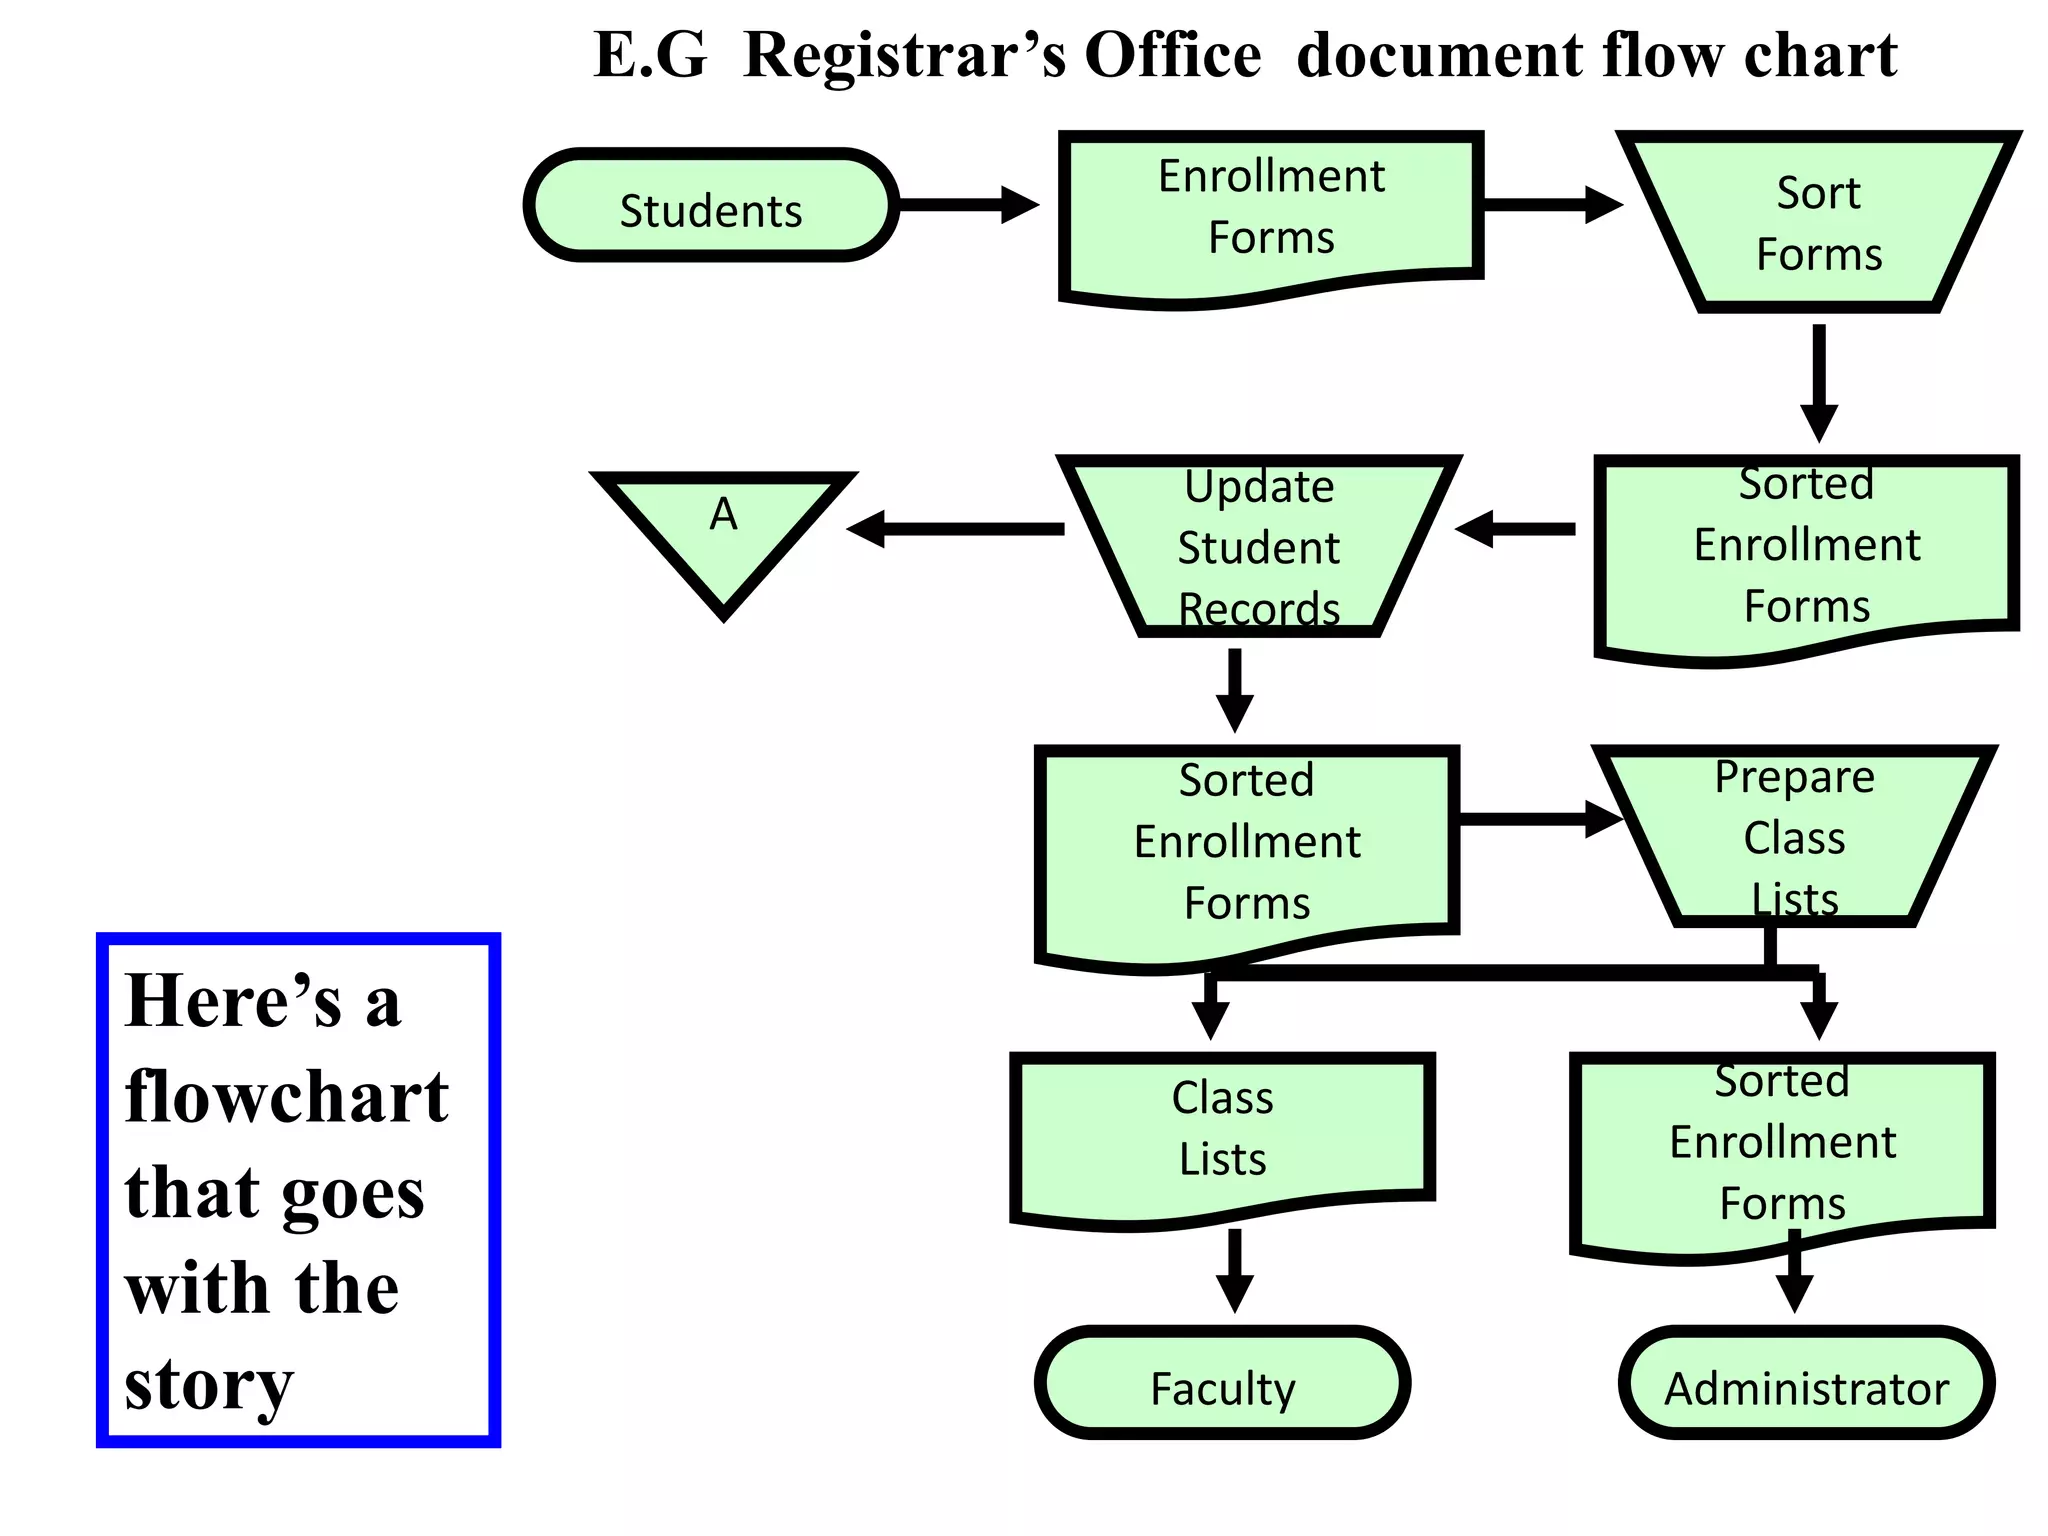
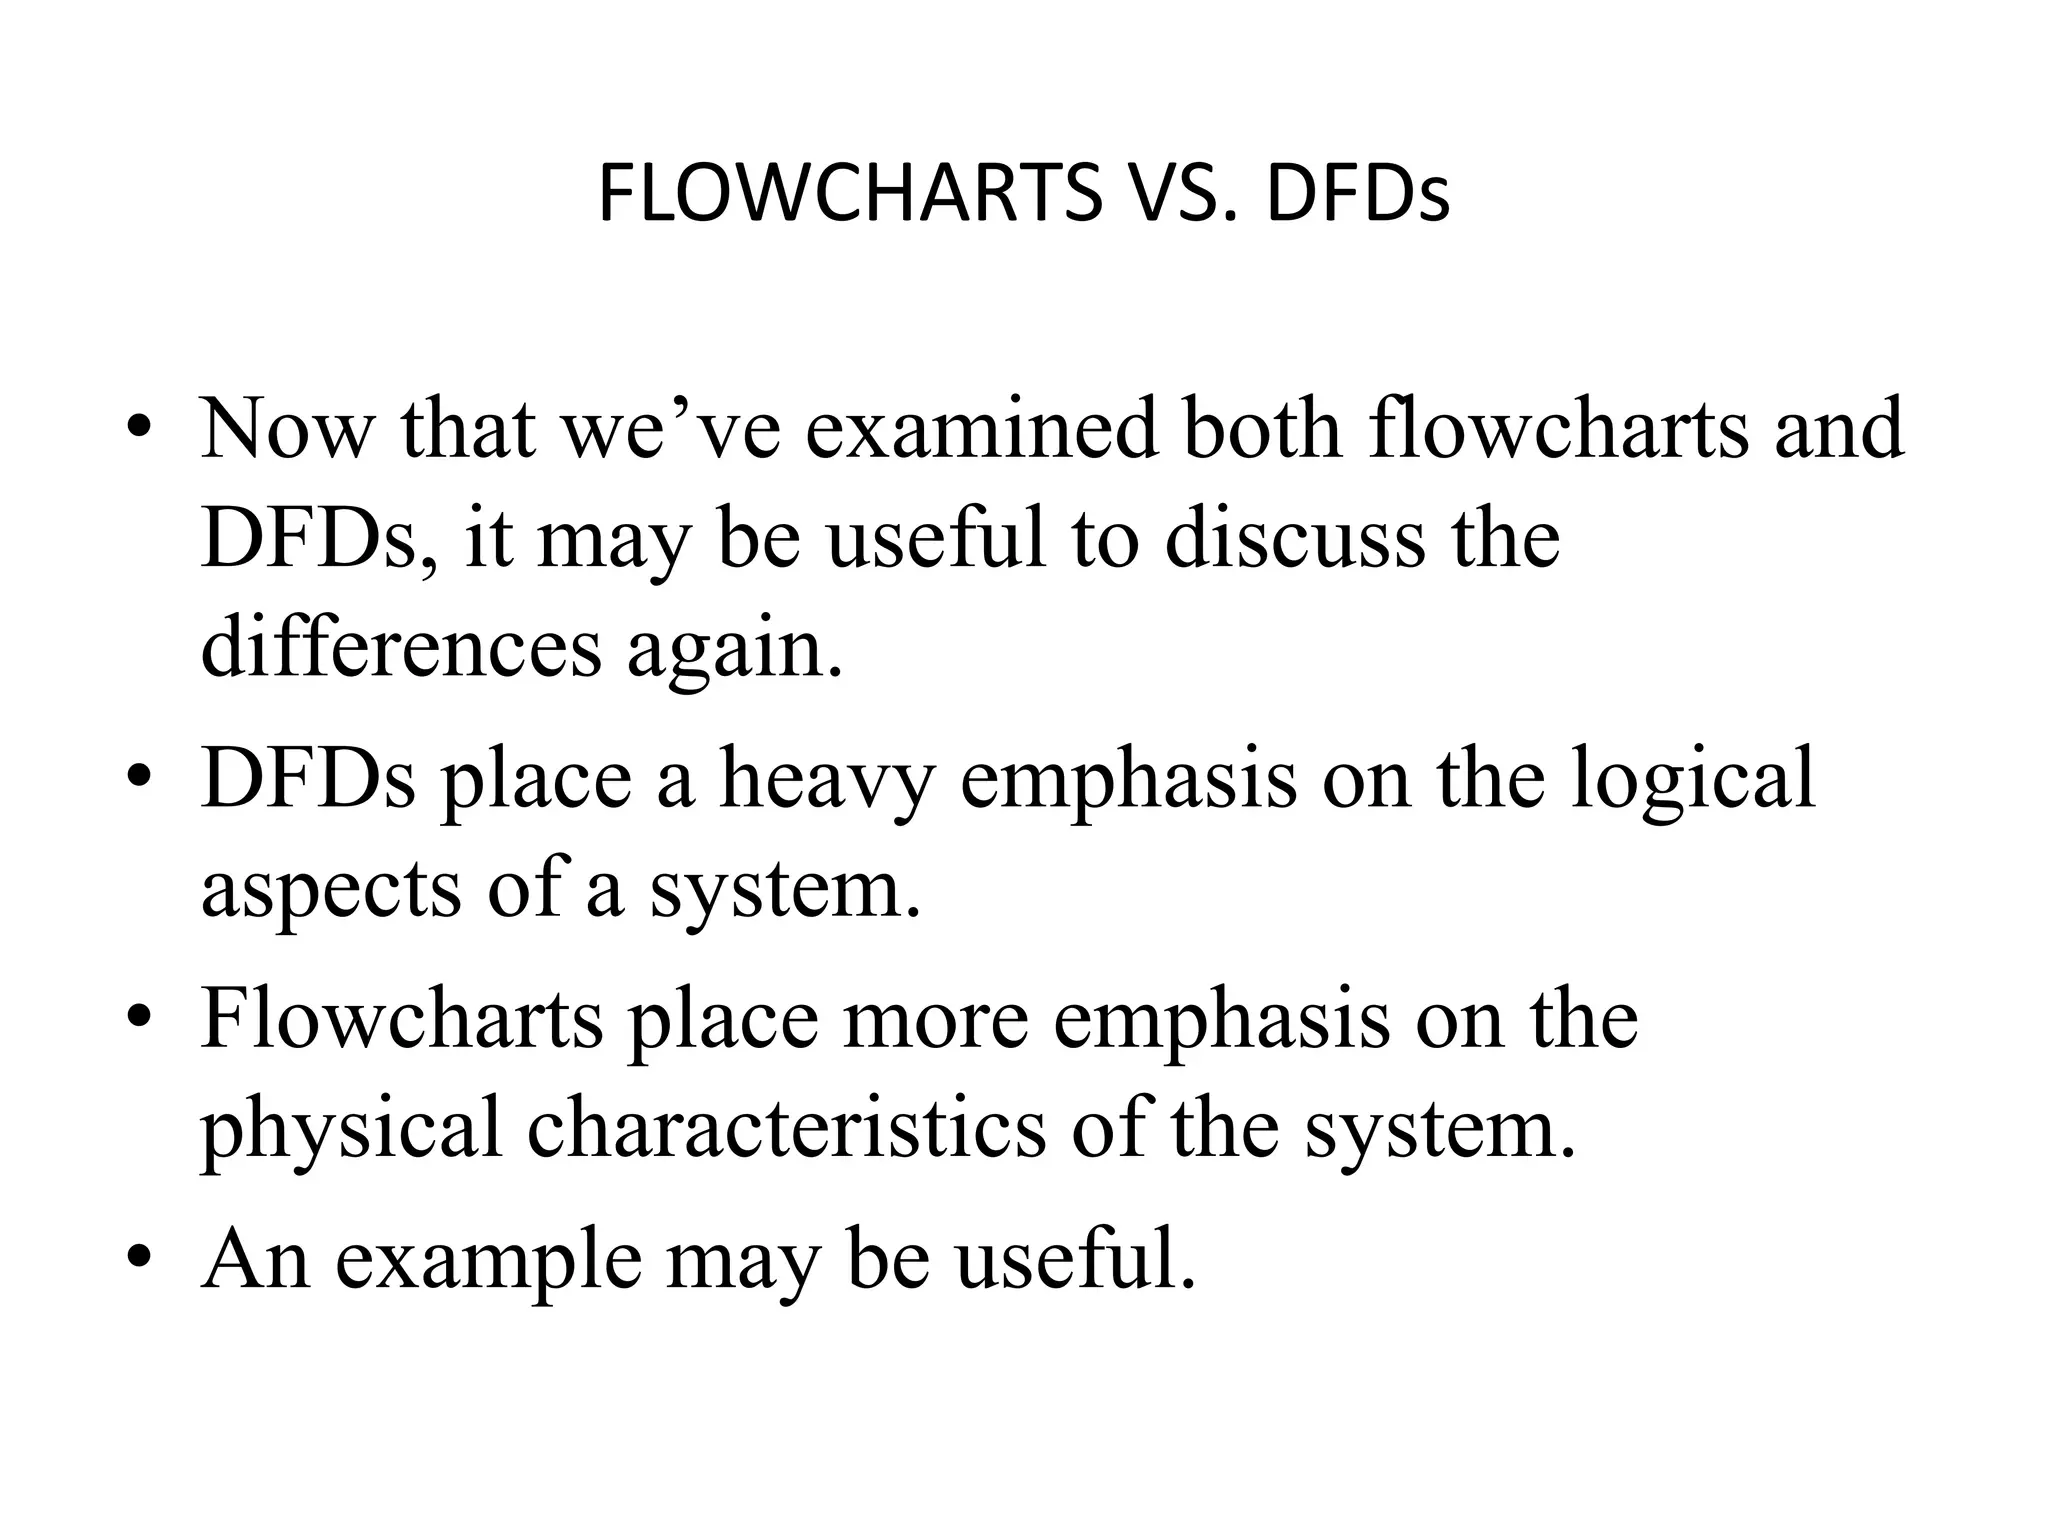
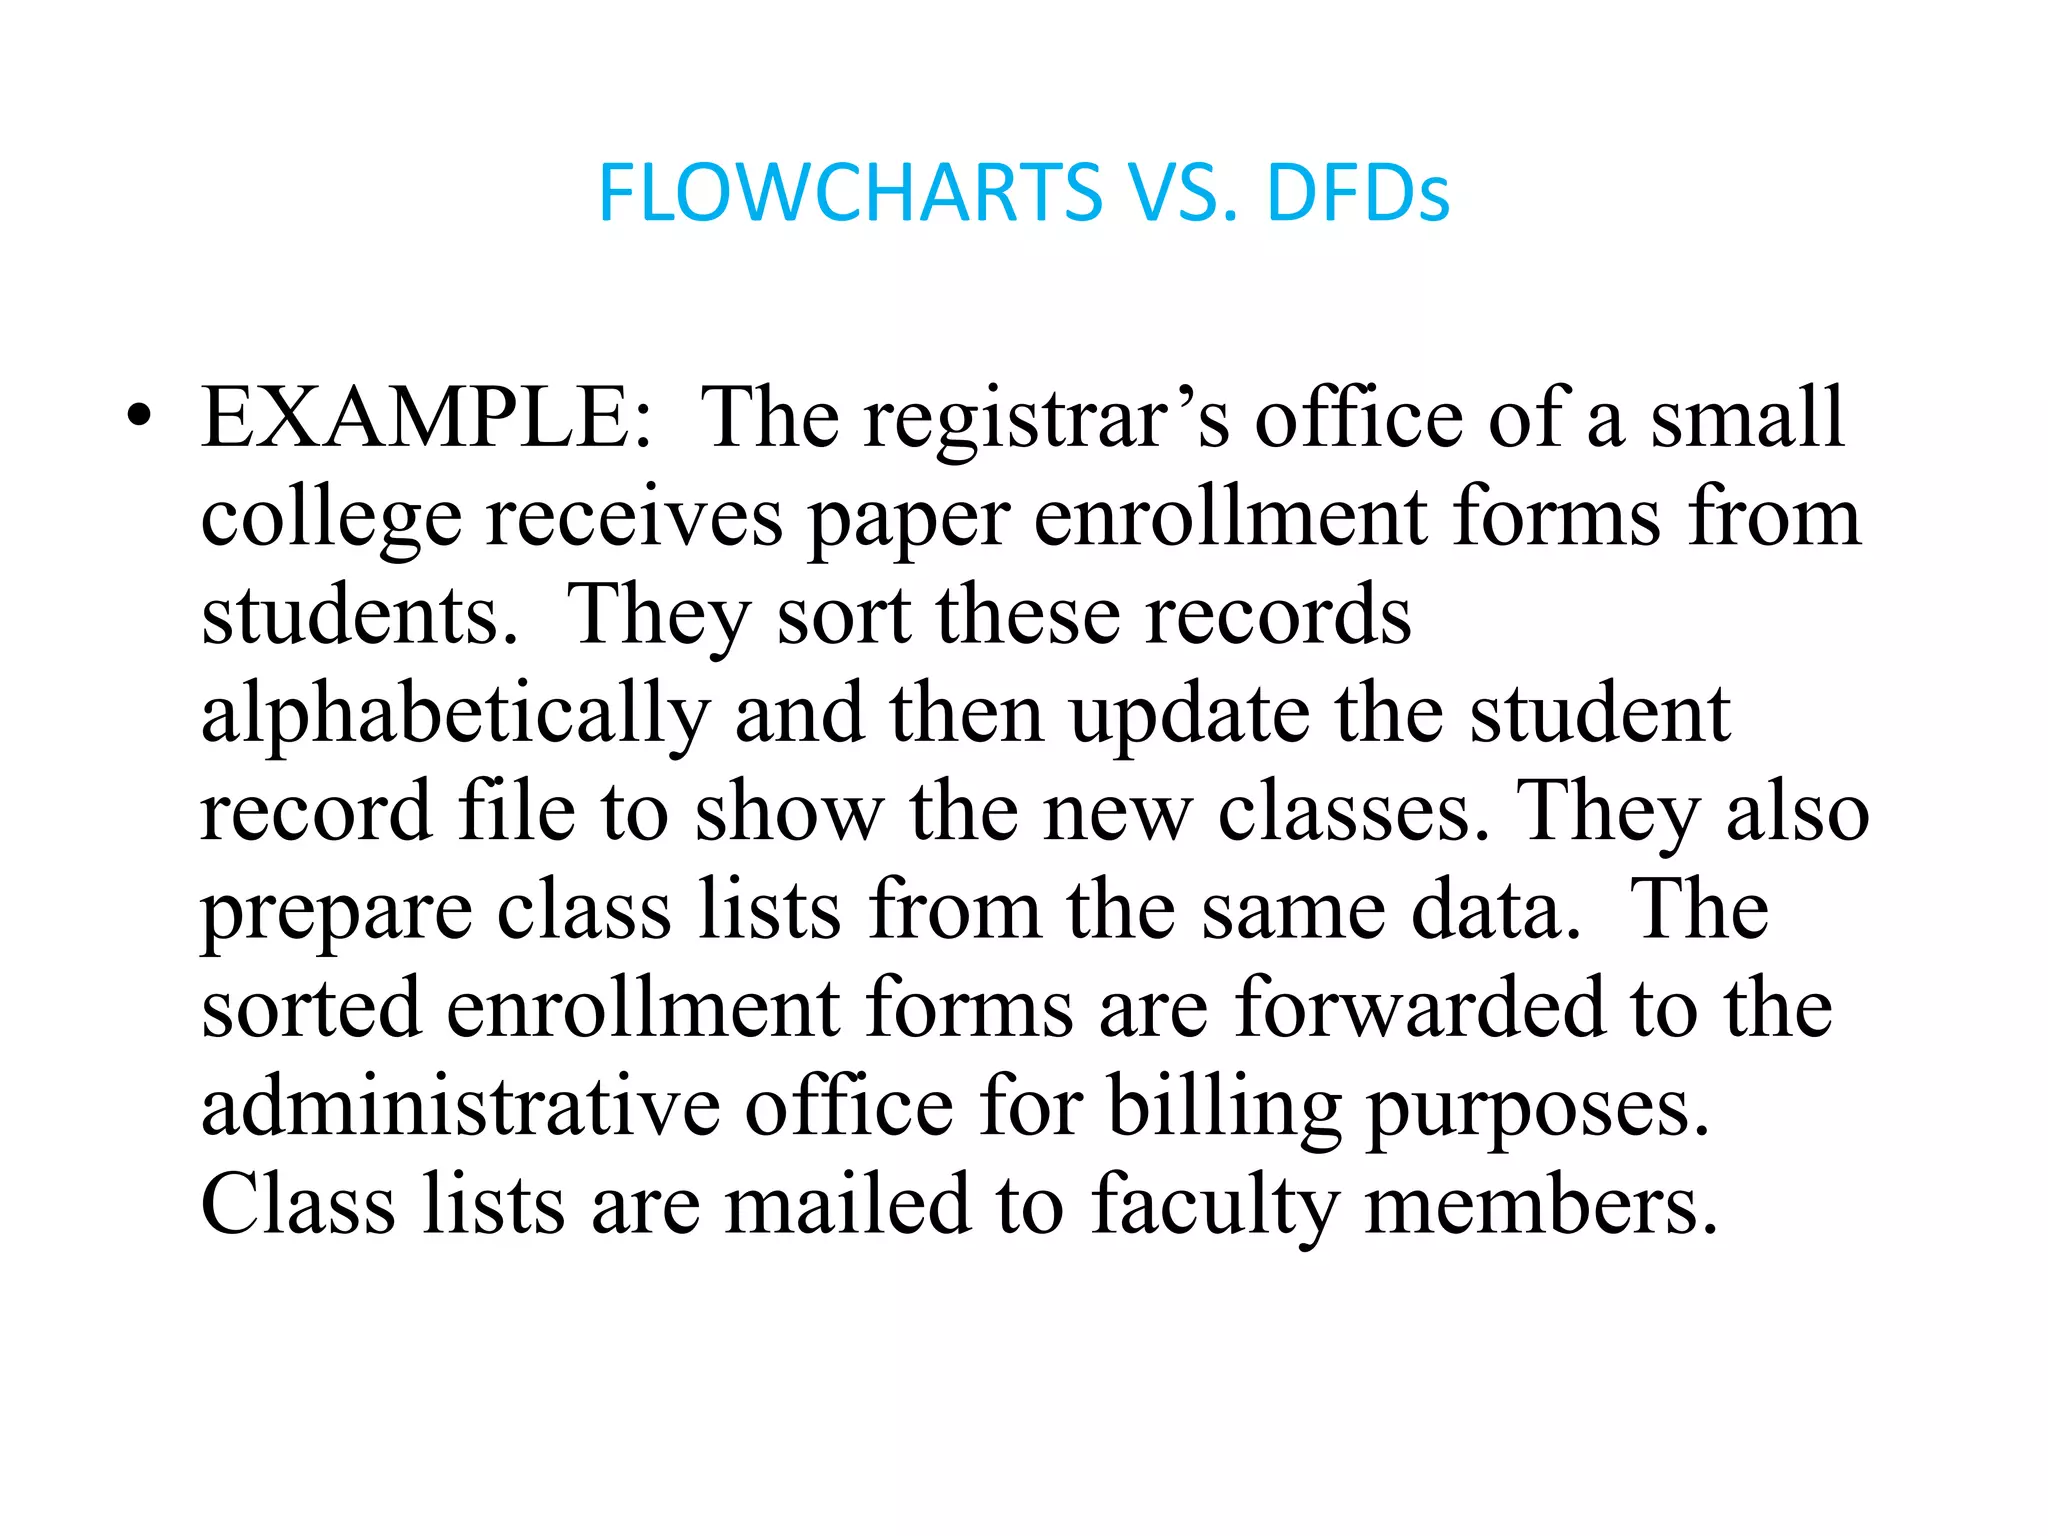
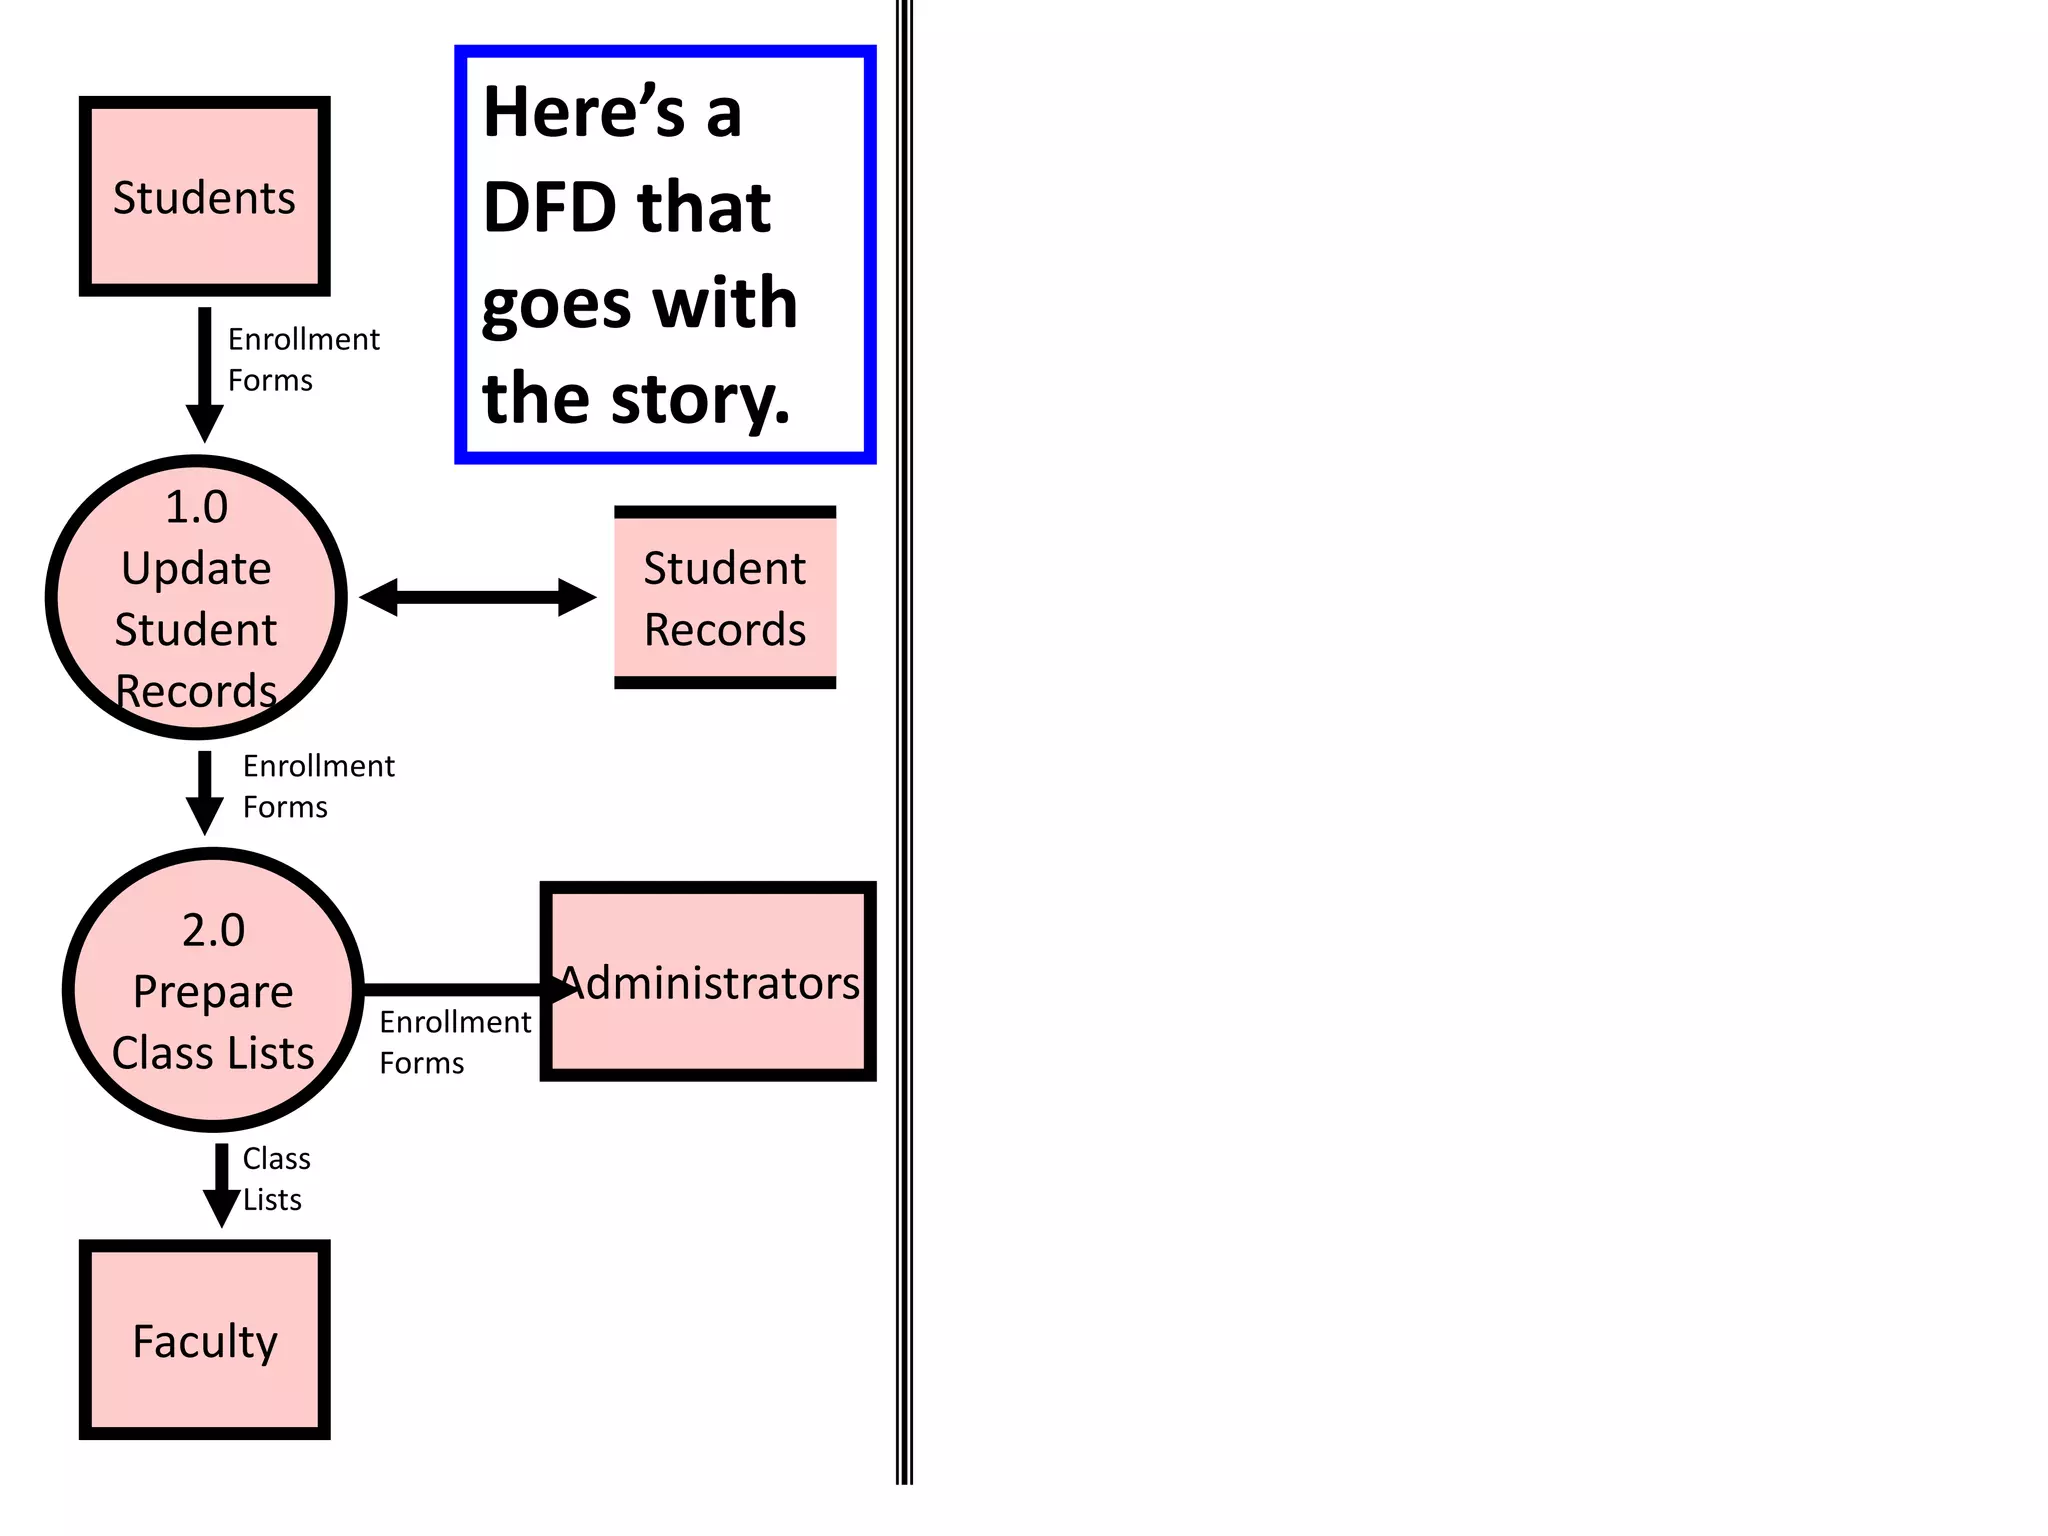
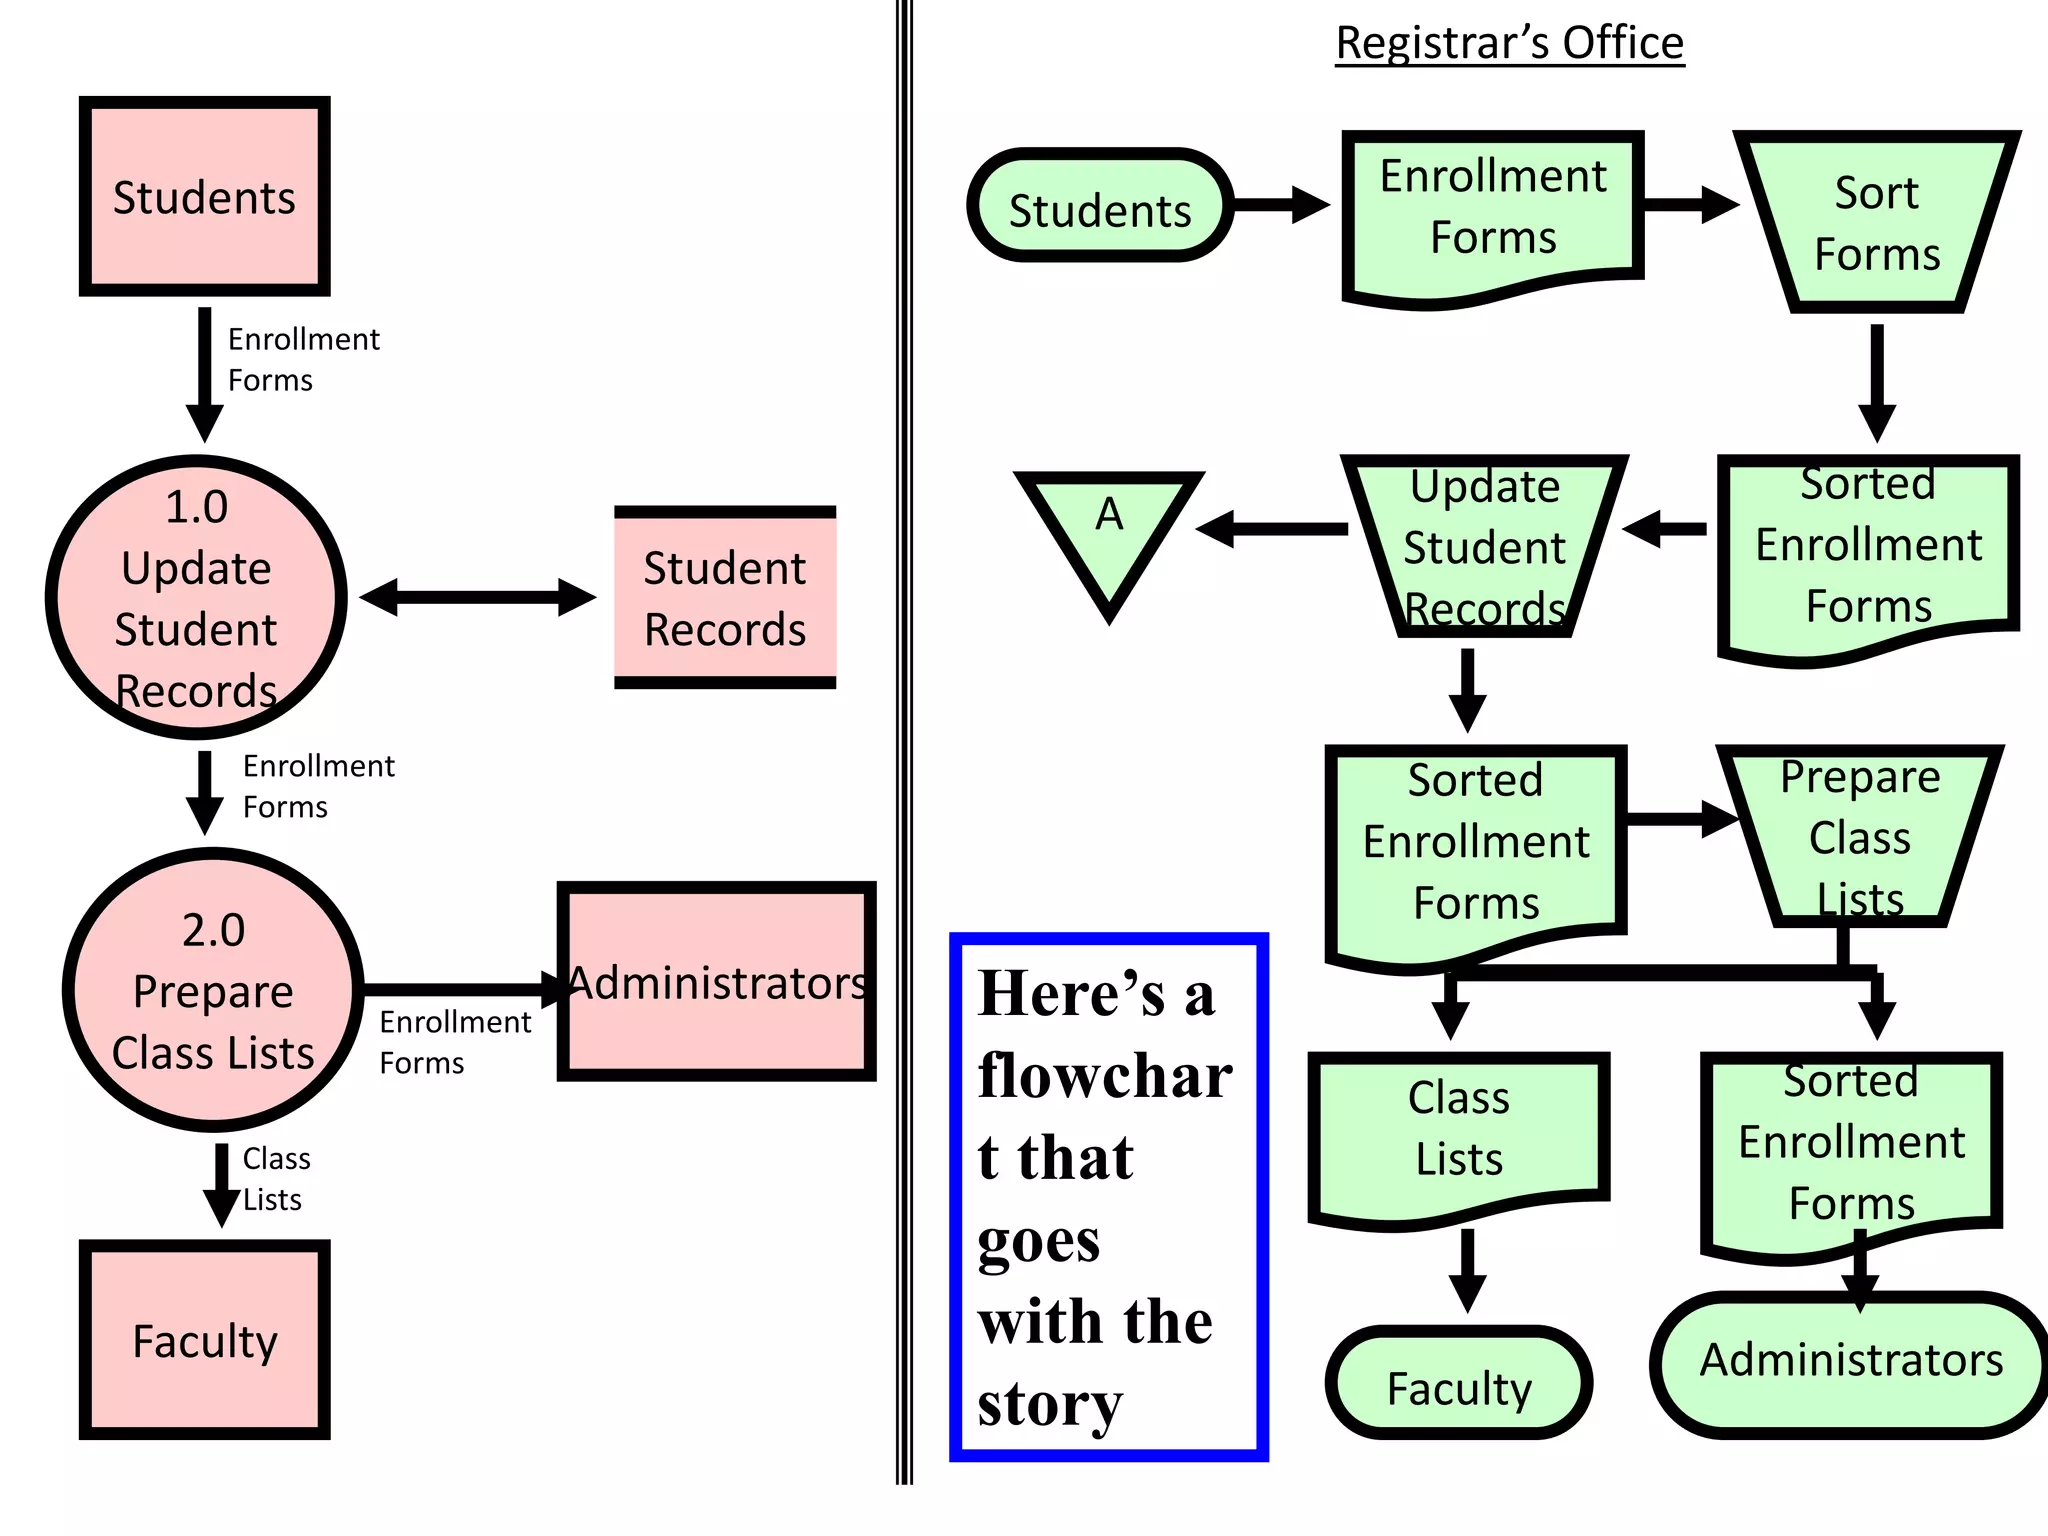
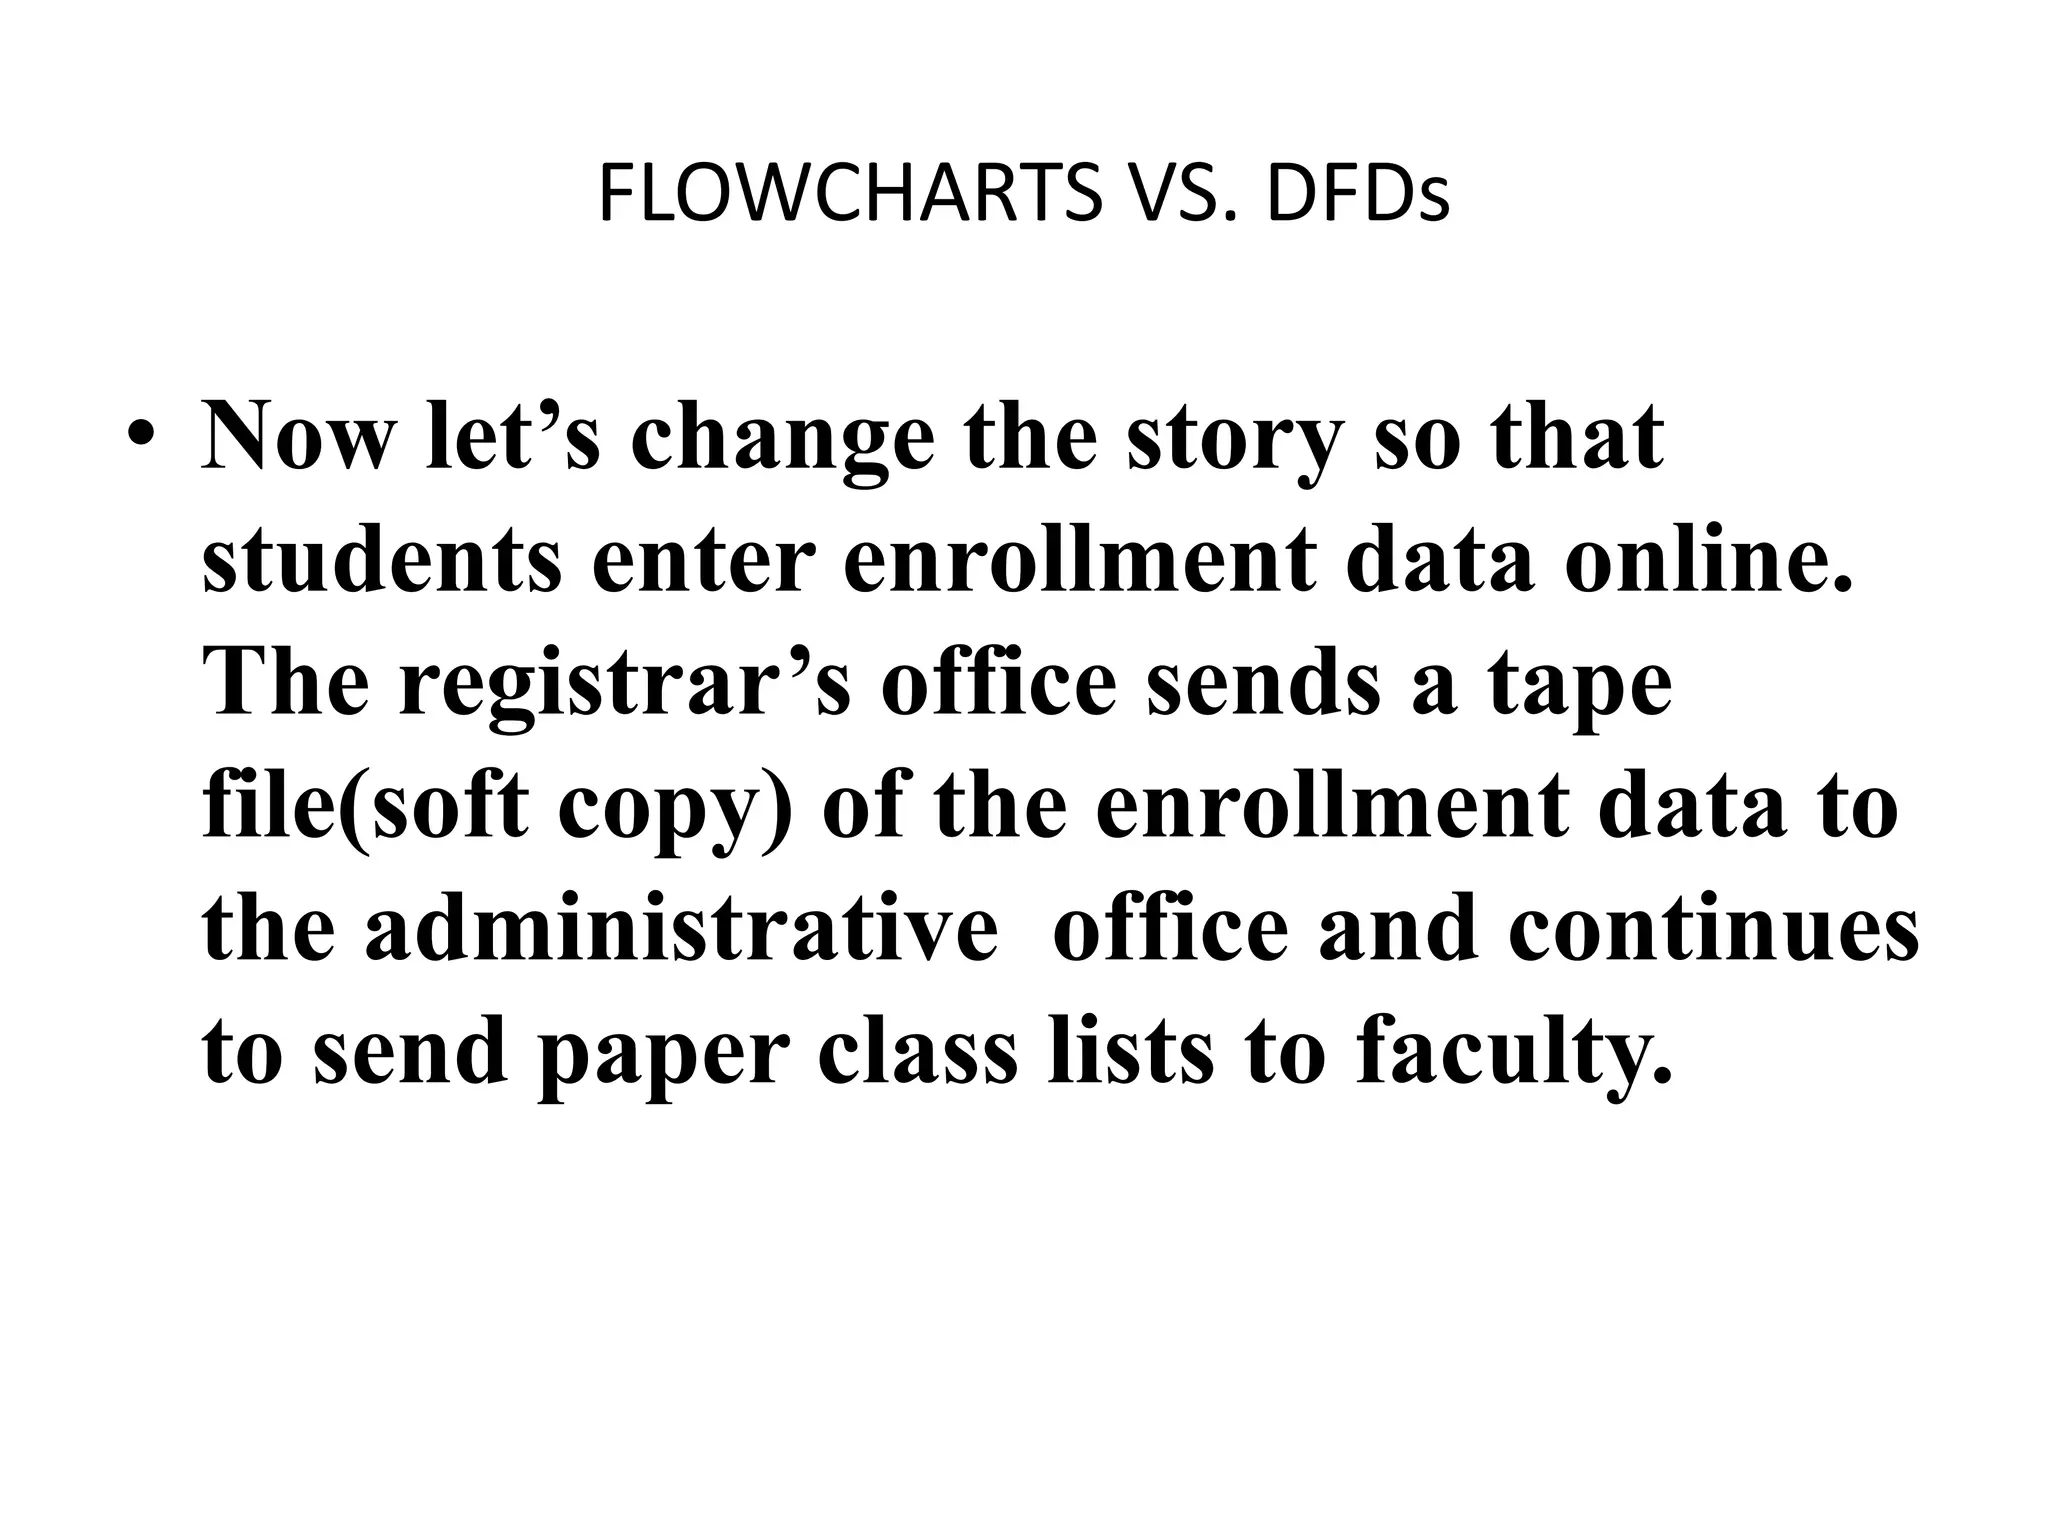
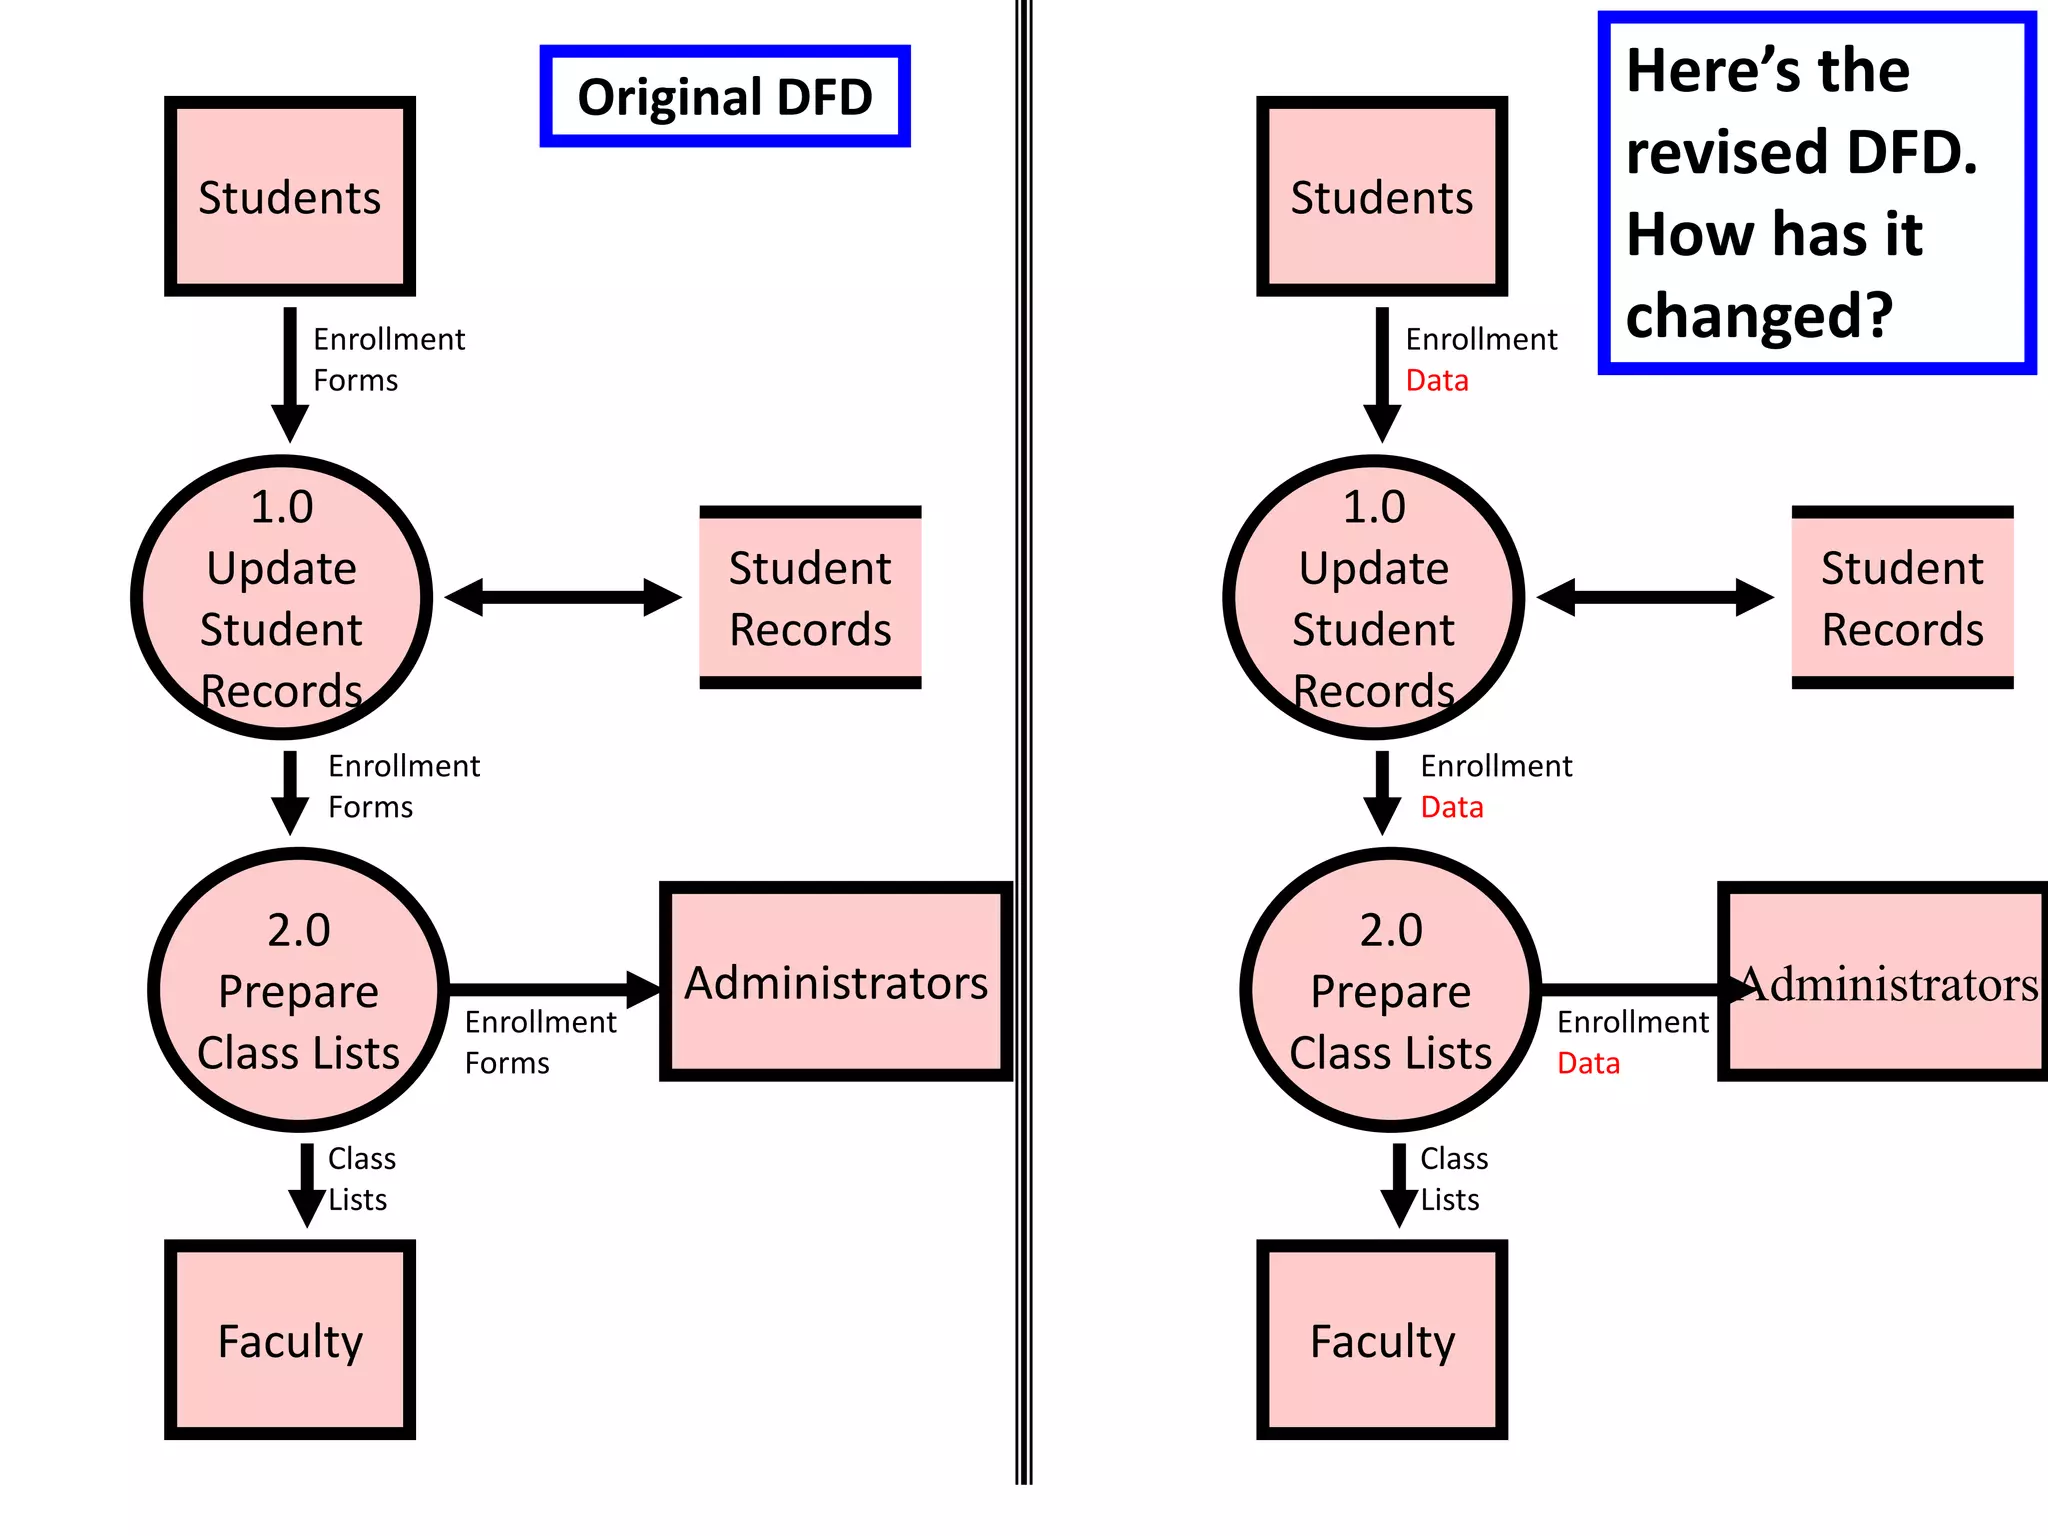
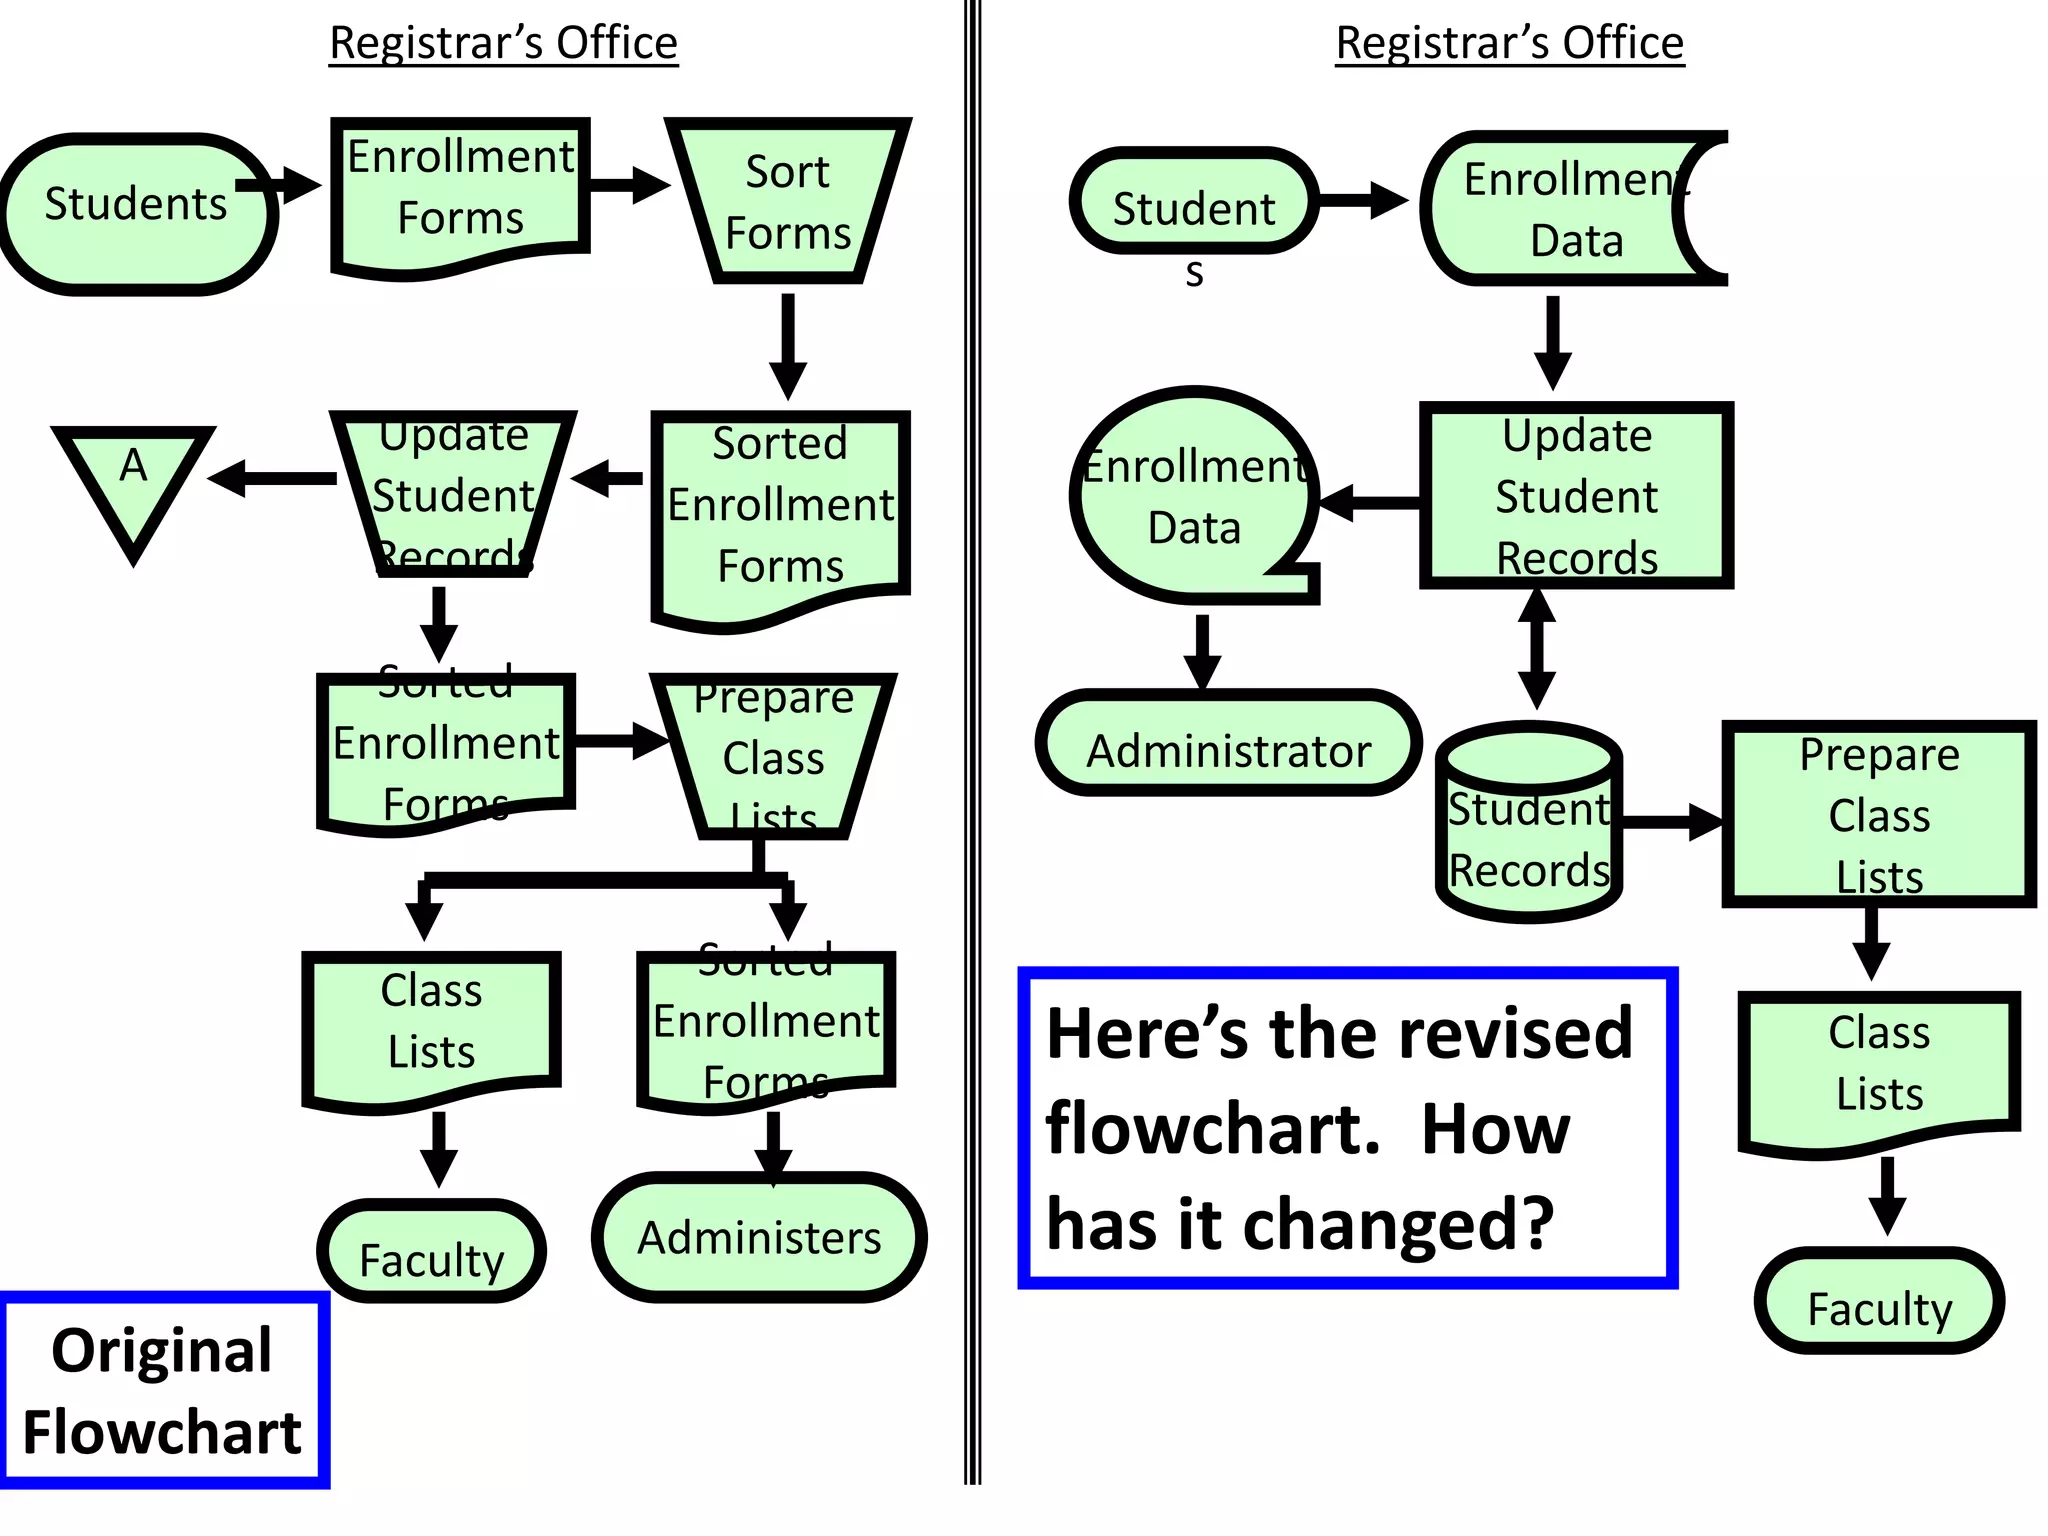
This document discusses documentation techniques used in accounting systems. It begins by outlining the purpose of documentation and why accountants need to understand documentation. The two most common documentation tools - data flow diagrams and flowcharts - are then explained in detail. Data flow diagrams graphically show the flow of data through a system using four basic elements: data sources and destinations, data flows, transformation processes, and data stores. Flowcharts depict the flow of data, documents, or information through a system using standard symbols. The differences between data flow diagrams and flowcharts are explored through an example.
this presentation is about accounting theory and accounting research (chapter 2) from accounting theory book, eight edition (conceptual issues in a political and economic environment) by Harry I. Wolk, James L. Dodd and John J. Rozycki
Current Liabilities, Provisions, and Contingenciesreskino1
Current Liabilities,
Provisions, and Contingencies
After studying this chapter, you should be able to:
1. Describe the nature, valuation, and reporting of current liabilities.
2. Explain the accounting for different types of provisions.
3. Explain the accounting for loss and gain contingencies.
4. Indicate how to present and analyze liability-related information
Financial Reporting And Analysis Explained.as to why is it important, Who is it important for and the different ways of analyzing a financial statement.
Greenwich University
Accounting is defined as the art of Recording, Classifying and Summarizing transactions in monetary terms (in Money terms) for preparation of Financial Statements
Book- keeping includes recording of journal, posting in ledgers and balancing of accounts. All the records before the preparation of trail balance is the whole subject matter of book- keeping.
Accounting, is an information system is the process of identifying, measuring and communicating the economic information of an organization to its users who need the information for decision making.
Understanding Financial Statements and GST implications CA. Pankaj Shah
Understanding Financial Statements and GST implications
By CA. Pankaj Shah
Former Chairman Indore Branch of CIRC of ICAI
LLB(Hons), BBA, C. S., FCA, DISA
This ppt includes an overview of
-OPS Data Mining method,
-mining incomplete servey data,
-automated decision systems,
-real-time data warehousing,
-KPIs,
-Six Sigma Strategy and its possible intergation with Lean approach,
-summary of my OLAP practice with Northwind data set (Access)
Learning Objectives
Prepare and use data flow diagrams to understand, evaluate, and document information systems.
Prepare and use flowcharts to understand, evaluate, and document information systems
Accounting Information system chapter 2 Flowchart.pptmoybon2
AIS
Questions to be addressed in this chapter include:
Decisions an organization makes and the information needed to make them
Accounting Information System (AIS) and its basic functions
How an AIS can add value to an Organization
How an AIS and corporate strategy affect each other
Role of AIS in the Value Chain
Four major steps in data processing cycle
Describe the ways information is stored in computer-based information systems
Discuss how organizations use ERP systems to process transactions and provide information
Questions to be addressed in this chapter include:
Decisions an organization makes and the information needed to make them
Accounting Information System (AIS) and its basic functions
How an AIS can add value to an Organization
How an AIS and corporate strategy affect each other
Role of AIS in the Value Chain
Four major steps in data processing cycle
Describe the ways information is store
Data Warehouse approaches with Dynamics AXAlvin You
Dynamics AX의 BI 구축을 위해 필요한 Data Warehouse 내용입니다.
• What is a Data Warehouse
• Data Warehouse Approaches
• Why Invest in a Data Warehouse
• Getting Started
• BI Models
• BI Solutions
Similar to AIS CH5 (Systems Development and Documentation Techniques).pptx (20)
Techniques to optimize the pagerank algorithm usually fall in two categories. One is to try reducing the work per iteration, and the other is to try reducing the number of iterations. These goals are often at odds with one another. Skipping computation on vertices which have already converged has the potential to save iteration time. Skipping in-identical vertices, with the same in-links, helps reduce duplicate computations and thus could help reduce iteration time. Road networks often have chains which can be short-circuited before pagerank computation to improve performance. Final ranks of chain nodes can be easily calculated. This could reduce both the iteration time, and the number of iterations. If a graph has no dangling nodes, pagerank of each strongly connected component can be computed in topological order. This could help reduce the iteration time, no. of iterations, and also enable multi-iteration concurrency in pagerank computation. The combination of all of the above methods is the STICD algorithm. [sticd] For dynamic graphs, unchanged components whose ranks are unaffected can be skipped altogether.
Explore our comprehensive data analysis project presentation on predicting product ad campaign performance. Learn how data-driven insights can optimize your marketing strategies and enhance campaign effectiveness. Perfect for professionals and students looking to understand the power of data analysis in advertising. for more details visit: https://bostoninstituteofanalytics.org/data-science-and-artificial-intelligence/
Adjusting primitives for graph : SHORT REPORT / NOTESSubhajit Sahu
Graph algorithms, like PageRank Compressed Sparse Row (CSR) is an adjacency-list based graph representation that is
Multiply with different modes (map)
1. Performance of sequential execution based vs OpenMP based vector multiply.
2. Comparing various launch configs for CUDA based vector multiply.
Sum with different storage types (reduce)
1. Performance of vector element sum using float vs bfloat16 as the storage type.
Sum with different modes (reduce)
1. Performance of sequential execution based vs OpenMP based vector element sum.
2. Performance of memcpy vs in-place based CUDA based vector element sum.
3. Comparing various launch configs for CUDA based vector element sum (memcpy).
4. Comparing various launch configs for CUDA based vector element sum (in-place).
Sum with in-place strategies of CUDA mode (reduce)
1. Comparing various launch configs for CUDA based vector element sum (in-place).
Show drafts
volume_up
Empowering the Data Analytics Ecosystem: A Laser Focus on Value
The data analytics ecosystem thrives when every component functions at its peak, unlocking the true potential of data. Here's a laser focus on key areas for an empowered ecosystem:
1. Democratize Access, Not Data:
Granular Access Controls: Provide users with self-service tools tailored to their specific needs, preventing data overload and misuse.
Data Catalogs: Implement robust data catalogs for easy discovery and understanding of available data sources.
2. Foster Collaboration with Clear Roles:
Data Mesh Architecture: Break down data silos by creating a distributed data ownership model with clear ownership and responsibilities.
Collaborative Workspaces: Utilize interactive platforms where data scientists, analysts, and domain experts can work seamlessly together.
3. Leverage Advanced Analytics Strategically:
AI-powered Automation: Automate repetitive tasks like data cleaning and feature engineering, freeing up data talent for higher-level analysis.
Right-Tool Selection: Strategically choose the most effective advanced analytics techniques (e.g., AI, ML) based on specific business problems.
4. Prioritize Data Quality with Automation:
Automated Data Validation: Implement automated data quality checks to identify and rectify errors at the source, minimizing downstream issues.
Data Lineage Tracking: Track the flow of data throughout the ecosystem, ensuring transparency and facilitating root cause analysis for errors.
5. Cultivate a Data-Driven Mindset:
Metrics-Driven Performance Management: Align KPIs and performance metrics with data-driven insights to ensure actionable decision making.
Data Storytelling Workshops: Equip stakeholders with the skills to translate complex data findings into compelling narratives that drive action.
Benefits of a Precise Ecosystem:
Sharpened Focus: Precise access and clear roles ensure everyone works with the most relevant data, maximizing efficiency.
Actionable Insights: Strategic analytics and automated quality checks lead to more reliable and actionable data insights.
Continuous Improvement: Data-driven performance management fosters a culture of learning and continuous improvement.
Sustainable Growth: Empowered by data, organizations can make informed decisions to drive sustainable growth and innovation.
By focusing on these precise actions, organizations can create an empowered data analytics ecosystem that delivers real value by driving data-driven decisions and maximizing the return on their data investment.
Opendatabay - Open Data Marketplace.pptxOpendatabay
Opendatabay.com unlocks the power of data for everyone. Open Data Marketplace fosters a collaborative hub for data enthusiasts to explore, share, and contribute to a vast collection of datasets.
First ever open hub for data enthusiasts to collaborate and innovate. A platform to explore, share, and contribute to a vast collection of datasets. Through robust quality control and innovative technologies like blockchain verification, opendatabay ensures the authenticity and reliability of datasets, empowering users to make data-driven decisions with confidence. Leverage cutting-edge AI technologies to enhance the data exploration, analysis, and discovery experience.
From intelligent search and recommendations to automated data productisation and quotation, Opendatabay AI-driven features streamline the data workflow. Finding the data you need shouldn't be a complex. Opendatabay simplifies the data acquisition process with an intuitive interface and robust search tools. Effortlessly explore, discover, and access the data you need, allowing you to focus on extracting valuable insights. Opendatabay breaks new ground with a dedicated, AI-generated, synthetic datasets.
Leverage these privacy-preserving datasets for training and testing AI models without compromising sensitive information. Opendatabay prioritizes transparency by providing detailed metadata, provenance information, and usage guidelines for each dataset, ensuring users have a comprehensive understanding of the data they're working with. By leveraging a powerful combination of distributed ledger technology and rigorous third-party audits Opendatabay ensures the authenticity and reliability of every dataset. Security is at the core of Opendatabay. Marketplace implements stringent security measures, including encryption, access controls, and regular vulnerability assessments, to safeguard your data and protect your privacy.
2. INTRODUCTION
• Questions to be addressed in this chapter
include:
–What is the purpose of documentation?
–Why do accountants need to understand
documentation?
–What documentation techniques are used
in accounting systems?
–What are data flow diagrams and
flowcharts?
5. INTRODUCTION
• How do accountants use documentation?
– At a minimum, they have to read documentation to
understand how a system works.
– They may need to evaluate the strengths and
weaknesses of an entity’s internal controls. E.g.
auditors
– They may Organize very complicated systems into
a form that can be more readily understood
– Helping new team members understand a pre-
existing system
– They may prepare documentation for different
purpose.
So that, Accountants should know about
documentation techniques.
6. INTRODUCTION
There are two of the most common
documentation tools:
–Data flow diagrams
• Graphical descriptions of the
sources and destinations of data.
They show:
– Where data comes from
– How it flows
– The processes performed on it
– Where it goes
7. INTRODUCTION
There are two of the most common documentation
tools:
–Data flow diagrams
–Flowcharts
• Include three types:
– Document flowcharts describe the flow of documents and
information between departments or units.
– System flowcharts describe the relationship between inputs,
processing, and outputs for a system.
– Program flowcharts describe the sequence of logical
operations performed in a computer program.
8. INTRODUCTION
• Which method should you use—flowcharts
or DFDs?
62.5% of AIS professionals use DFDs.
97.6% use flowcharts.
Both can be prepared relatively simply
using available software.
Both are tested on professional exams.
You need to know them both.
9. DATA FLOW DIAGRAMS
• A data flow diagram (DFD) graphically
describes the flow of data within an
organization. It is used to:
Document existing systems
Plan and design new systems
11. DATA FLOW DIAGRAMS
• A data flow diagram consists of four basic
elements:
–Data sources and destinations
–Data flows
–Transformation processes
–Data stores
12. DATA FLOW DIAGRAMS
• A data flow diagram consists of four basic
elements:
– Data sources and destinations
– Data flows
– Transformation processes
– Data stores
13. DATA FLOW DIAGRAMS
• Data sources and destinations
– Appear as squares
– Represent organizations or individuals that send or
receive data used or produced by the system
• An item can be both a source and a destination
15. DATA FLOW DIAGRAMS
• A data flow diagram consists of four basic
elements:
–Data sources and destinations
–Data flows
–Transformation processes
–Data stores
16. DATA FLOW DIAGRAMS
• Data flows
–Appear as arrows
–Represent the flow of data between sources
and destinations, processes, and data stores
18. DATA FLOW DIAGRAMS
• As you probably see from the previous slides, if a
data flow is two-way, use a bi-directional arrow.
Update
Receiv-
ables
General
Ledger
19. DATA FLOW DIAGRAMS
• If two data elements flow together, then the
use of one data flow line is appropriate.
Customer
Process
Payment
Cash Rec’t & Remittance Slip
20. DATA FLOW DIAGRAMS
• If the data elements do not always flow
together, then multiple lines will be
needed.
Customer
Process
Payment
Customer Inquiry
Customer Payment
21. DATA FLOW DIAGRAMS
• A data flow diagram consists of four basic
elements:
– Data sources and destinations
– Data flows
– Transformation processes
– Data stores
22. DATA FLOW DIAGRAMS
• Processes
–Appear as circles
–Represent the transformation of data
26. DATA FLOW DIAGRAMS
• The data flow diagram focuses on the
logical flow of data.
• Next, we will discuss flowcharts, which
place greater emphasis on physical
details.
27. FLOWCHARTS
• A flowchart is an analytical technique that
describes some aspect of an information
system in a clear, concise, and logical manner.
• Flowcharts use a set of standard symbols to
depict processing procedures and the flow of
data.
• Flow charts can be:
A. Documentation flow chart
B. System flow chart
C. Program flow chart
28. A. DOCUMENT FLOWCHARTS
• A document flowchart shows the flow of documents and
information among areas of responsibility in an
organization.
• These flowcharts shows:
– Where a document comes from
– Where it’s distributed
– How it’s used
– It’s ultimate disposition
– Everything that happens as it flows through the system
29. DOCUMENT FLOWCHARTS
E.G. Internal control flowcharts are document
flowcharts used to evaluate the adequacy of internal
controls, such as segregation of duties or internal
checks.
• They can reveal weaknesses or inefficiencies such
as:
– Inadequate communication flows
– Unnecessarily complex document flows
– Procedures that cause wasteful delays
30. Students
E.G Registrar’s Office document flow chart
Enrollment
Forms
Sort
Forms
Sorted
Enrollment
Forms
Update
Student
Records
A
Prepare
Class
Lists
Sorted
Enrollment
Forms
Class
Lists
Sorted
Enrollment
Forms
Administrator
Faculty
Here’s a
flowchart
that goes
with the
story
31. FLOWCHARTS VS. DFDs
• Now that we’ve examined both flowcharts and
DFDs, it may be useful to discuss the
differences again.
• DFDs place a heavy emphasis on the logical
aspects of a system.
• Flowcharts place more emphasis on the
physical characteristics of the system.
• An example may be useful.
32. FLOWCHARTS VS. DFDs
• EXAMPLE: The registrar’s office of a small
college receives paper enrollment forms from
students. They sort these records
alphabetically and then update the student
record file to show the new classes. They also
prepare class lists from the same data. The
sorted enrollment forms are forwarded to the
administrative office for billing purposes.
Class lists are mailed to faculty members.
35. FLOWCHARTS VS. DFDs
• Now let’s change the story so that
students enter enrollment data online.
The registrar’s office sends a tape
file(soft copy) of the enrollment data to
the administrative office and continues
to send paper class lists to faculty.
37. Here’s the revised
flowchart. How
has it changed?
Registrar’s Office
Student
s
Class
Lists
Administrator
Faculty
Enrollment
Data
Update
Student
Records
Student
Records
Enrollment
Data
Prepare
Class
Lists
Students
Registrar’s Office
Enrollment
Forms
Sort
Forms
Sorted
Enrollment
Forms
Update
Student
Records
A
Prepare
Class
Lists
Sorted
Enrollment
Forms
Class
Lists
Sorted
Enrollment
Forms
Administers
Faculty
Original
Flowchart
38. FLOWCHARTS VS. DFDs
• Moral of the Story: Changes in the physical
characteristics of the process do affect the
flowchart but have little or no impact on the
DFD.
• The DFD focuses more on the logic.
• When deciding which tool to employ,
consider the information needs of those who
will view it.
39. B. SYSTEM FLOWCHARTS
• A system flowchart depicts the relationship
among the inputs, processes, and outputs of
an AIS.
–The system flowchart begins by
identifying the inputs to the system.
• These inputs can be:
– New data
– Data stored for future use
– Both
40. SYSTEM FLOWCHARTS
• A system flowchart depicts the relationship among
the inputs, processes, and outputs of an AIS.
– The system flowchart begins by identifying the
inputs to the system.
– Each input is followed by a process, i.e., the
steps performed on the data.
• If the process is performed by a
computer, the computer program
would be depicted in a program
flowchart.
41. SYSTEM FLOWCHARTS
• A system flowchart depicts the relationship among
the inputs, processes, and outputs of an AIS.
– The system flowchart begins by identifying the
inputs to the system.
– Each input is followed by a process, i.e., the
steps performed on the data.
– The process is followed by outputs—the
resulting new information.
• The output may be:
– Stored for later use
– Displayed on a screen
– Printed on paper
– An input to the next process
42. SYSTEM FLOWCHARTS
• A system flowchart depicts the relationship among
the inputs, processes, and outputs of an AIS.
– The system flowchart begins by identifying the
inputs to the system.
– Each input is followed by a process, i.e., the
steps performed on the data.
– The process is followed by outputs—the
resulting new information.
– In other words, it’s the same basic input –
process – output pattern that we saw in the
document flowchart.
43. PROGRAM FLOWCHARTS
• Program flowcharts illustrate the sequence of
operations performed by a computer in
executing a program.
• They also follow an input – process – output
pattern.
• This is more specific than system flow chart.