Download to read offline


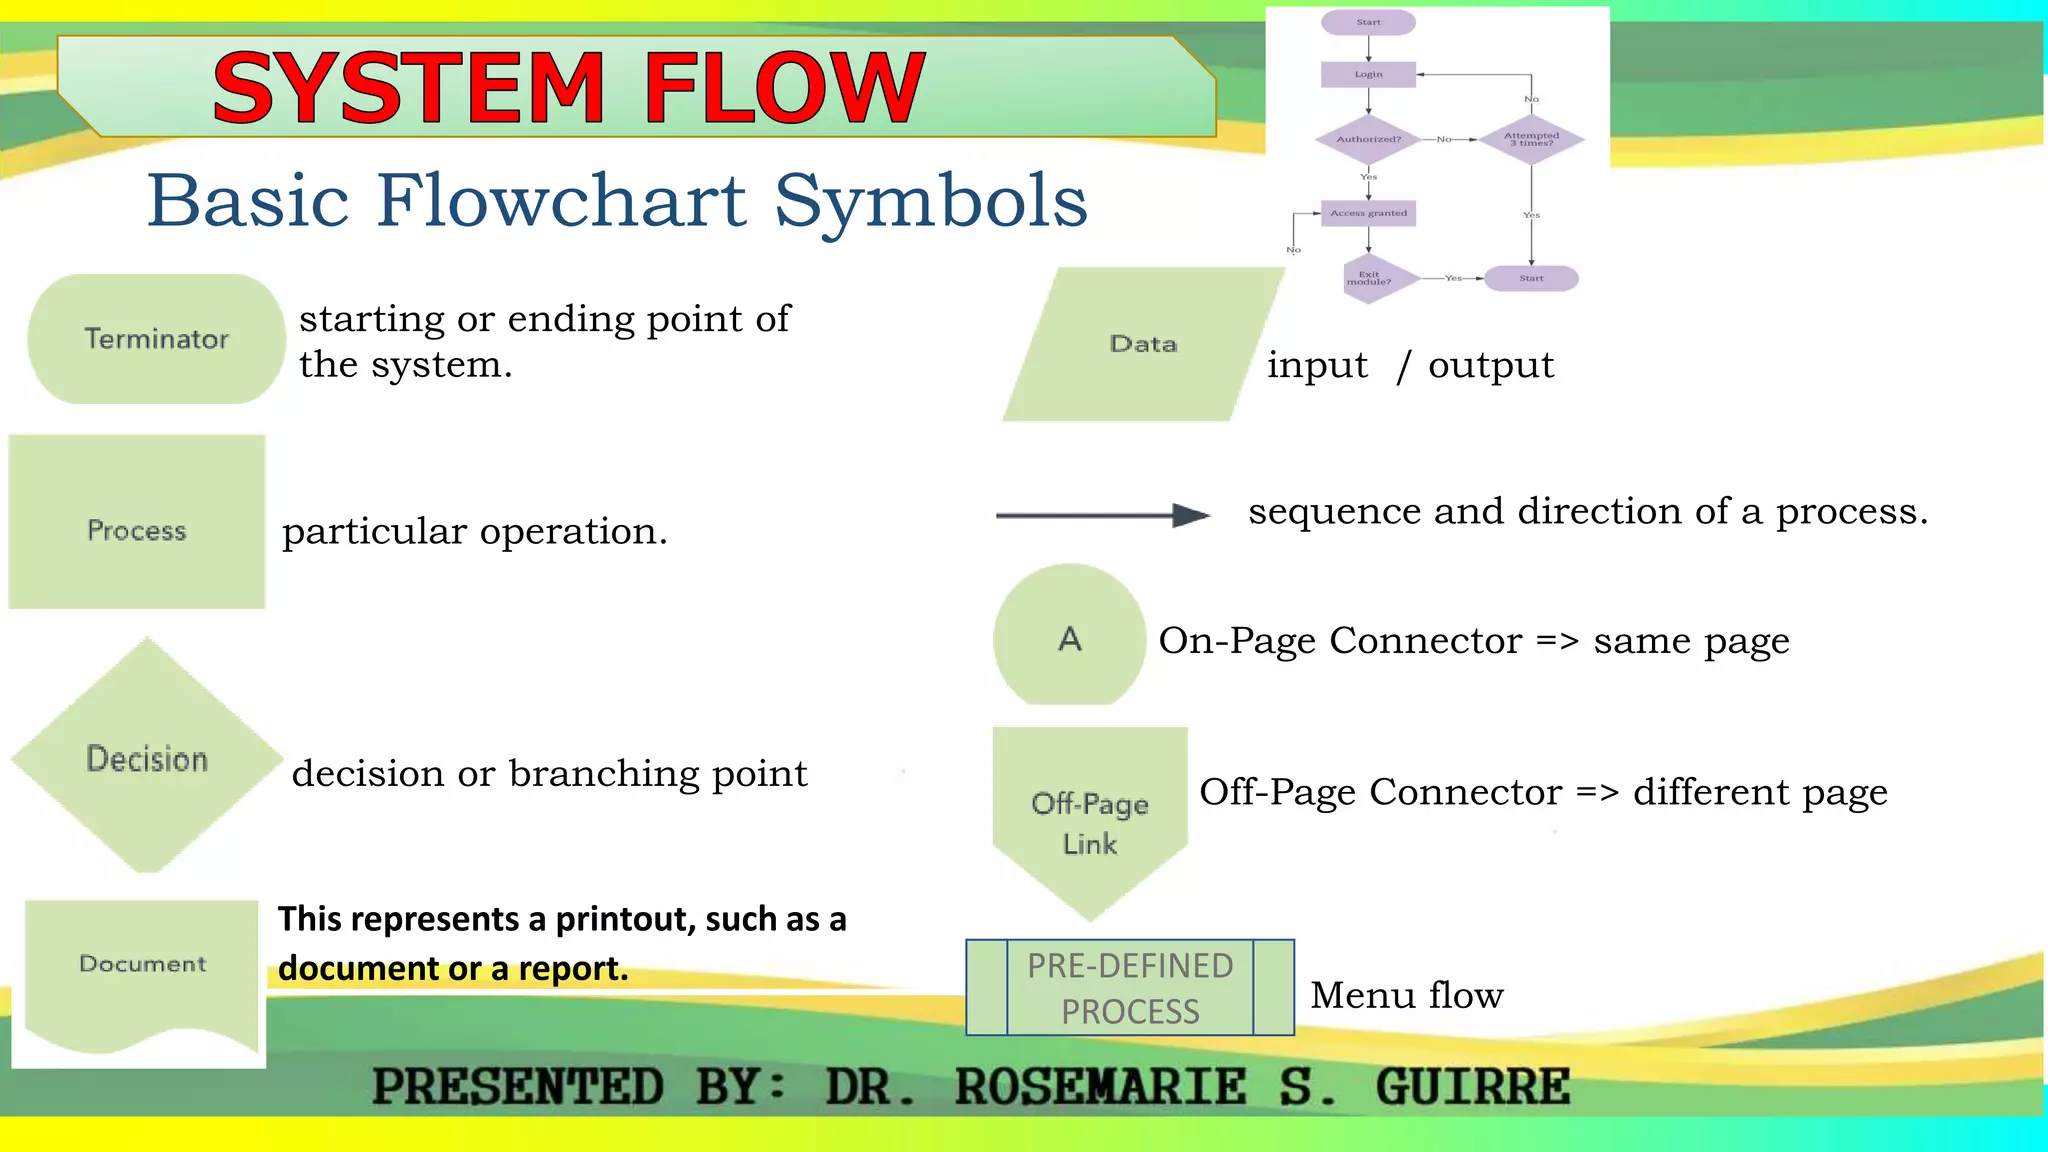

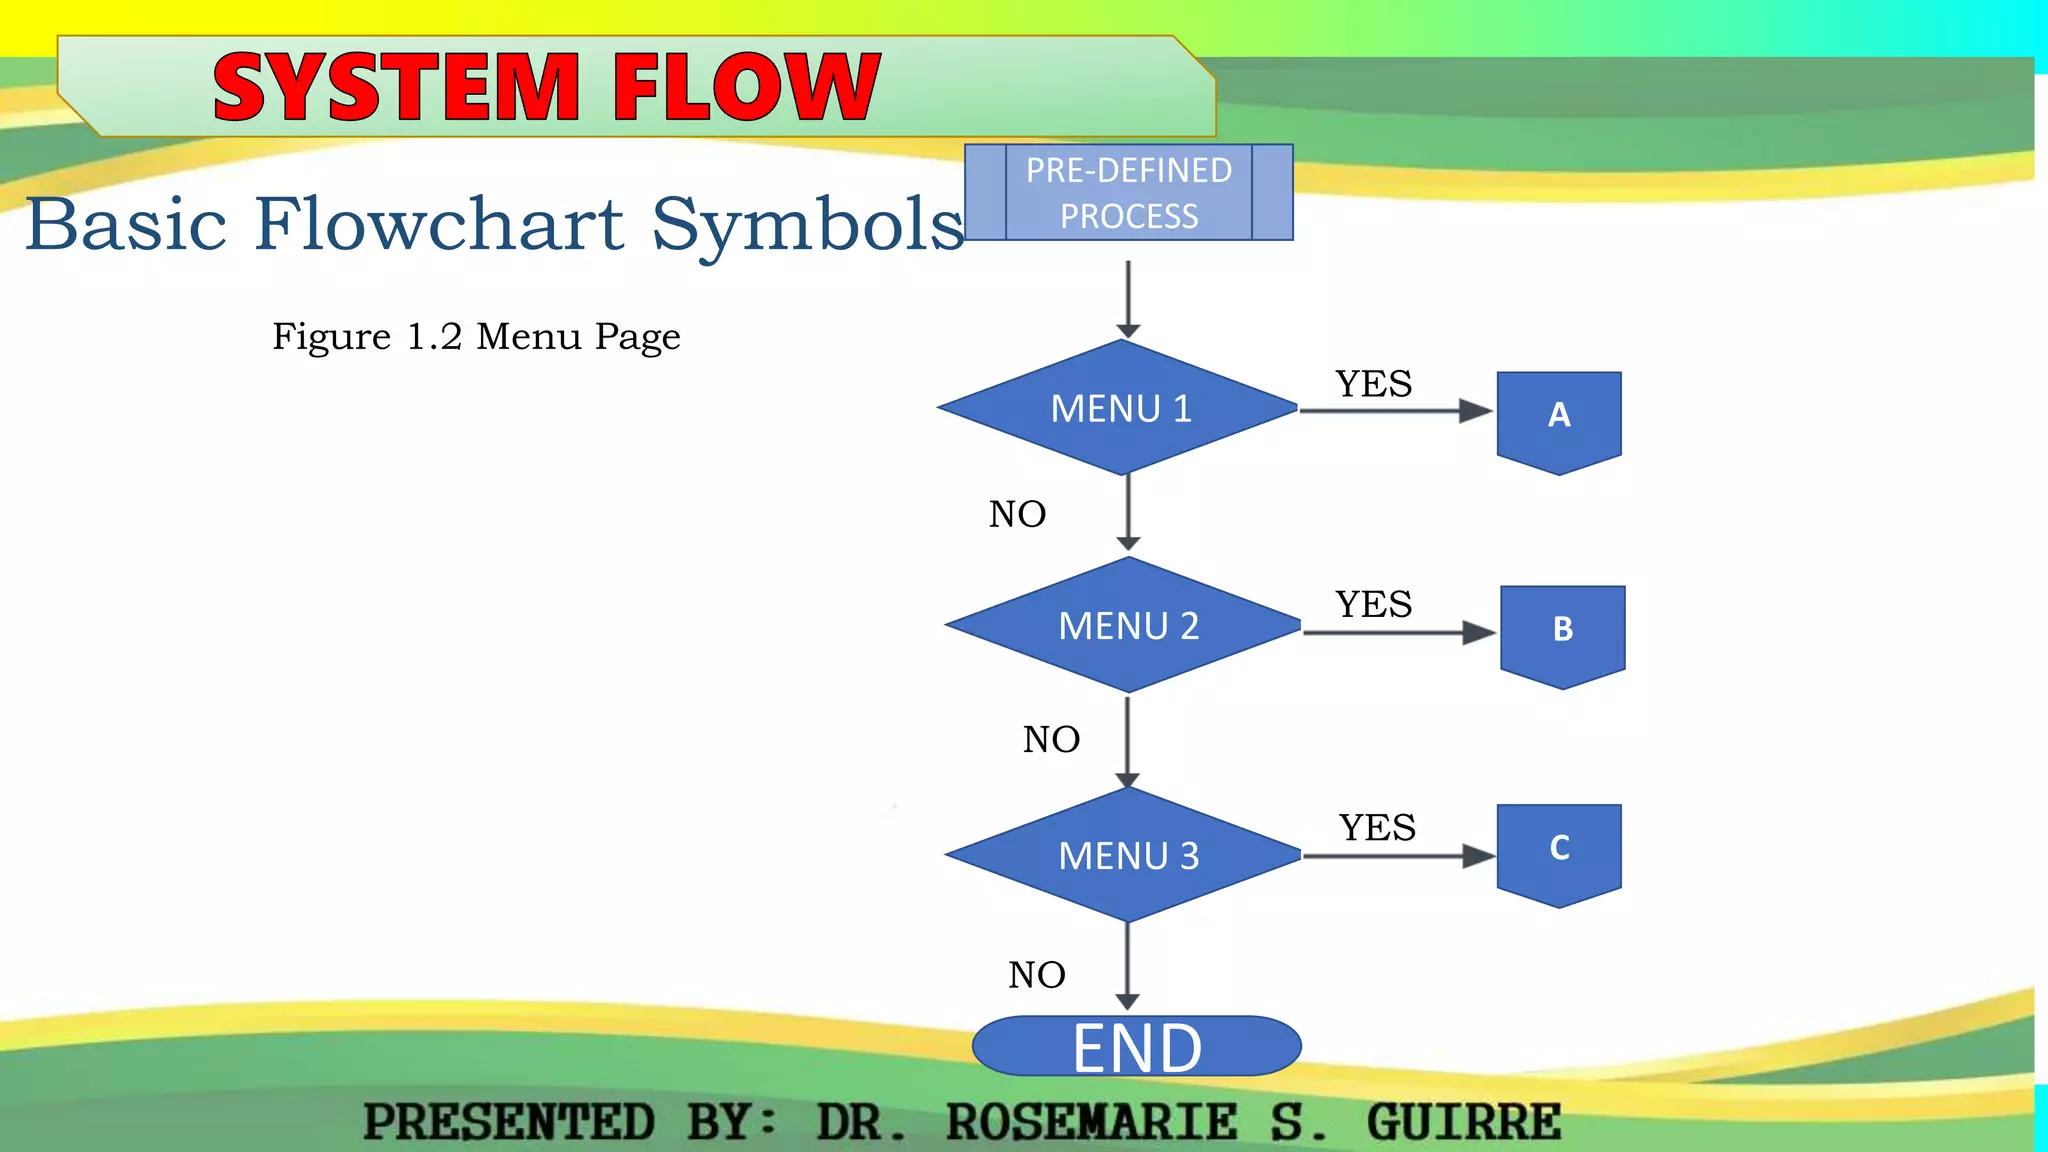


This document provides an overview of tools that can be used in structured systems analysis. It describes modeling system functions using data flow diagrams and system flowcharts. It also discusses modeling stored data using entity relationship diagrams and data dictionaries, as well as modeling program structure using variable table of contents, input-process-output diagrams, and program flowcharts. Additional modeling tools covered include Gantt charts, Warnier-Orr diagrams, Nassi-Schneiderman charts, state transition diagrams, and decision tables. Guidelines for developing data flow diagrams are also provided, along with examples of basic flowchart symbols and their use in illustrating processes, decisions, and menu flows.


