Downloaded 337 times


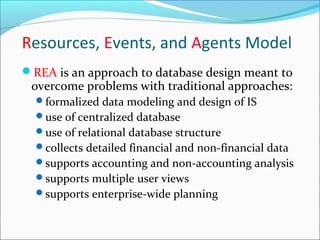
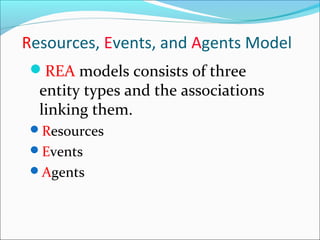
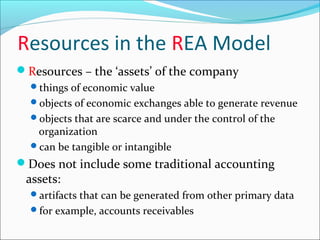
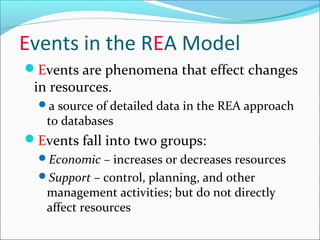


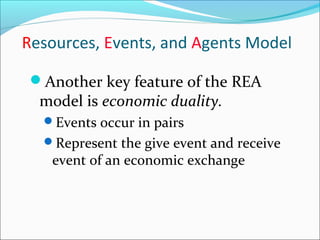


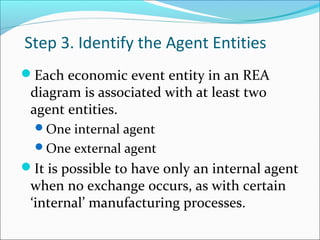
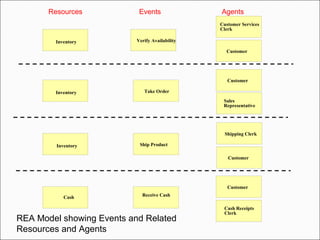

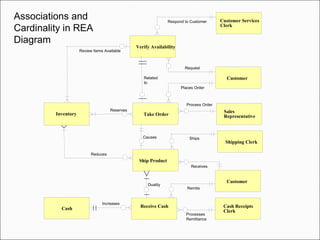

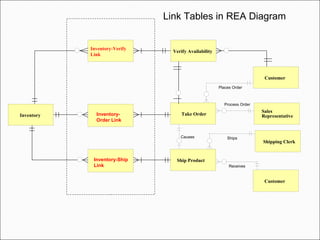
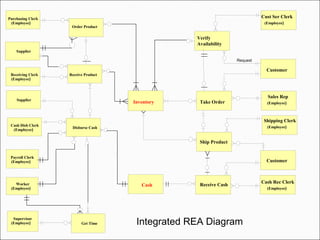


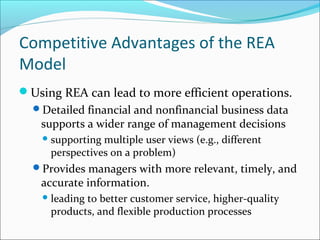

The document discusses the Resources, Events, Agents (REA) model for accounting information systems and database design. The REA model aims to overcome issues with traditional user-view oriented approaches by providing a formalized, centralized database structure that collects detailed financial and non-financial data to support accounting, analysis, and planning across the enterprise. The key aspects of the REA model include resources, events that impact resources, agents that participate in events, and the dual nature of economic events. The document outlines the steps for creating individual REA diagrams and integrating multiple diagrams into an enterprise-wide model, including identifying entities, determining relationships, and defining primary keys and attributes for implementation. Using REA can lead to more efficient operations and provide