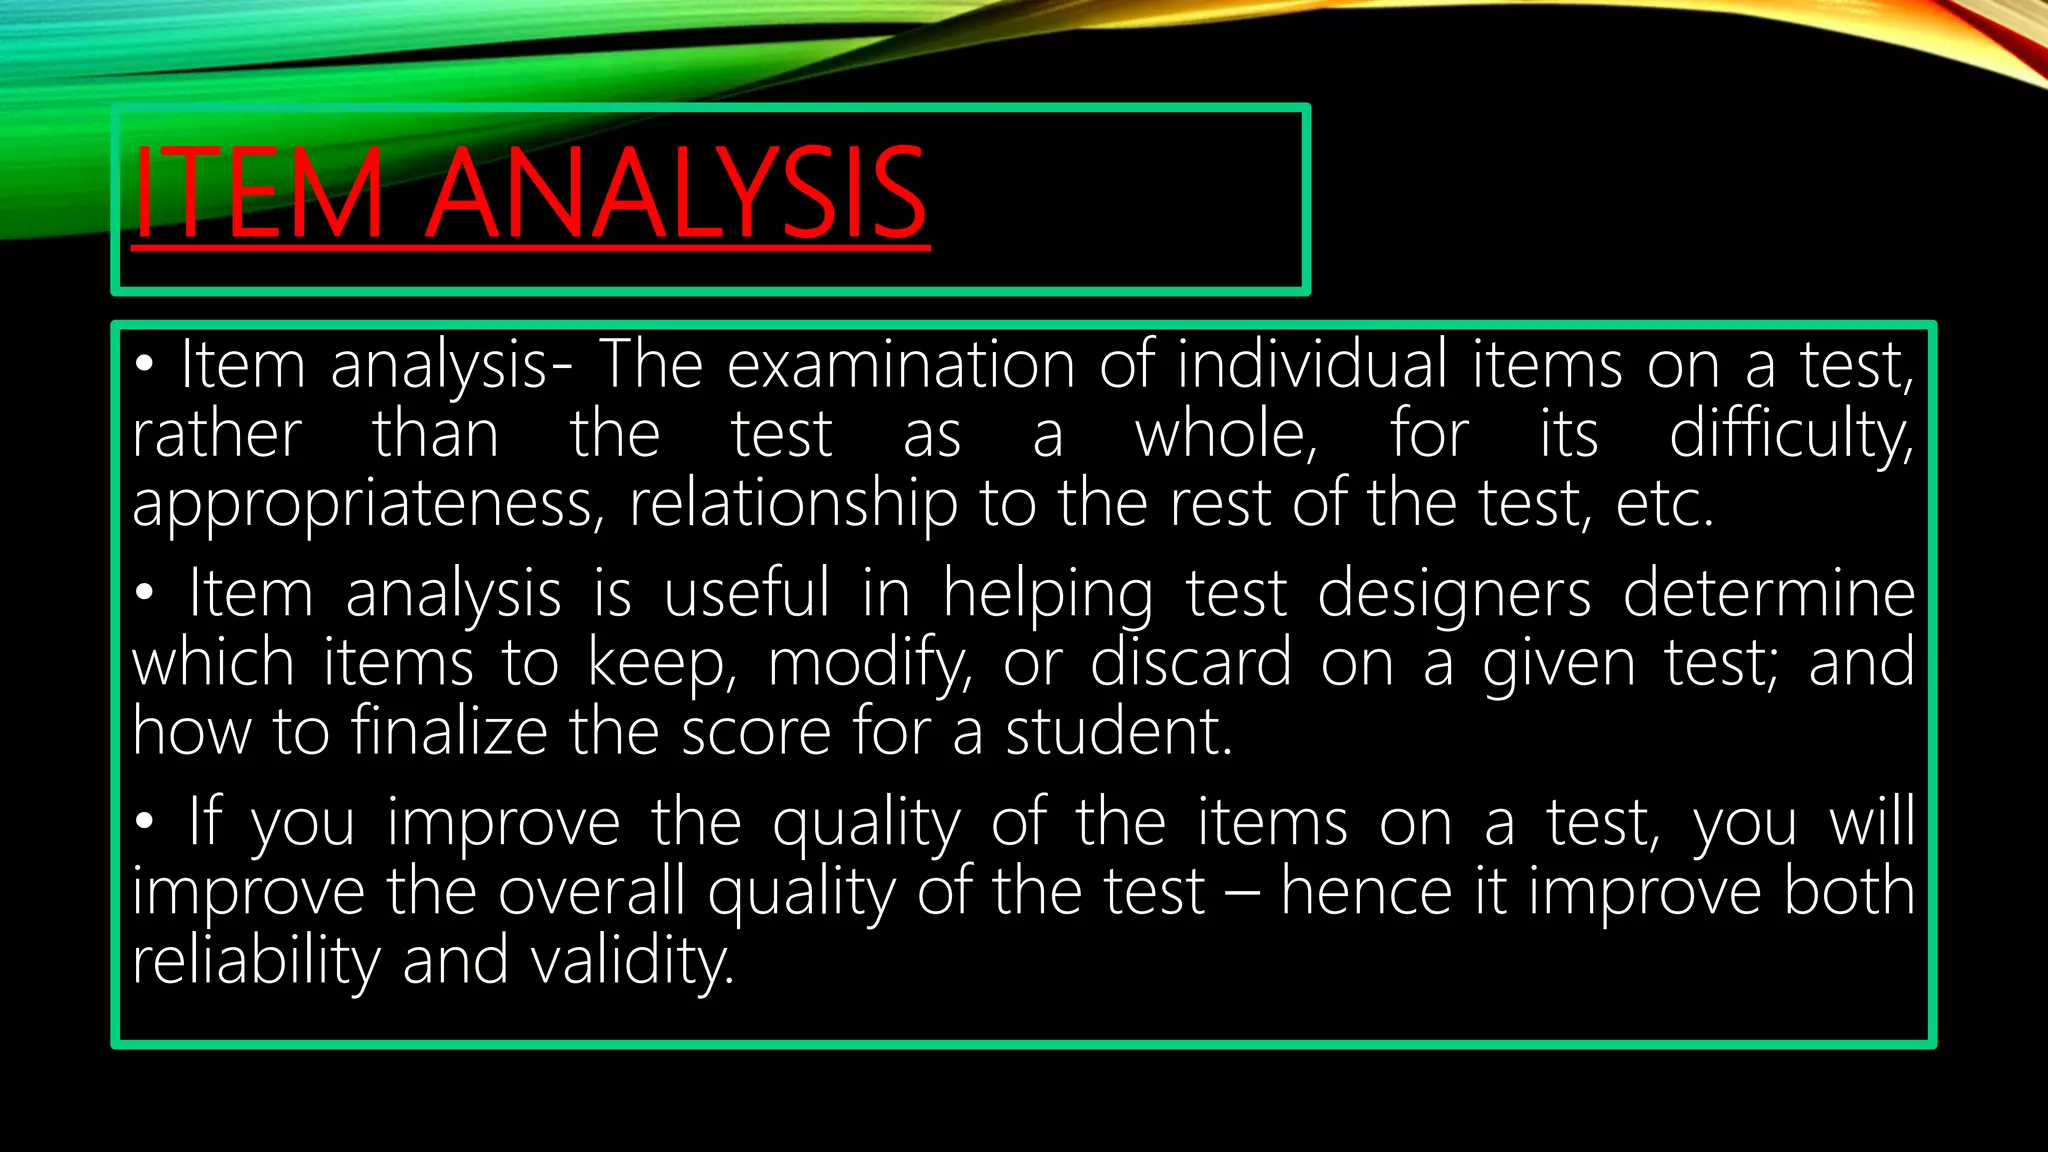
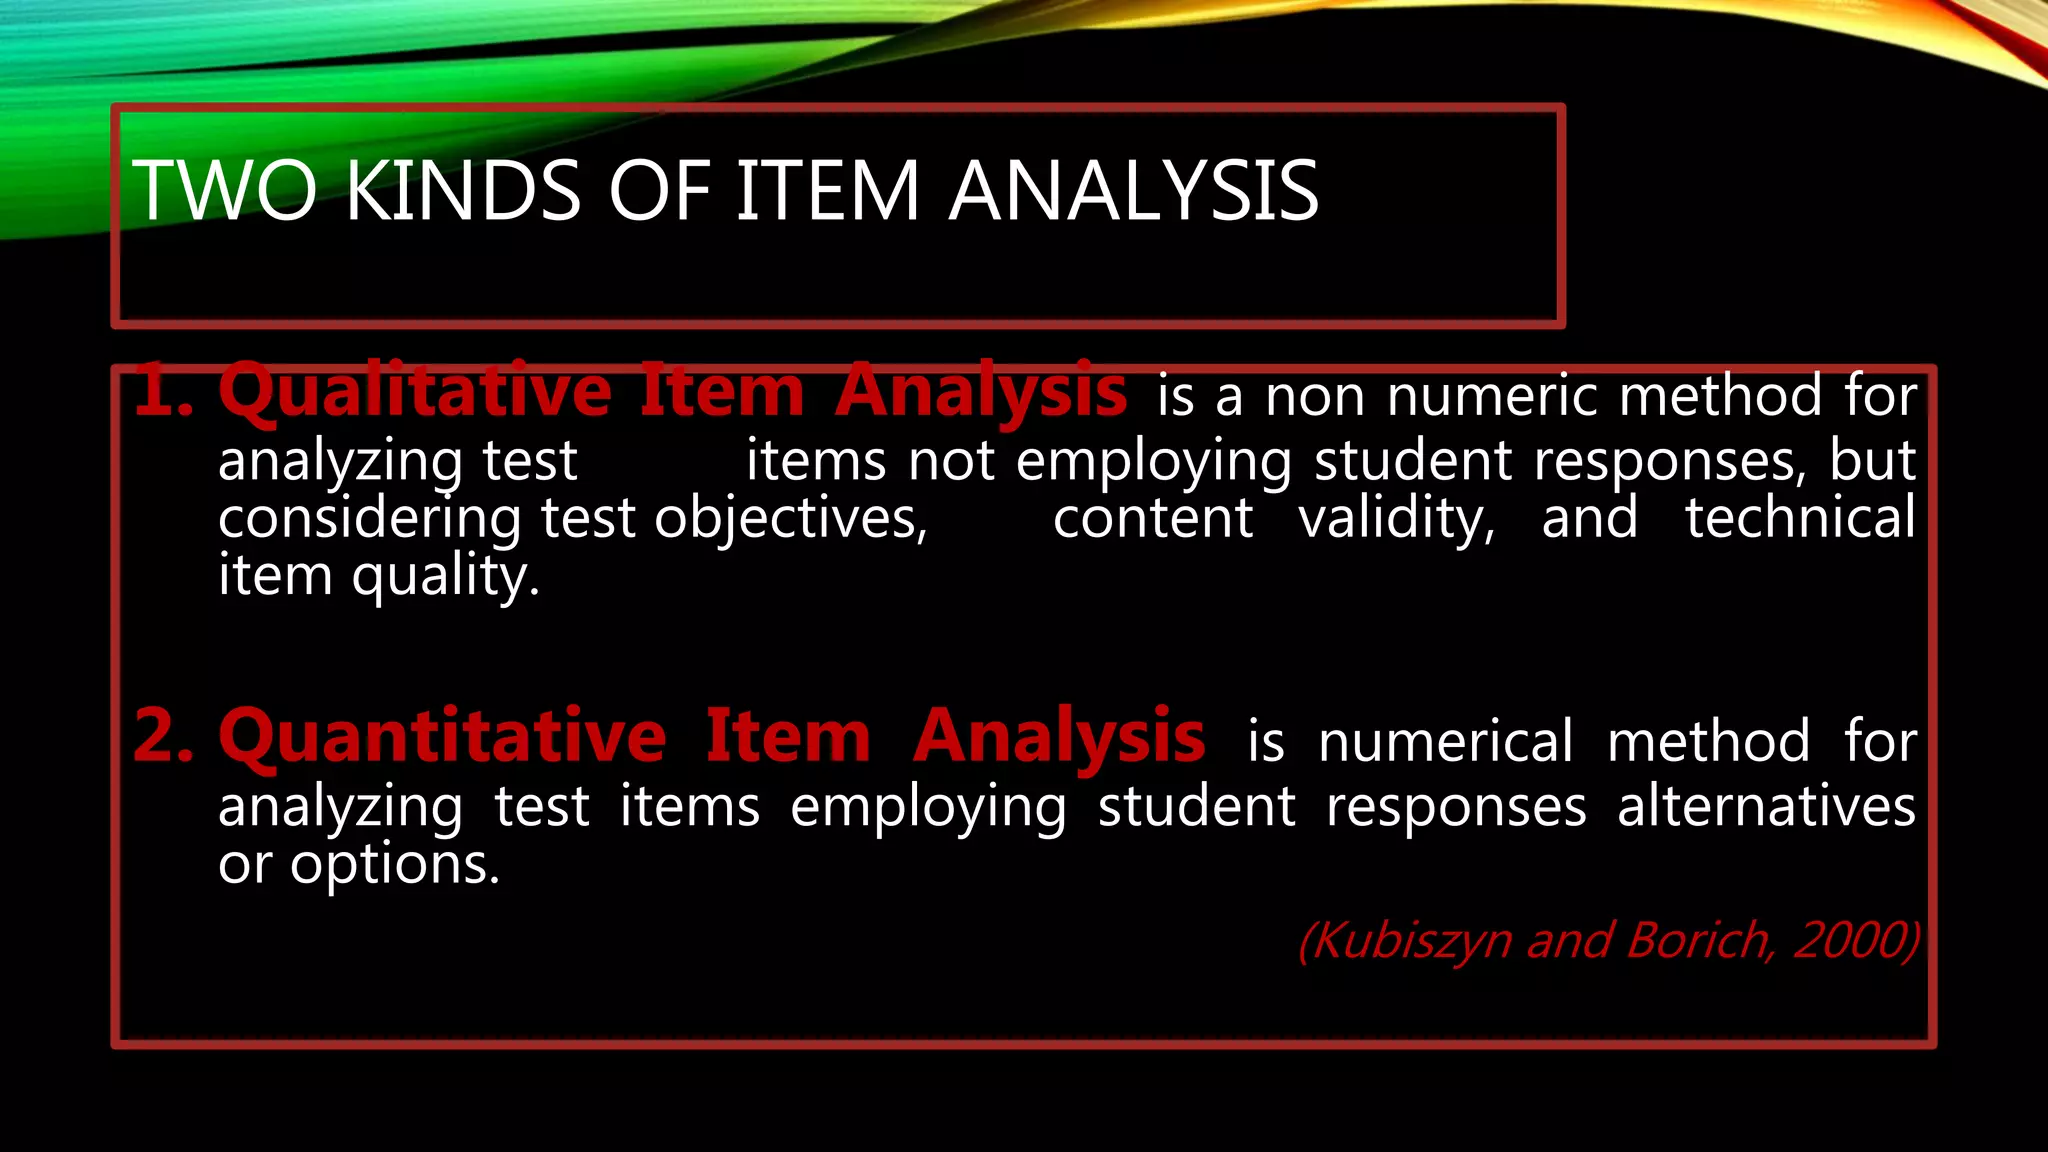
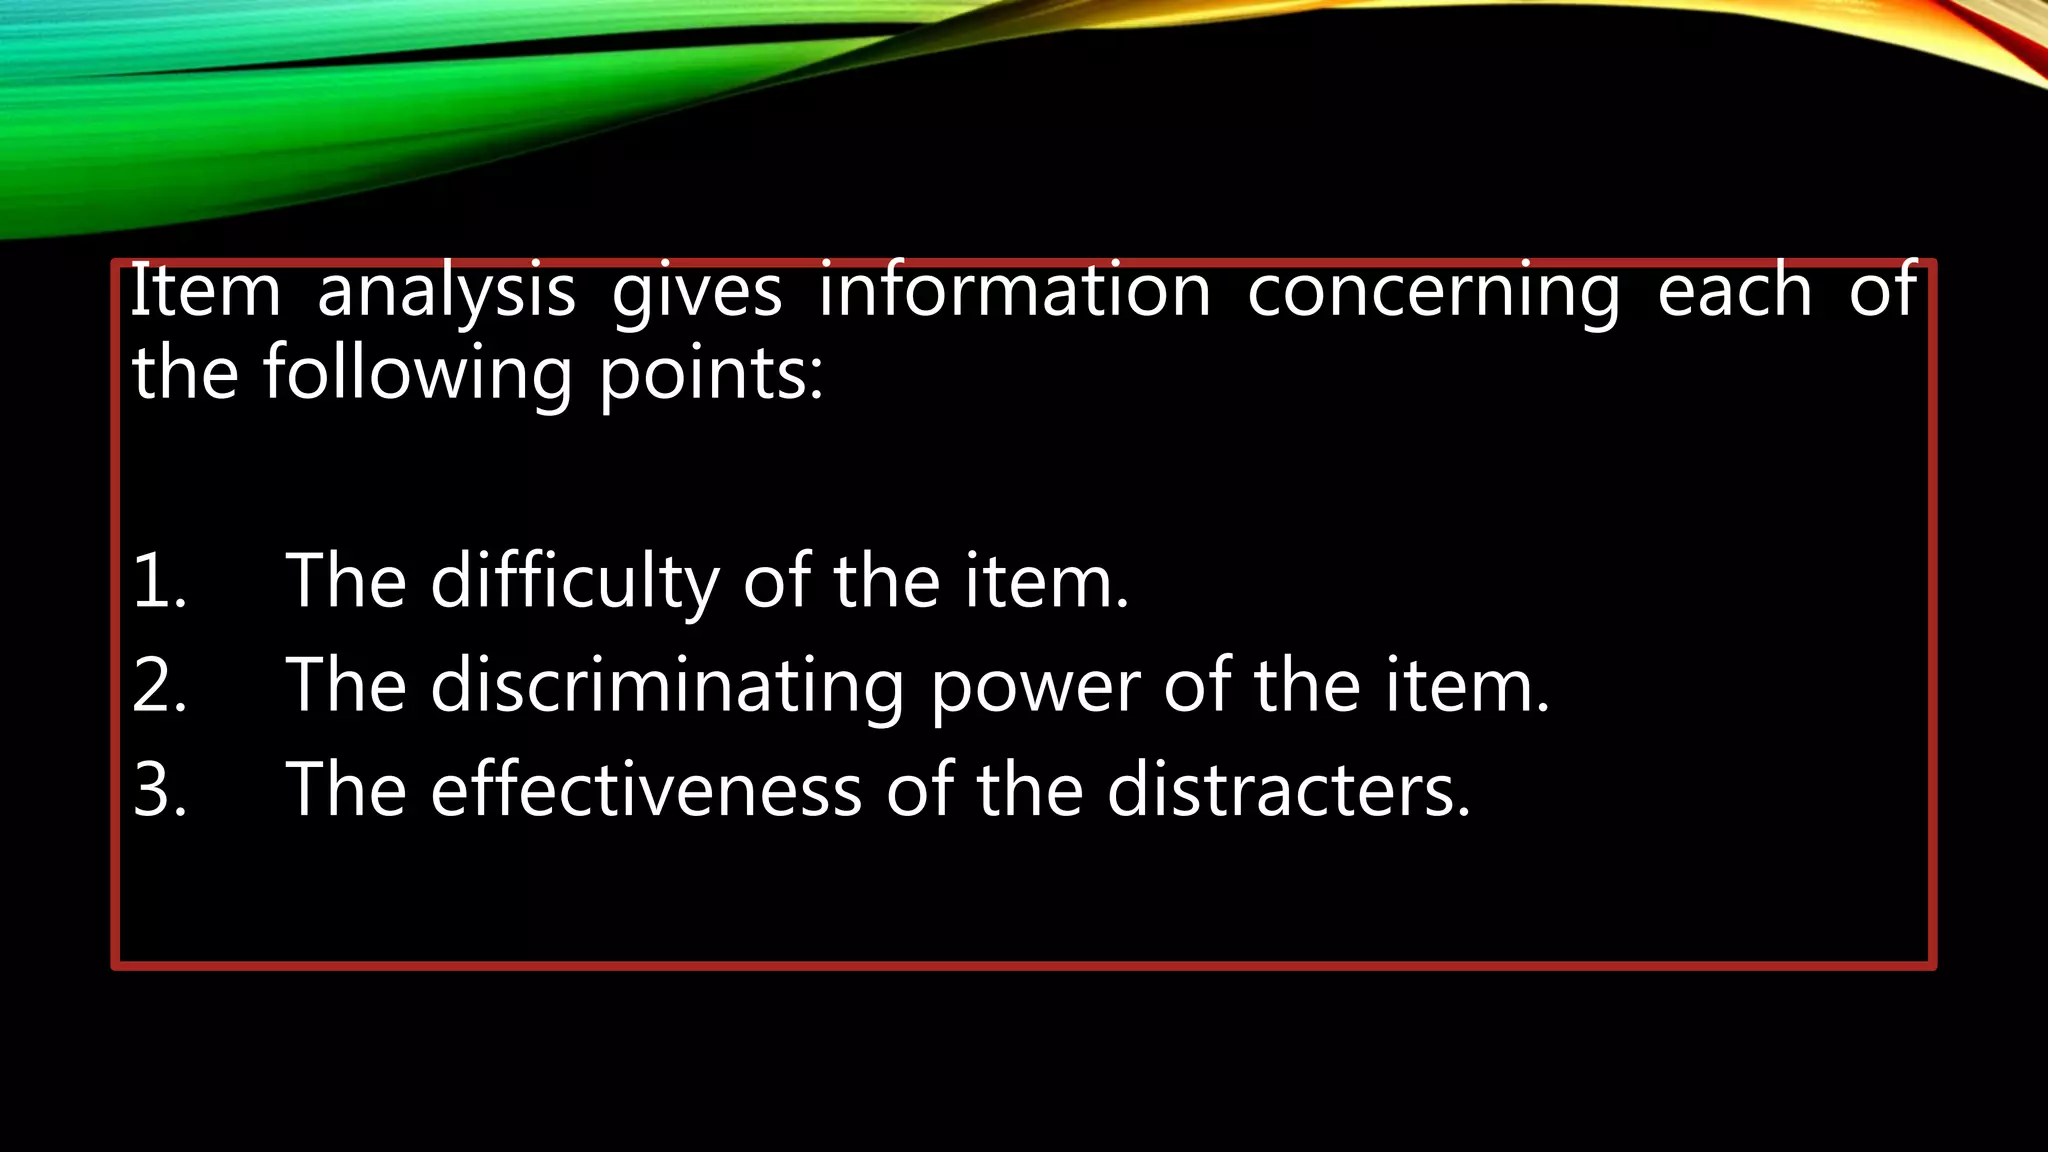
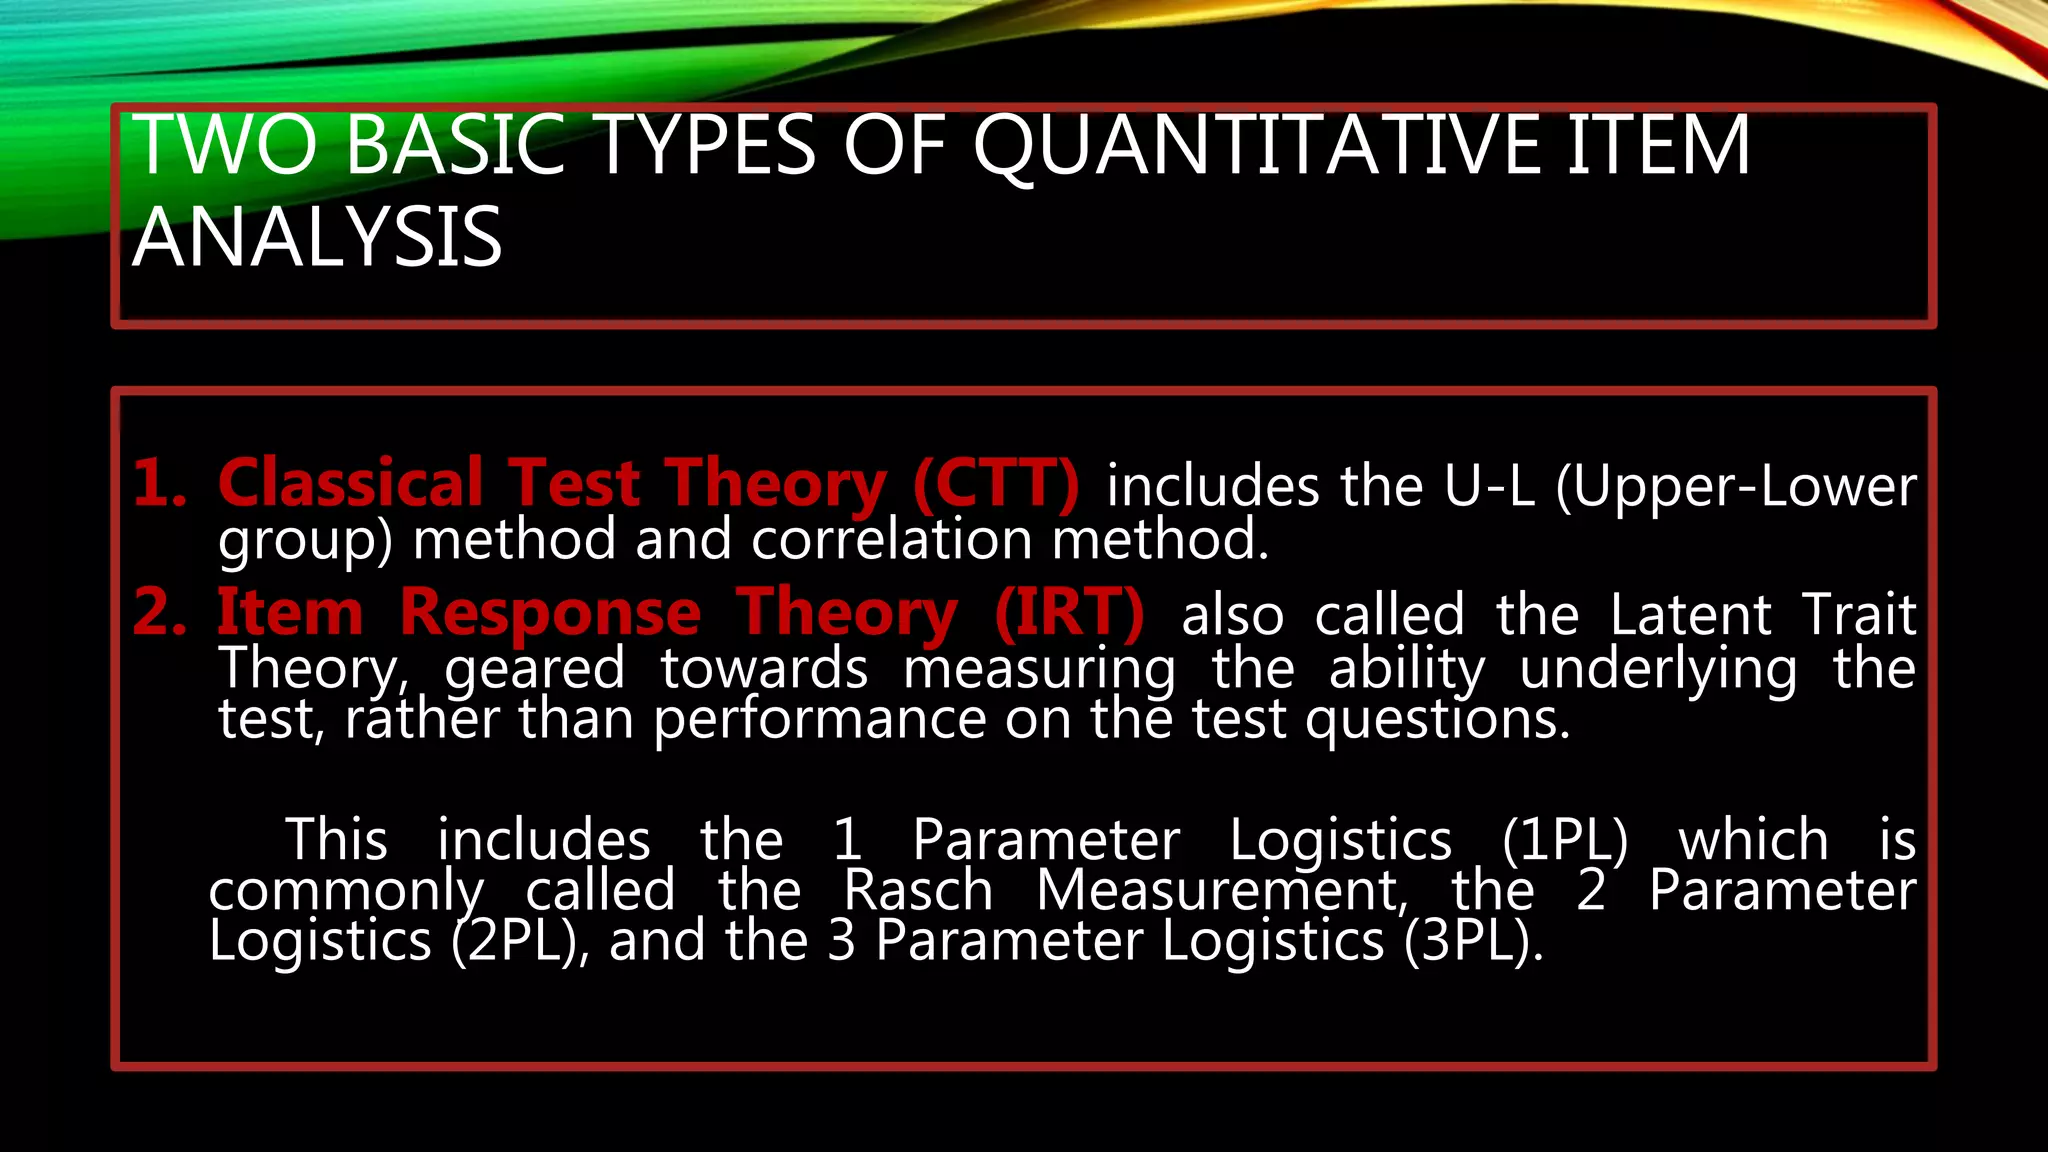
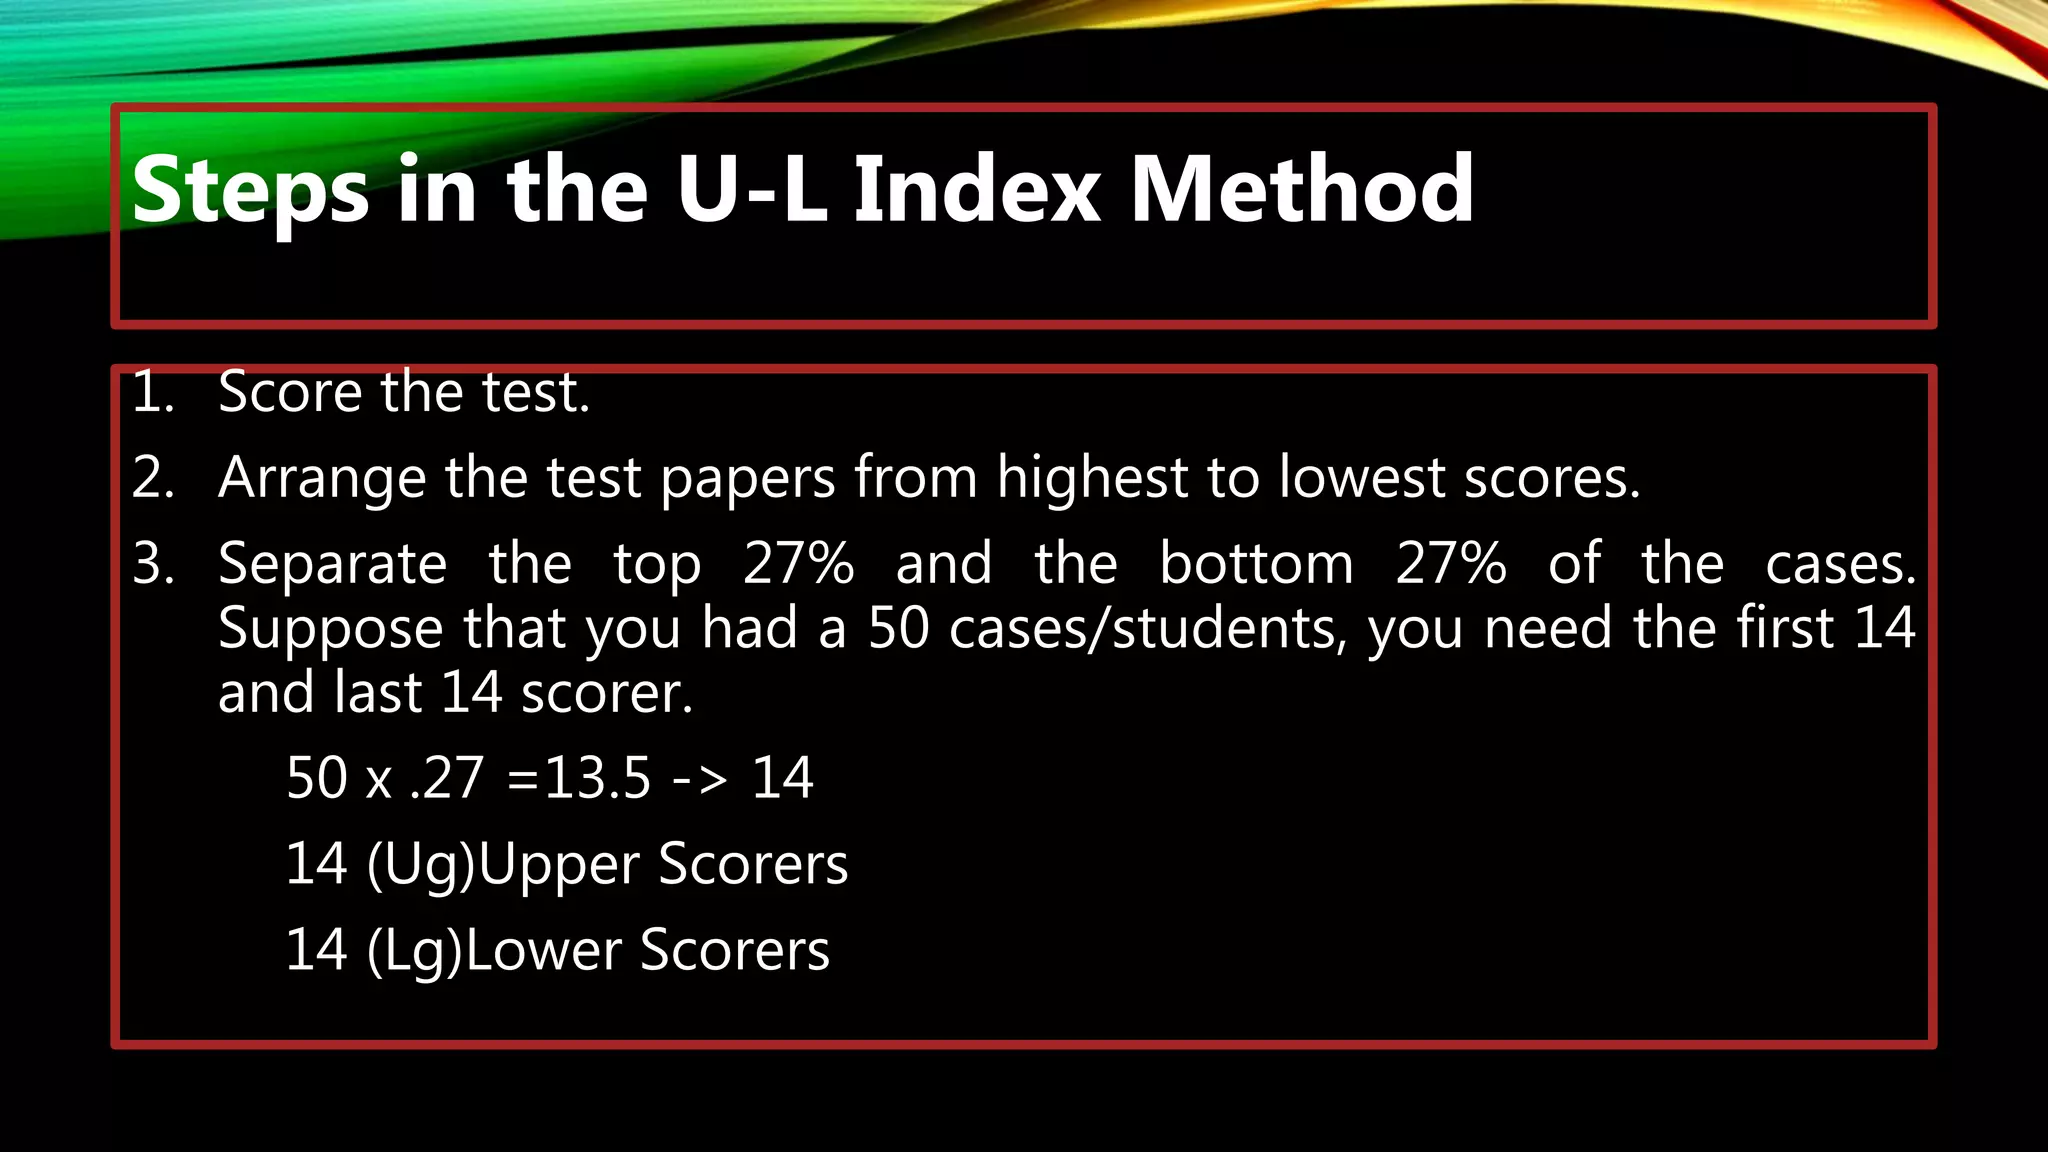
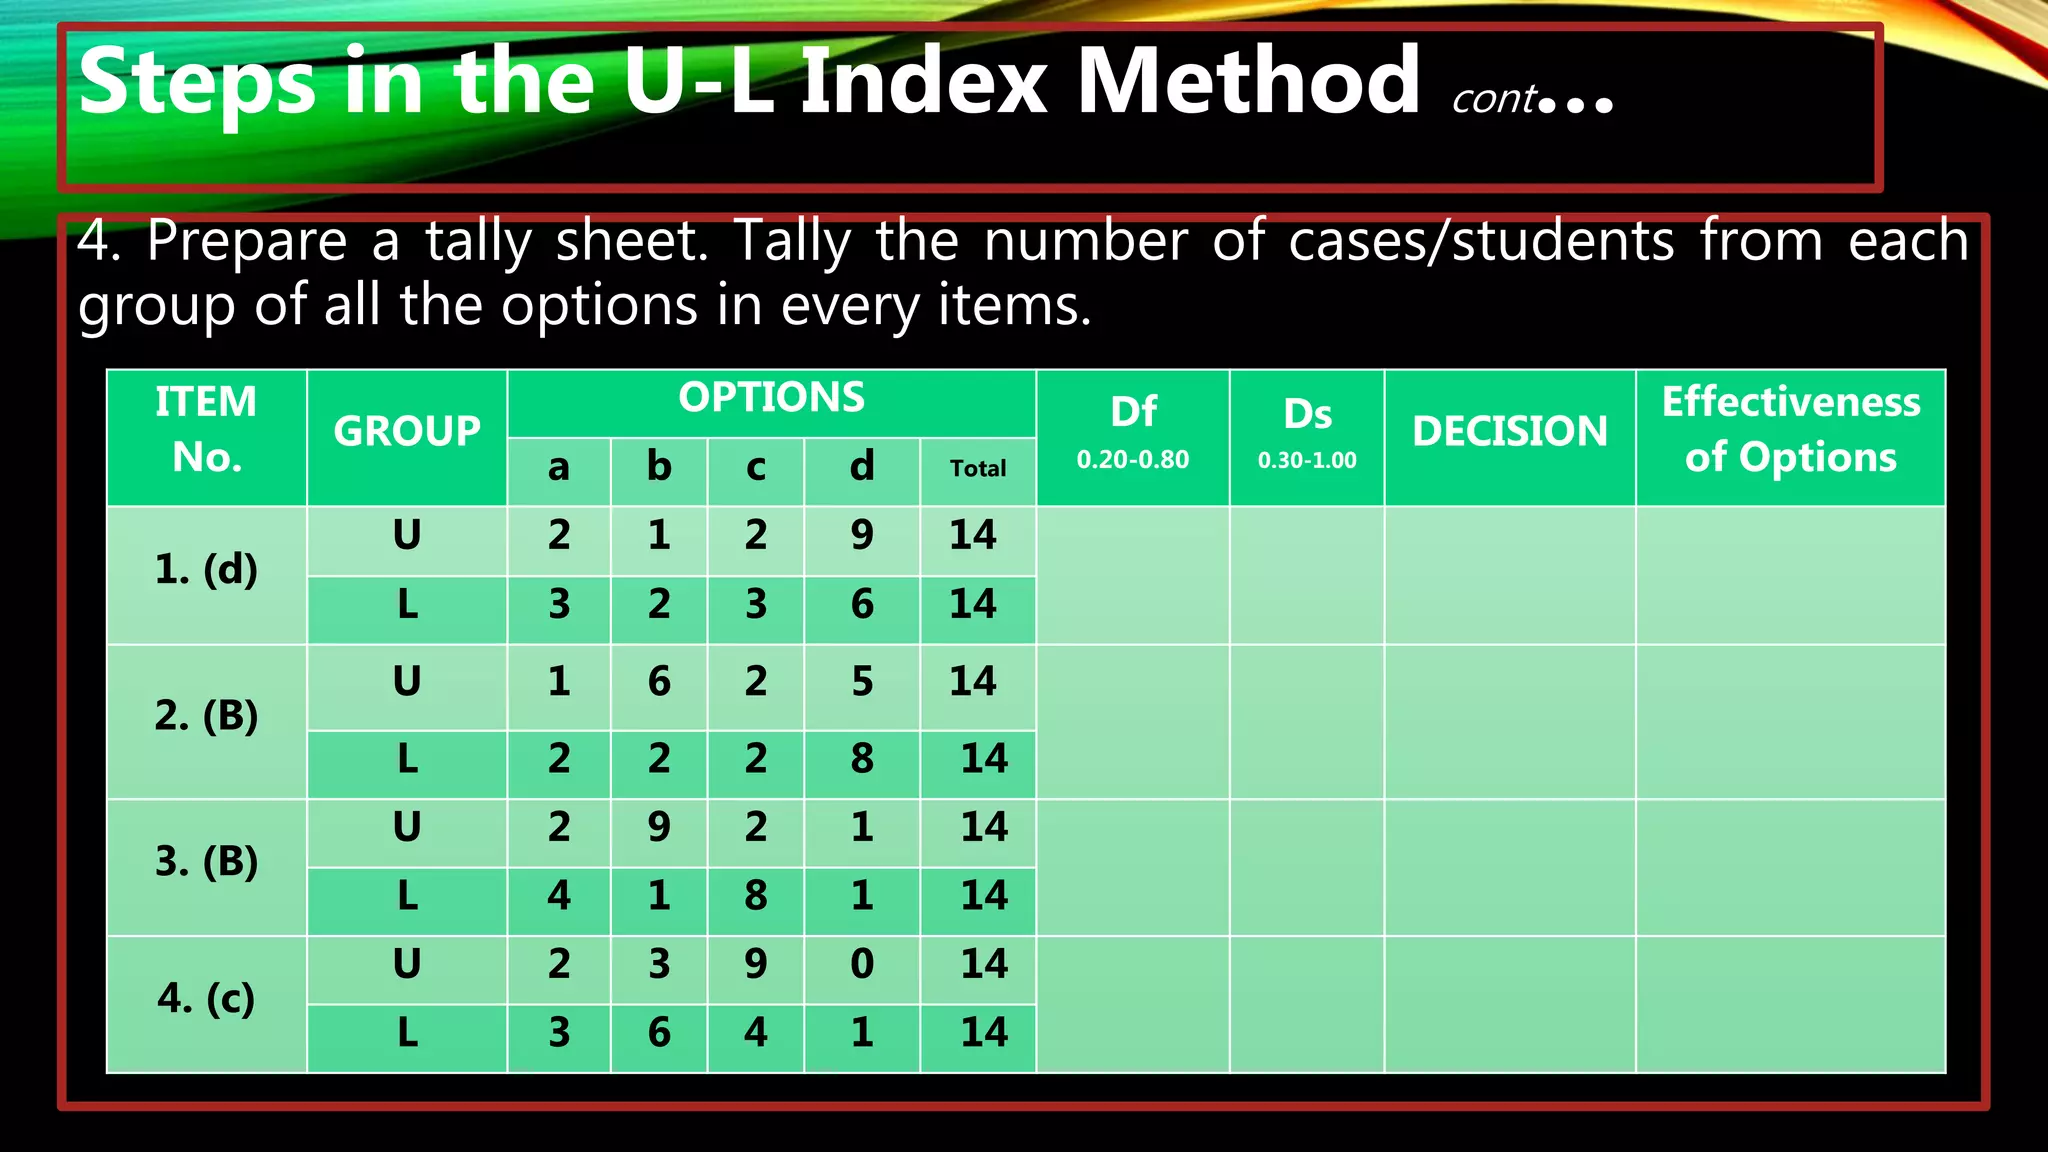
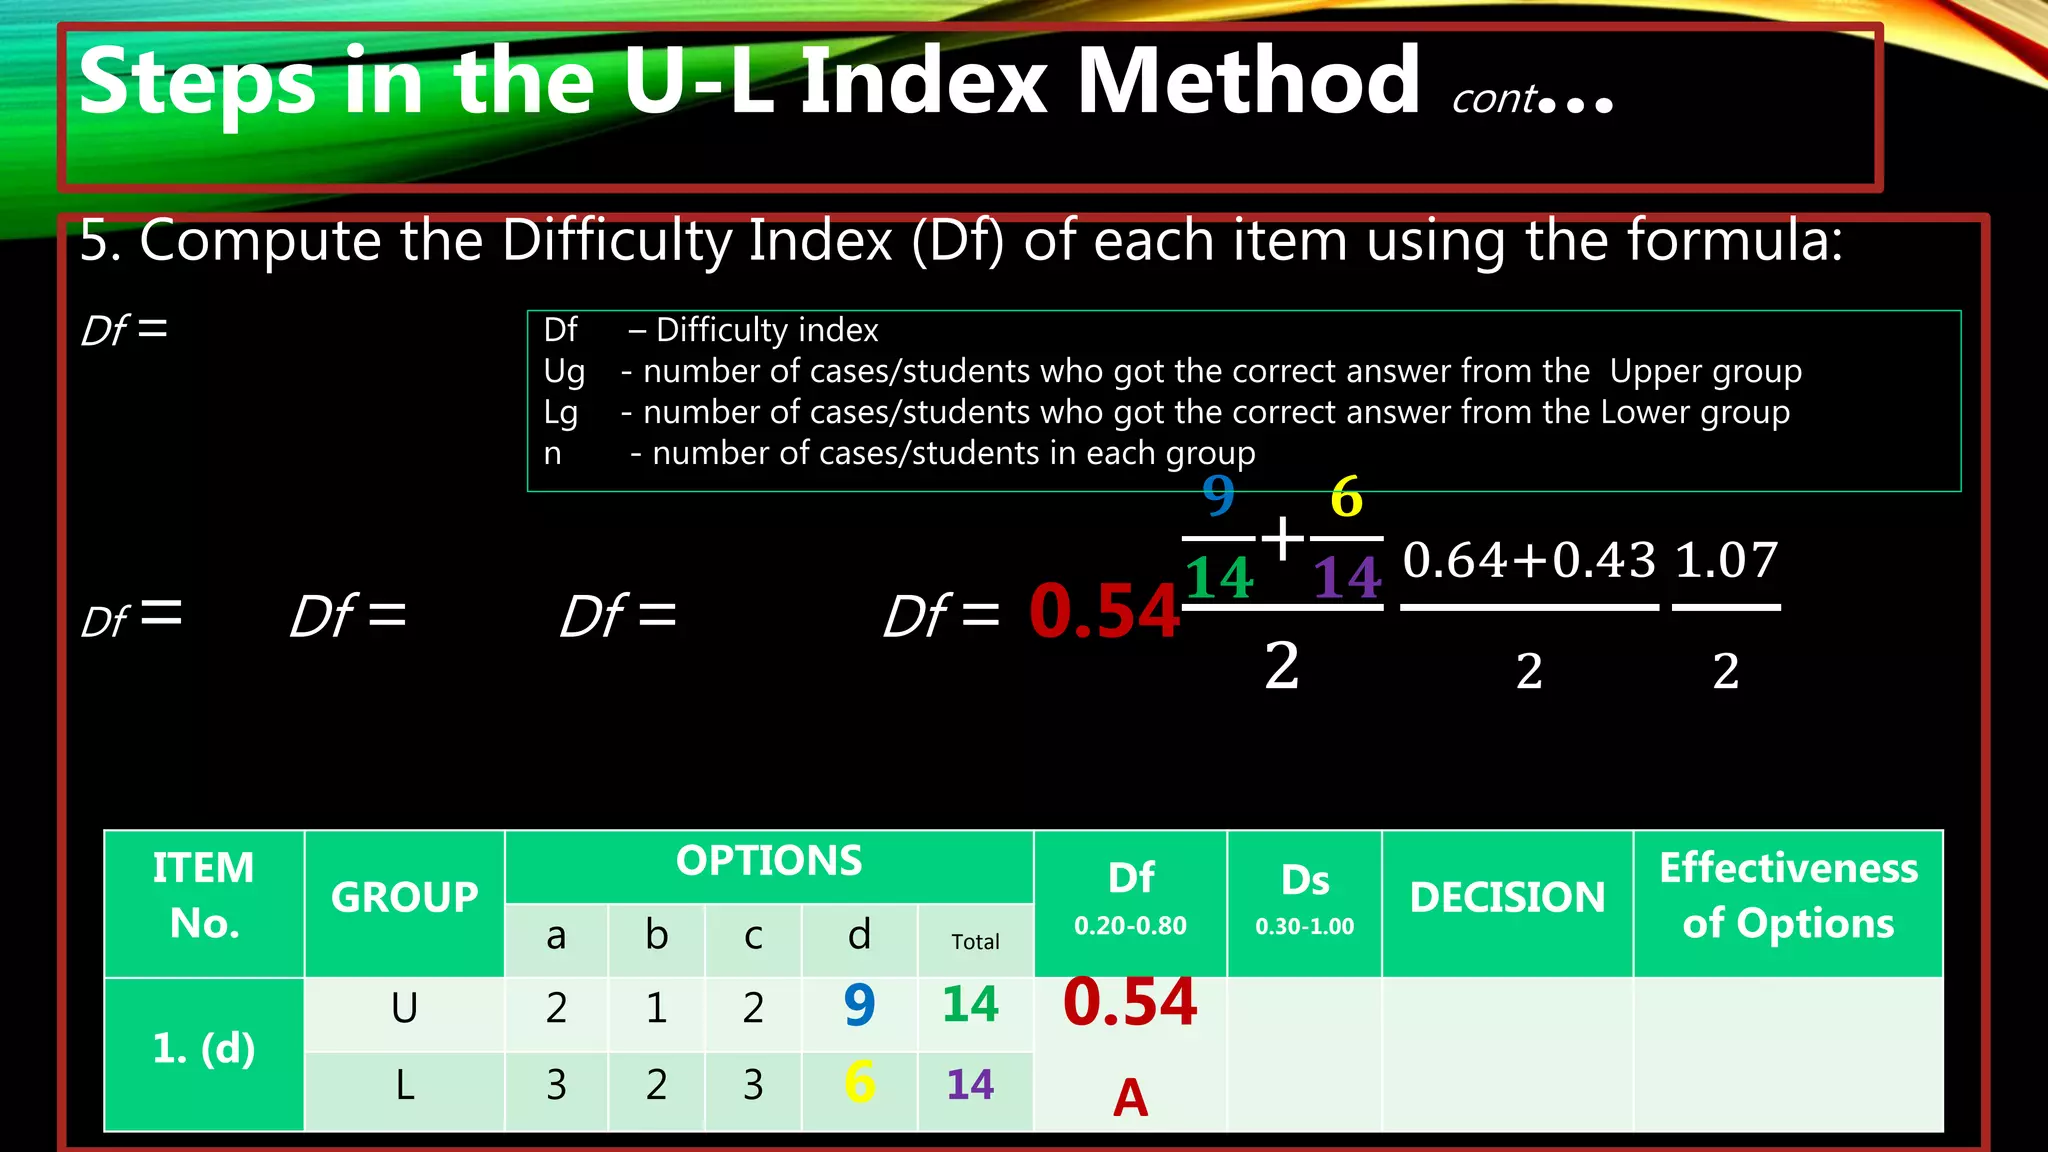
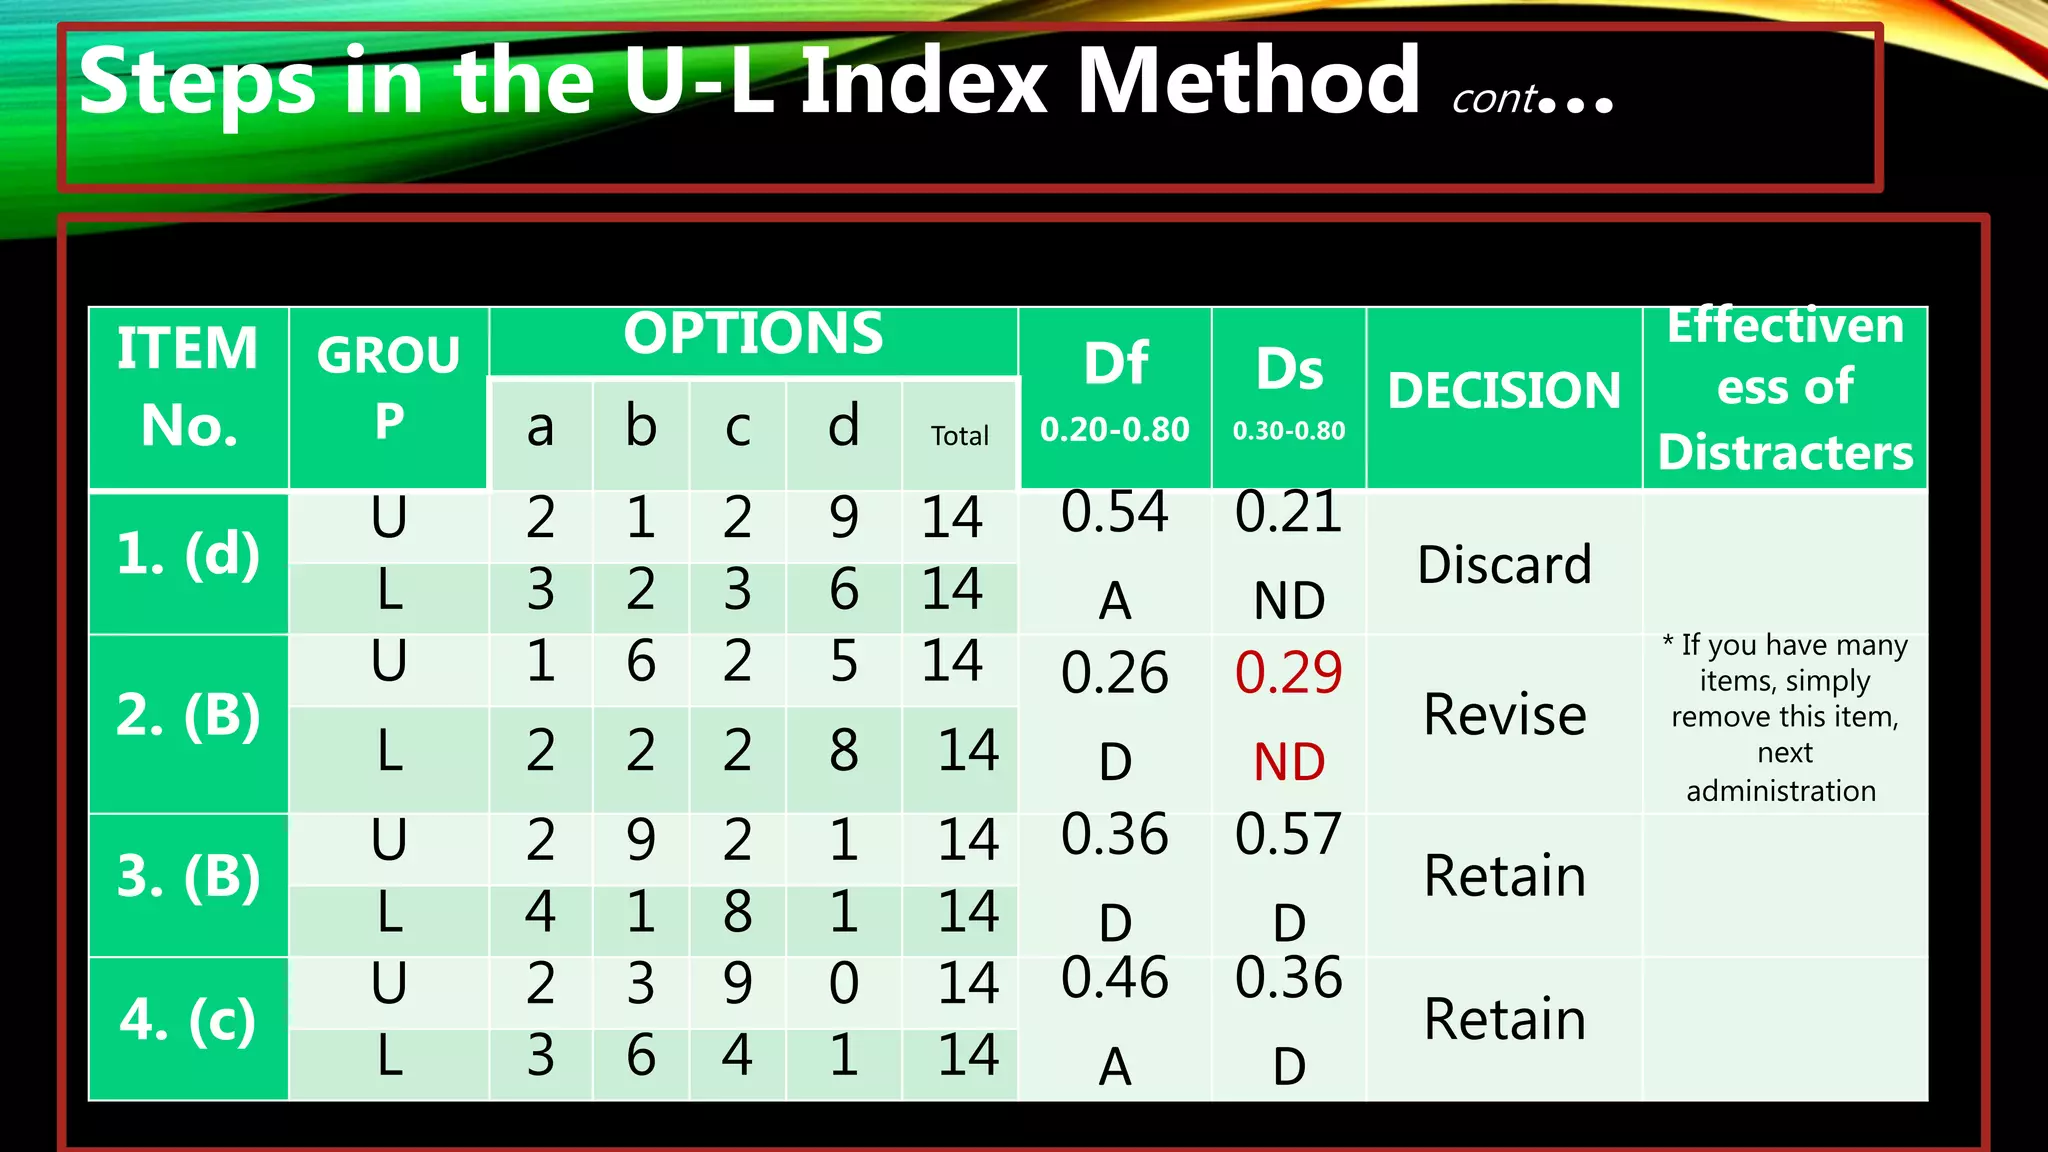
VIRTUAL SEMINAR-WORKSHOP ON
ASSESSMENT IN THE NEW NORMAL
TEST ITEM ANALYSIS
Dr. Martin L. Nobis, Jr.
Republic of the Philippines
University of Eastern Philippines
Laoang Campus
Laoang Northern Samar
COLLEGE OF EDUCATION
email: coed2021uepl@gmail.com
March 17, 2021
8:00 am
Zoom I cloud Conferencing
ITEM ANALYSIS
• Item analysis- The examination of individual items on a test,
rather than the test as a whole, for its difficulty,
appropriateness, relationship to the rest of the test, etc.
• Item analysis is useful in helping test designers determine
which items to keep, modify, or discard on a given test; and
how to finalize the score for a student.
• If you improve the quality of the items on a test, you will
improve the overall quality of the test – hence it improve both
reliability and validity.
TWO KINDS OF ITEM ANALYSIS
1. Qualitative Item Analysis is a non numeric method for
analyzing test items not employing student responses, but
considering test objectives, content validity, and technical
item quality.
2. Quantitative Item Analysis is numerical method for
analyzing test items employing student responses alternatives
or options.
(Kubiszyn and Borich, 2000)
Item analysis gives information concerning each of
the following points:
1. The difficulty of the item.
2. The discriminating power of the item.
3. The effectiveness of the distracters.
TWO BASIC TYPES OF QUANTITATIVE ITEM
ANALYSIS
1. Classical Test Theory (CTT) includes the U-L (Upper-Lower
group) method and correlation method.
2. Item Response Theory (IRT) also called the Latent Trait
Theory, geared towards measuring the ability underlying the
test, rather than performance on the test questions.
This includes the 1 Parameter Logistics (1PL) which is
commonly called the Rasch Measurement, the 2 Parameter
Logistics (2PL), and the 3 Parameter Logistics (3PL).
CONDUCTING AN ITEM ANALYSIS
Using the U-L Index Method
The U-L Index Method of item analysis was
advance by John Stocklein (1957). This is the
simplest procedure to be applied for teacher made
tests.
Steps in the U-L Index Method
1. Score the test.
2. Arrange the test papers from highest to lowest scores.
3. Separate the top 27% and the bottom 27% of the cases.
Suppose that you had a 50 cases/students, you need the first 14
and last 14 scorer.
50 x .27 =13.5 -> 14
14 (Ug)Upper Scorers
14 (Lg)Lower Scorers
Steps in the U-L Index Method cont…
4. Prepare a tally sheet. Tally the number of cases/students from each
group of all the options in every items.
ITEM
No.
GROUP
OPTIONS Df
0.20-0.80
Ds
0.30-1.00
DECISION
Effectiveness
of Options
a b c d Total
1. (d)
U 2 1 2 9 14
L 3 2 3 6 14
2. (B)
U 1 6 2 5 14
L 2 2 2 8 14
3. (B)
U 2 9 2 1 14
L 4 1 8 1 14
4. (c)
U 2 3 9 0 14
L 3 6 4 1 14
Steps in the U-L Index Method cont…
5. Compute the Difficulty Index (Df) of each item using the formula:
Df =
Df – Difficulty index
Ug - number of cases/students who got the correct answer from the Upper group
Lg - number of cases/students who got the correct answer from the Lower group
n - number of cases/students in each group
0.00-0.19 Very Difficult
0.20-0.39 Difficult
0.40-0.59 Average
0.60-0.79 Easy
0.80-1.00 Very Easy
Steps in the U-L Index Method cont…
5. Compute the Difficulty Index (Df) of each item using the formula:
Df =
Df = Df = Df = Df = 0.54
𝟗
𝟏𝟒
+
𝟔
𝟏𝟒
2
0.64+0.43
2
1.07
2
ITEM
No.
GROUP
OPTIONS Df
0.20-0.80
Ds
0.30-1.00
DECISION
Effectiveness
of Options
a b c d Total
1. (d)
U 2 1 2 9 14 0.54
A
L 3 2 3 6 14
Df – Difficulty index
Ug - number of cases/students who got the correct answer from the Upper group
Lg - number of cases/students who got the correct answer from the Lower group
n - number of cases/students in each group
Steps in the U-L Index Method cont…
6. Compute the Discrimination Index (Ds) of each item using the
formula:
Ds – Discrimination index
Ug - number of cases/students who got the correct answer from the Upper group
Lg - number of cases/students who got the correct answer from the Lower group
n - number of cases/students in each group
0.81-1.00 Highly Discriminating
0.30-0.80 Discriminating
0.01-0.29 Not Discriminating
Zero/Negative *improved
Steps in the U-L Index Method cont…
6. Compute the Discrimination Index (Ds) of each item using the
formula:
Ds= Ds = 0.21𝑫𝒔 =
𝟗
𝟏𝟒
−
𝟔
𝟏𝟒
0.64 − 0.43
ITEM
No.
GROUP
OPTIONS Df
0.20-0.80
Ds
0.30-1.00
DECISION
Effectiveness
of Options
a b c d Total
1. (d)
U 2 1 2 9 14 0.54
A
0.21
ND
L 3 2 3 6 14
Ds – Discrimination index
Ug - number of cases/students who got the correct answer
Lg - number of cases/students who got the correct answer
n - number of cases/students in each group
Steps in the U-L Index Method cont…
7. Deciding whether to retain, discard, or revise an item will be
based on two ranges. Items with difficulty indices within 0.20 – 0.80
and discrimination indices within 0.30 – 0.80 are retained. Revise if
either the value of Df or Ds not within the ideal range but very near to
the maximum or minimum the tolerable points is 0.03, Df and Ds
beyond the ideal ranges and tolerable points should be removed.
ITEM
No.
GROUP
OPTIONS Df
0.20-0.80
Ds
0.30-0.80
DECISION
Effectiveness
of Options
a b c d Total
1. (d)
U 2 1 2 9 14 0.54
A
0.21
ND
Discard/
Remove
L 3 2 3 6 14
Work shop…
ITEM
No.
GROU
P
OPTIONS
Df
0.20-0.80
Ds
0.30-0.80
DECISION
Effectiven
ess of
Distracters
a b c d Total
1. (d)
U 2 1 2 9 14 0.54
A
0.21
ND
Discard
L 3 2 3 6 14
2. (B)
U 1 6 2 5 14 0.26
D
0.29
ND ?
L 2 2 2 8 14
3. (B)
U 2 9 2 1 14 0.36
D
0.57
D ?
L 4 1 8 1 14
4. (c)
U 2 3 9 0 14 0.46
A
0.36
D ?
L 3 6 4 1 14
Steps in the U-L Index Method cont…
ITEM
No.
GROU
P
OPTIONS
Df
0.20-0.80
Ds
0.30-0.80
DECISION
Effectiven
ess of
Distracters
a b c d Total
1. (d)
U 2 1 2 9 14 0.54
A
0.21
ND
Discard
L 3 2 3 6 14
2. (B)
U 1 6 2 5 14 0.26
D
0.29
ND
Revise
* If you have many
items, simply
remove this item,
next
administration
L 2 2 2 8 14
3. (B)
U 2 9 2 1 14 0.36
D
0.57
D
Retain
L 4 1 8 1 14
4. (c)
U 2 3 9 0 14 0.46
A
0.36
D
Retain
L 3 6 4 1 14
Steps in the U-L Index Method cont…
8. Determine the effectiveness of the distracters. A GOOD Distracter
attracts students in the lower group more than the upper group.
Correct answer/option attracts students in the Ug more than the Lg.
ITEM No. GROUP
OPTIONS
Df
0.20-0.80
Ds
0.30-0.80
DECISION Effectiveness of Distracters
a b c d Total
1. (d)
U 2 1 2 9 14
0.54 0.21 Discard
Option a, b & c functions
effectively and are good
distracters because more
students from the LG are
attracted than from Ug,
Option d, the correct answer,
is good because more
students from the UG choose
the correct answer.
L 3 2 3 6 14
Work shop…
ITEM No. GROUP
OPTIONS Df
0.20-0.80
Ds
0.30-0.80
DECISIO
N
Effectiveness of Distracters
a b c d Total
2. (B)
U 1 6 2 5 14
0.26 0.29 Revise
L 2 2 2 8 14
3. (B)
U 2 9 2 1 14
0.36 0.57 Retain
L 4 1 8 1 14
4. (c)
U 2 3 9 0 14
0.46 0.36 Retain
L 3 6 4 1 14
Work shop…
ITEM No. GROUP
OPTIONS Df
0.20-0.80
Ds
0.30-0.80
DECISIO
N
Effectiveness of Distracters
a b c d Total
2. (B)
U 1 6 2 5 14
0.26 0.29 Revise
Option A & D are good distracters
because it is more attractive for the LG,
Option B- is good because more students
from the UG chose the correct answer. C
–is fair and not a good distracter.
L 2 2 2 8 14
3. (B)
U 2 9 2 1 14
0.36 0.57 Retain
Option A & C are good distracters
because they are more attractive for
the LG, B is a good option because
more students from the UG choose
the correct answer, D-is fair and not
good.
L 4 1 8 1 14
4. (c)
U 2 3 9 0 14
0.46 0.36 Retain
Option A, B & D are good distracters
because more students are attracted
from LG, C is a good option because
more students from UG choose the best
answer
L 3 6 4 1 14
Item analysis using excel
Item Analysis Using Computer
Software
Correlation Method
*Point-Biseral/item Total Correlation
Item Response Theory (IRT) Method
* 1 PL (Rasch Model)
* 2 PL
* 3 PL
Websites for Online Software:
http://www.surveyreaction.com/itemanalysis.asp
http://www.hr-software.net/cgi/ItemAnalysis.cgi
http://faculty.vassar.edu/lowry/pbcorr.html
References
Montecalvo E. B. 2016. Testing and Evaluation in Education. NwSSU
Kubiszyn and Borich, 2000. Qualitative and Quantitative Item Analysis.
Stocklien, J. 1957. Conducting an Item Analysis Using U-L Index Method
Thank you
for listening.

Item Analysis

  • 1.
    VIRTUAL SEMINAR-WORKSHOP ON ASSESSMENTIN THE NEW NORMAL TEST ITEM ANALYSIS Dr. Martin L. Nobis, Jr. Republic of the Philippines University of Eastern Philippines Laoang Campus Laoang Northern Samar COLLEGE OF EDUCATION email: coed2021uepl@gmail.com March 17, 2021 8:00 am Zoom I cloud Conferencing
  • 2.
    ITEM ANALYSIS • Itemanalysis- The examination of individual items on a test, rather than the test as a whole, for its difficulty, appropriateness, relationship to the rest of the test, etc. • Item analysis is useful in helping test designers determine which items to keep, modify, or discard on a given test; and how to finalize the score for a student. • If you improve the quality of the items on a test, you will improve the overall quality of the test – hence it improve both reliability and validity.
  • 3.
    TWO KINDS OFITEM ANALYSIS 1. Qualitative Item Analysis is a non numeric method for analyzing test items not employing student responses, but considering test objectives, content validity, and technical item quality. 2. Quantitative Item Analysis is numerical method for analyzing test items employing student responses alternatives or options. (Kubiszyn and Borich, 2000)
  • 4.
    Item analysis givesinformation concerning each of the following points: 1. The difficulty of the item. 2. The discriminating power of the item. 3. The effectiveness of the distracters.
  • 5.
    TWO BASIC TYPESOF QUANTITATIVE ITEM ANALYSIS 1. Classical Test Theory (CTT) includes the U-L (Upper-Lower group) method and correlation method. 2. Item Response Theory (IRT) also called the Latent Trait Theory, geared towards measuring the ability underlying the test, rather than performance on the test questions. This includes the 1 Parameter Logistics (1PL) which is commonly called the Rasch Measurement, the 2 Parameter Logistics (2PL), and the 3 Parameter Logistics (3PL).
  • 6.
    CONDUCTING AN ITEMANALYSIS Using the U-L Index Method The U-L Index Method of item analysis was advance by John Stocklein (1957). This is the simplest procedure to be applied for teacher made tests.
  • 7.
    Steps in theU-L Index Method 1. Score the test. 2. Arrange the test papers from highest to lowest scores. 3. Separate the top 27% and the bottom 27% of the cases. Suppose that you had a 50 cases/students, you need the first 14 and last 14 scorer. 50 x .27 =13.5 -> 14 14 (Ug)Upper Scorers 14 (Lg)Lower Scorers
  • 8.
    Steps in theU-L Index Method cont… 4. Prepare a tally sheet. Tally the number of cases/students from each group of all the options in every items. ITEM No. GROUP OPTIONS Df 0.20-0.80 Ds 0.30-1.00 DECISION Effectiveness of Options a b c d Total 1. (d) U 2 1 2 9 14 L 3 2 3 6 14 2. (B) U 1 6 2 5 14 L 2 2 2 8 14 3. (B) U 2 9 2 1 14 L 4 1 8 1 14 4. (c) U 2 3 9 0 14 L 3 6 4 1 14
  • 9.
    Steps in theU-L Index Method cont… 5. Compute the Difficulty Index (Df) of each item using the formula: Df = Df – Difficulty index Ug - number of cases/students who got the correct answer from the Upper group Lg - number of cases/students who got the correct answer from the Lower group n - number of cases/students in each group 0.00-0.19 Very Difficult 0.20-0.39 Difficult 0.40-0.59 Average 0.60-0.79 Easy 0.80-1.00 Very Easy
  • 10.
    Steps in theU-L Index Method cont… 5. Compute the Difficulty Index (Df) of each item using the formula: Df = Df = Df = Df = Df = 0.54 𝟗 𝟏𝟒 + 𝟔 𝟏𝟒 2 0.64+0.43 2 1.07 2 ITEM No. GROUP OPTIONS Df 0.20-0.80 Ds 0.30-1.00 DECISION Effectiveness of Options a b c d Total 1. (d) U 2 1 2 9 14 0.54 A L 3 2 3 6 14 Df – Difficulty index Ug - number of cases/students who got the correct answer from the Upper group Lg - number of cases/students who got the correct answer from the Lower group n - number of cases/students in each group
  • 11.
    Steps in theU-L Index Method cont… 6. Compute the Discrimination Index (Ds) of each item using the formula: Ds – Discrimination index Ug - number of cases/students who got the correct answer from the Upper group Lg - number of cases/students who got the correct answer from the Lower group n - number of cases/students in each group 0.81-1.00 Highly Discriminating 0.30-0.80 Discriminating 0.01-0.29 Not Discriminating Zero/Negative *improved
  • 12.
    Steps in theU-L Index Method cont… 6. Compute the Discrimination Index (Ds) of each item using the formula: Ds= Ds = 0.21𝑫𝒔 = 𝟗 𝟏𝟒 − 𝟔 𝟏𝟒 0.64 − 0.43 ITEM No. GROUP OPTIONS Df 0.20-0.80 Ds 0.30-1.00 DECISION Effectiveness of Options a b c d Total 1. (d) U 2 1 2 9 14 0.54 A 0.21 ND L 3 2 3 6 14 Ds – Discrimination index Ug - number of cases/students who got the correct answer Lg - number of cases/students who got the correct answer n - number of cases/students in each group
  • 13.
    Steps in theU-L Index Method cont… 7. Deciding whether to retain, discard, or revise an item will be based on two ranges. Items with difficulty indices within 0.20 – 0.80 and discrimination indices within 0.30 – 0.80 are retained. Revise if either the value of Df or Ds not within the ideal range but very near to the maximum or minimum the tolerable points is 0.03, Df and Ds beyond the ideal ranges and tolerable points should be removed. ITEM No. GROUP OPTIONS Df 0.20-0.80 Ds 0.30-0.80 DECISION Effectiveness of Options a b c d Total 1. (d) U 2 1 2 9 14 0.54 A 0.21 ND Discard/ Remove L 3 2 3 6 14
  • 14.
    Work shop… ITEM No. GROU P OPTIONS Df 0.20-0.80 Ds 0.30-0.80 DECISION Effectiven ess of Distracters ab c d Total 1. (d) U 2 1 2 9 14 0.54 A 0.21 ND Discard L 3 2 3 6 14 2. (B) U 1 6 2 5 14 0.26 D 0.29 ND ? L 2 2 2 8 14 3. (B) U 2 9 2 1 14 0.36 D 0.57 D ? L 4 1 8 1 14 4. (c) U 2 3 9 0 14 0.46 A 0.36 D ? L 3 6 4 1 14
  • 15.
    Steps in theU-L Index Method cont… ITEM No. GROU P OPTIONS Df 0.20-0.80 Ds 0.30-0.80 DECISION Effectiven ess of Distracters a b c d Total 1. (d) U 2 1 2 9 14 0.54 A 0.21 ND Discard L 3 2 3 6 14 2. (B) U 1 6 2 5 14 0.26 D 0.29 ND Revise * If you have many items, simply remove this item, next administration L 2 2 2 8 14 3. (B) U 2 9 2 1 14 0.36 D 0.57 D Retain L 4 1 8 1 14 4. (c) U 2 3 9 0 14 0.46 A 0.36 D Retain L 3 6 4 1 14
  • 16.
    Steps in theU-L Index Method cont… 8. Determine the effectiveness of the distracters. A GOOD Distracter attracts students in the lower group more than the upper group. Correct answer/option attracts students in the Ug more than the Lg. ITEM No. GROUP OPTIONS Df 0.20-0.80 Ds 0.30-0.80 DECISION Effectiveness of Distracters a b c d Total 1. (d) U 2 1 2 9 14 0.54 0.21 Discard Option a, b & c functions effectively and are good distracters because more students from the LG are attracted than from Ug, Option d, the correct answer, is good because more students from the UG choose the correct answer. L 3 2 3 6 14
  • 17.
    Work shop… ITEM No.GROUP OPTIONS Df 0.20-0.80 Ds 0.30-0.80 DECISIO N Effectiveness of Distracters a b c d Total 2. (B) U 1 6 2 5 14 0.26 0.29 Revise L 2 2 2 8 14 3. (B) U 2 9 2 1 14 0.36 0.57 Retain L 4 1 8 1 14 4. (c) U 2 3 9 0 14 0.46 0.36 Retain L 3 6 4 1 14
  • 18.
    Work shop… ITEM No.GROUP OPTIONS Df 0.20-0.80 Ds 0.30-0.80 DECISIO N Effectiveness of Distracters a b c d Total 2. (B) U 1 6 2 5 14 0.26 0.29 Revise Option A & D are good distracters because it is more attractive for the LG, Option B- is good because more students from the UG chose the correct answer. C –is fair and not a good distracter. L 2 2 2 8 14 3. (B) U 2 9 2 1 14 0.36 0.57 Retain Option A & C are good distracters because they are more attractive for the LG, B is a good option because more students from the UG choose the correct answer, D-is fair and not good. L 4 1 8 1 14 4. (c) U 2 3 9 0 14 0.46 0.36 Retain Option A, B & D are good distracters because more students are attracted from LG, C is a good option because more students from UG choose the best answer L 3 6 4 1 14
  • 19.
  • 20.
    Item Analysis UsingComputer Software Correlation Method *Point-Biseral/item Total Correlation Item Response Theory (IRT) Method * 1 PL (Rasch Model) * 2 PL * 3 PL Websites for Online Software: http://www.surveyreaction.com/itemanalysis.asp http://www.hr-software.net/cgi/ItemAnalysis.cgi http://faculty.vassar.edu/lowry/pbcorr.html
  • 21.
    References Montecalvo E. B.2016. Testing and Evaluation in Education. NwSSU Kubiszyn and Borich, 2000. Qualitative and Quantitative Item Analysis. Stocklien, J. 1957. Conducting an Item Analysis Using U-L Index Method
  • 22.